Innovate and industrialize | How Europe's off-shore wind sector can maintain market leadership and meet the continent's energy goals
←
→
Page content transcription
If your browser does not render page correctly, please read the page content below
Innovate and industrialize | How Europe's off-
shore wind sector can maintain market leadership
and meet the continent's energy goals
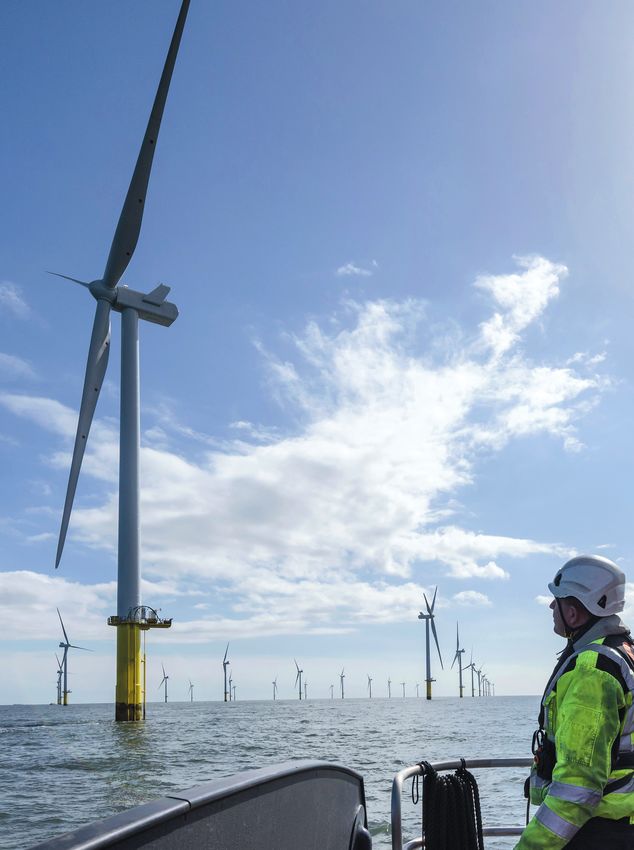
MANAGEMENT SUMMARY

Innovate and industrialize / How Europe's offshore
wind sector can maintain market leadership and meet
the continent's energy goals

The last decade saw a remarkable rise in offshore wind energy (OWE). This once
expensive and immature technology is now cost-competitive with electricity from
fossil sources. In fact, many countries now see offshore wind as a key pillar of their
decarbonization strategies to meet climate targets. Huge capacity expansions are
planned, with the European Union, for example, wanting to develop 300 GW of
OWE capacity by 2050 and make it a core component of Europe’s energy system.

While pursuing this growth, the European OWE sector must innovate and industrialize
to maintain its market dominance. To secure its global leadership, the sector must
target the following advancements: converting OWE to hydrogen, developing floating
OWE technology and cutting costs.

Hydrogen is now fully accepted as one of the cornerstones of the energy transition.
By converting OWE to hydrogen at the source offshore, decarbonization goals
can be achieved faster and at lower costs, with more reliable energy delivery and less
environmental impact. With floating technology, wind can be harnessed along deeper
coastal waters. Floating OWE could even be combined with hydrogen conversion
to enable hydrogen production in remote waters known for strong and consistent
winds. But to exploit these opportunities, OWE costs need to come down even
more than they already have. This can be achieved through technological innovation
and industrialization, such as the use of digital maintenance and increased parts
standardization.

Global competition poses a serious threat to Europe's OWE dominance, having won
first contracts in European waters. To fend off these competitors, European players
must act. If they do, they can fortify their position as the world's offshore wind leaders,
and build a future above and beyond carbon for their own economies and citizens,
and for the planet as a whole.
PAGE   CONTENTS

                                            4      Introduction
                                                   Offshore wind has emerged as a key pillar of the European energy
                                                   transition, but costs still need to go down

                                            6   1 Green hydrogen
                                                	Offshore wind farms can provide huge amounts of green hydrogen,
                                                  a key requisite of decarbonization goals

                                           10   2 Deep-water potential
                                                	Floating technology can harness winds along deeper coastal waters,
                                                  and promises even more scope for cheap hydrogen production

                                           13   3 Cutting costs
                                                	Reducing the costs of offshore wind is key to Europe's energy
                                                  independence and competitiveness, and innovation and industrialization
                                                  are the best way to do it

                                           16   4	Innovate and industrialize
                                                	European players must act now to fend off competitors and keep
                                                   the upper hand in the global offshore wind market

                                           18      Conclusion
Cover photo Monty Rakusen/Getty Images

                                                   Globally competitive green hydrogen and reduced offshore wind costs
                                                   go hand in hand – and Europe can seize the day

                                                                                                        Innovate and industrialize | 3
Introduction
OFFSHORE WIND HAS EMERGED AS A KEY PILLAR OF THE EUROPEAN ENERGY
TRANSITION, BUT COSTS STILL NEED TO GO DOWN
B
ack in 2010, the future of offshore wind energy agreed on a 40% cost reduction target: EUR 115/MWh
(OWE) was on a knife's edge. While the technology by 2020.
was considered promising, it was also immature Developments moved faster than expected. In 2016,
and its costs high compared to other forms of renewable the Borssele I and II wind farms, located in the North
energy. Hefty financing costs, driven by the sector's Sea off the Dutch coast, published a strike price of
high-risk status, combined with serious problems in EUR 87/MWh, significantly lower than the 2020 target.
offshore construction and operation, had pushed up Subsequent projects announced even lower strike prices:
the levelized cost of electricity (LCOE) from offshore prices as low as EUR 49/MWh (including grid connection)
wind in Europe to around EUR 190 per megawatt-hour have now been achieved, and zero-subsidy tenders
(MWh). Something needed to be done, so the industry have been successful in the Netherlands and Germany.
A: Target achieved
European offshore wind industry confirmed the LCOE reduction with operational wind farms
[EUR/MWh]
200
190
-40% Industry target
150
115 – Industry LCOE target
100
87 – NL: Borssele I and II 72 – UK: Moray East
78 – DK: Vesterhav 72 – UK: Hornsea 2
68 – NL: Borssele III and IV 58 – FR: Dunkirk
64 – DK: Kriegers Flak
Fully commissioned
50
First electricity ?
Investment decision taken 49-52 – UK: Dogger Bank
Subsidy tendered
Phase A+B, Seagreen,
Sophia Phase 1
0
2008 2009 2010 2011 2012 2013 2014 2015 2016 2017 2018 2019 2020 2021 2022
The industry LCOE target was set by the Crown Estate in 2011: GBP 100/MWh for final investment decision (FID) in 2020. FID is typically 2 years before full operation. To the
strike prices, an estimated average of EUR 14/MWh is added for the grid connection. UK strike prices are published in 2012 prices and have been indexed to the year 2018.
Source: Crown Estate, RVO, press clippings, Roland Berger
4 | FocusSeveral factors played a role in this rapid progress: that these projects were won mainly through aggressive
a maturing supply chain that is more dependable, pricing by project developers, and that the supply chain
experienced and competitive; larger turbines and wind would not be capable of realizing the wind farms at such
farms; and governments offering more reliable forecasts low costs. Such suspicions proved unfounded: the supply
of upcoming capacity additions, issued in competitive chain has delivered. Several wind farms have taken
tenders. A final investment decisions or achieved first electricity,
However, doubts persisted about whether these strike with the Borssele wind farms fully commissioned in
price levels were sustainable. Some observers suspected February 2021. Indeed, OWE along the shallow coasts
B: Lean and green
Renewables are cost-competitive with conventional energy, even more so as CO2 prices increase
[Global; 2020; EUR/MWh]
180 178 176
LCOE increase if
160 CO2 costs go from
EUR 25/ton
141 (= level of 2020) to
140 EUR 100/ton
120 115 114
105
115
100
88 84
80
60 51
58 60
49
40
24 33 34
20 28
15 11
0
Offshore Onshore Solar Coal Natural gas Nuclear
wind wind PV
Renewable energy Conventional energy
= Global price records
Note: Offshore wind includes grid connection costs of EUR 14/MWh
Source: IEA, Roland Berger
Innovate and industrialize | 51 / Green hydrogen
OFFSHORE WIND FARMS CAN
PROVIDE HUGE AMOUNTS OF GREEN
HYDROGEN, A KEY REQUISITE OF
DECARBONIZATION GOALS
T
of the North Sea is now cost-competitive with electricity he last few years have been pivotal for hydrogen.
from fossil sources, and becomes even more so when While its use – either as a direct fuel or in a fuel
the expected rise in carbon price is incorporated into cell – has long been touted as an alternative to
fossil electricity costs. B fossil fuels, it has finally broken through and become
As a result, ambitions for OWE capacity have risen fully accepted as one of the cornerstones of the energy
dramatically. Many governments now see offshore transition.
wind as one of the key pillars of their decarbonization Hydrogen's crucial role in moving to a decarbonized
strategies to keep global warming below 1.5°C, as agreed energy system comes down to three key attributes.
in the UN Paris Agreement of 2015. For example, the UK1 First, hydrogen and its derivatives offer a good option
projects 75 GW of OWE, providing 69% of its electricity to decarbonize highly energy-intensive sectors such as
by 2050, and the European Union wants to develop large-scale transportation and heavy industry (steel,
300 GW of OWE capacity by 2050 and make it a core chemicals, etc.). Second, "green" hydrogen produced from
component of Europe's energy system2. In its recent "Net renewables can be readily stored in pipelines, salt caverns
Zero by 2050" roadmap for the global energy sector, the or depleted gas fields, helping to counteract the effects of
International Energy Agency called for 80 GW of annual renewable intermittency. Third, at higher volumes, energy
capacity deployment by 2030, up from 5 GW in 2020. can be transported at much lower costs by carrying it in
But this surge has seen a rise in low-cost competitors, molecular form (hydrogen through a pipeline) rather than
especially from China, which are threatening Europe's as electrons (electricity through a cable).
position as market leader. Should Europe's players focus It is for these reasons that hydrogen will play a key
on managing their exponential market growth, or should part in achieving the world's post-2030 decarbonization
they also accelerate innovation and industrialization goals, and ultimately our total decarbonization. But huge
efforts to sustain their lead? volumes will be required. This is where OWE comes in.
This report addresses precisely this issue. It puts Offshore wind is the most suitable renewable energy
forward and details three targets for innovation and source in Northwestern Europe for direct coupling of
industrialization in the OWE sector. The first is the large-scale electricity generation to industrial-scale
production, transport and storage of green hydrogen hydrogen production. OWE capacity expansion plans
from OWE electricity. The second is the development of therefore also need to consider potential conversion
floating OWE technologies that can be used along deeper of OWE to the large quantities of hydrogen needed for
coastal waters and further out at sea. And the third is decarbonization goals.
areas of potential cost reductions in the sector. This Green hydrogen is produced via electrolysis, and there
report therefore aims to encapsulate what the European are compelling reasons to locate electrolyzers offshore at
OWE sector must do to innovate and industrialize, as well the OWE source rather than onshore:
as compete with fast-developing rivals such as China, in • Lower cost: At high volumes, offshore hydrogen pipelines
order to maintain its dominance in offshore wind. are cheaper than electricity cables. This differential far
offsets the higher cost of producing hydrogen offshore
instead of onshore. C
1
ource: ORE Catapult, "Realizing the sector deal opportunity", 2019
S
2
Source: EU Commission, "An EU strategy to harness the potential of offshore
• Faster rollout: The technology and supply chain behind
renewable energy for a climate neutral future", Nov. 2020 gas pipelines are less complex than those for electricity
6 | Focuscables, which means that the supply chain can scale up pipeline can transport significantly larger amounts
faster. of energy than an electrical cable, thus requiring less
• Improved reliability: Offshore gas pipelines are more disruption of often delicate ecosystems such as the
robust than electrical cables, which can be exposed by Wadden Sea. What's more, redundant offshore natural
sand waves moving along the seabed and damaged, for gas pipelines can be repurposed to transport hydrogen.
example, by fishing trawlers.
• Access to storage: Offshore-produced hydrogen can be That being said, an onshore hydrogen electrolyzer can
more easily stored in depleted offshore gas fields or salt be connected directly to the electricity grid, enabling
caverns, avoiding public resistance to onshore storage. higher electrolyzer capacity utilization. Whether
• Environmental impact: Offshore gas pipelines have less this becomes economically attractive will depend on
impact on coastal areas than electrical cables. A single legislative developments that facilitate green hydrogen
C: Weighing the costs
At larger scale, offshore hydrogen electrolysis is cheaper than onshore hydrogen
electrolysis INDICATIVE
Saving/kg H2
Converter
Desalination
Compression
OFFSHORE Desalination Electrolysis
differential Compression
cost elements Additional foundation
Offshore electrolysis Pipeline
Pipeline
Export cable losses
Transformer
Transformer Converter
ONSHORE
differential Additional converter
cost elements
Converter
Cable
Export cable
Electrolysis
1 GW 2 GW 3 GW 5 GW 8 GW 10 GW Electrolyzer size
~100 ~200 ~300 ~500 ~800 ~1,000 k mton H2 p.a.
Source: Roland Berger
Innovate and industrialize | 7production with green electricity certificates. The excess transport will go down, putting additional pressure on
heat and oxygen from an onshore electrolyzer can also green hydrogen produced in European waters.
be monetized if local offtake is available. But even at higher costs, hydrogen from European
OWE is still likely to remain attractive. Homegrown
NORTH SEA HYDROGEN WILL HAVE TO hydrogen reduces reliance on imports from other regions,
COMPETE WITH CHEAP HYDROGEN IMPORTS some of which are politically unstable. Producing
It therefore seems to be a natural next step to convert hydrogen at home also allows Europe to capture the
large amounts of electricity from OWE into green downstream value added of hydrogen when it is used
hydrogen at the source. Offshore electrolyzers can be as a feedstock, such as in the production of synthetic
located on platforms, caissons or artificial islands. fuels or green chemicals – value that otherwise moves
They can also be built into turbines. Siemens Gamesa abroad. D
for example, together with Siemens Energy, is working
on integrating an electrolysis system into its flagship
offshore wind turbine.
The first offshore hydrogen demonstration projects
are imminent. Neptune Energy, for example, will soon
install a 1 MW electrolyzer on an existing oil & gas
platform off the Dutch coast, while the UK Dolphyn Homegrown hydrogen
wind-to-hydrogen project plans to deploy a 2 MW
floating prototype system at the Kincardine site off reduces reliance on imports
Aberdeen in 2024. RWE Renewables has initiated the
AquaVentus project, which aims to convert 10 GW of from politically unstable
additional OWE capacity in the German Bight into
green hydrogen by 2035. One of the first AquaVentus regions. Producing hydrogen
sub-projects is dedicated to demonstrating two 14 MW
wind turbines – with integrated electrolysis – off the at home also allows Europe
island of Heligoland.
It is expected that green hydrogen from North Sea to capture the downstream
OWE will cost around EUR 4/kg by 2025. This would
make OWE-produced hydrogen competitive with value added of hydrogen
hydrogen shipped from the Middle East, Chile, and
other regions where renewable electricity is cheap, for when it is used as a
which the cost – including transportation to Europe – is
also around EUR 4/kg. However, it is uncertain whether feedstock, such as in the
North Sea hydrogen will be competitive in the longer
term. As the prime, near-shore OWE locations in Europe production of synthetic
fill up, OWE will have to move further out to sea, driving
up costs in turn. It is also likely that the costs of vessel fuels or green chemicals.
8 | FocusD: The jury is out
By 2025, North Sea hydrogen may be cost-competitive with hydrogen imports from
regions with low-cost renewables [EUR/kg H2] INDICATIVE
EU SAUDI ARABIA
4.2 5.5
2.4 3.2 5.0
3.9 2.9
2.0
2.7
2.4
SPAIN
+ EUR 1.4/kg H2
+ EUR 1.4/
kg H2 + EUR 1.4/
kg H2
+ EUR 1.5/kg H2 + EUR 1.5/kg H2
2.3
1.9 2.8
2.5
CHILE
AUSTRALIA
2.6
2.3
MOROCCO
Indicative technical cost range Vessel transport using Attractiveness of region for green hydrogen
of green H2 for a 250 MW ammonia as carrier, including production, depending on strength of wind
electrolysis plant by 2025 reconversion cost and solar radiation
Offshore wind Onshore wind Solar photovoltaic (PV) Concentrated solar power (CSP)
Source: IEA, Roland Berger
Innovate and industrialize | 92 / Deep-water potential
FLOATING TECHNOLOGY CAN HARNESS WINDS ALONG DEEPER COASTAL WATERS,
AND PROMISES EVEN MORE SCOPE FOR CHEAP HYDROGEN PRODUCTION
I
n Europe, around 80% of the OWE resources are located
in waters of more than 60 meters deep, where seabed-
based OWE is not economical. This represents a huge Floating OWE technology
untapped supply. Floating OWE technology offers a
potential solution, as it allows wind to be harnessed in allows wind to be harnessed
deep waters. This is especially important for some of the
largest potential OWE markets, such as Japan and the West in deep waters. This
Coast of the United States, where deep coastal waters are
unsuitable for seabed-based OWE development. What's represents a huge untapped
more, the technology also allows wind to be harnessed in
shallower waters (at a minimum of 30 meters) where the opportunity, as large OWE
seabed quality makes bottom-fixed OWE economically
unviable3. resources in places like
Today, floating OWE is still an immature technology.
But many large-scale demonstration projects are underway, Europe, the United States
dominated by European players. Oil and gas companies,
such as Equinor, Shell and Total, are particularly active, as and Japan are located
they can also use floating OWE technology to electrify and
thus decarbonize offshore oil and gas platforms located in waters too deep
in remote deep waters. E
for seabed-based OWE.
FLOATING TECHNOLOGY PROMISES MORE
SCOPE FOR HYDROGEN PRODUCTION
Floating technology makes deep waters accessible to It's a conceivable future, where floating technology,
OWE, and, like seabed-based OWE, can be combined green hydrogen and FPSO technology come together
with offshore green hydrogen production. For instance, to produce very low-cost hydrogen in the most optimal
SBM Offshore's floating turbine tension leg design can offshore locations, no matter how remote. The seas off
be anchored at 2,000 meters depth. Electricity generated the southern coast of Greenland, for instance, boast
by floating OWE turbines would be transmitted via cables the strongest and most constant winds on Earth. These
to a floating production, storage and offloading vessel so-called katabatic winds blow out from the large and
(FPSO) located close to the wind farm. The electricity elevated ice sheets of Greenland, generating wind
would then be converted to hydrogen and stored on the energy capture that is 3.5 times higher than in the
FPSO, and regularly offloaded to a tanker and transported North Sea4. F
to a port close to large hydrogen demand centers. The
advantage here is that FPSO technology is already in use
at offshore oil and gas fields in very deep water, and is
3
ource: WindEurope, "Floating offshore wind energy – a policy blueprint for
S
fully mature, one example being Shell's Turritella FPSO Europe", 2020
in a water depth of 2,900 meters in the Gulf of Mexico. 4
Source: Global Wind Atlas
10 | FocusE: Floating ideas
More than a dozen floating offshore wind projects should be commissioned by 2027, with up
to 700 MW capacity
Capacity [MW]
700
DP Energy
(Ireland)
600
Total
Ocean Winds Ocean Winds
Shell (South Korea)
500 EDF Energy
(France)1
Total
Hitz Macquarie
(Japan) (South
400 Korea)2
ExxonMobil Equinor
300 Equinor (South Korea,
(Norway) Spain)
Shell
(South Korea)
200
DP Energy
(UK) Total
RWE (Norway)
(USA)
100 Repsol Cobra
Equinor Ocean Winds (UK) Cobra
(UK) (Portugal) (Spain)
0
2017 2018 2019 2020 2021 2022 2023 2024 2025 2026 2027
Year of commissioning
1 Several developers have planned to commission floating wind farms with capacity ranging from 25-30 MW
2 Total project has planned capacity of 2 GW, of which 500 MW is planned to be commissioned in 2026
Source: Press clippings
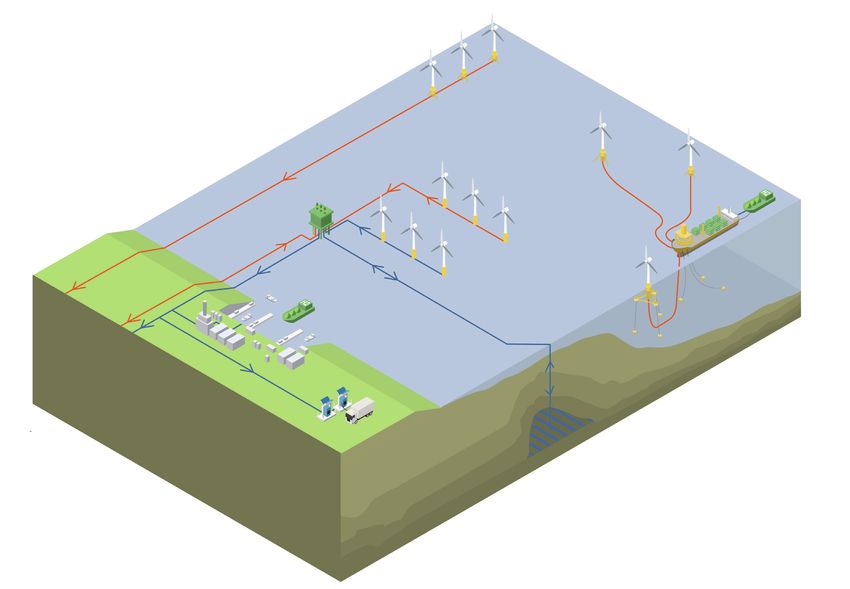
Innovate and industrialize | 11F: Oceans of choice
Hydrogen can be produced offshore either via onshore-linked turbines or at remote floating turbines
linked to an FPSO
Floating turbine foundation design:
courtesy of SBM Offshore
Electrolysis
Hydrogen
Floating tanker
wind farm
Electrolysis
Seabed-based
wind farms
Hydrogen Electrolysis
tanker
Hydrogen
refill station
Industrial FPSO
hydrogen
offtake
Hydrogen
storage
Electrical cable
Hydrogen pipeline
Illustration: DOB-Academy
12 | Focus3 / Cutting costs
REDUCING THE COSTS OF OFFSHORE WIND IS KEY TO EUROPE'S
ENERGY INDEPENDENCE AND COMPETITIVENESS, AND INNOVATION
AND INDUSTRIALIZATION ARE THE BEST WAY TO DO IT
I
t's clear that OWE has the potential to produce a that limit has not yet been reached, and 20 MW models
large share of the hydrogen required to meet are already on OEMs' drawing boards.
decarbonization goals, and that advances in floating
technology will secure access to large swaths of wind INTEGRATED DESIGN
power. But one problem remains: costs. Despite hefty The current design of offshore wind turbines and
cost reductions over the past decade, hydrogen produced their foundations is still an imperfect marriage
from OWE is still relatively expensive. Where OWE is between onshore turbine design and offshore oil and
converted to hydrogen, about two-thirds of the cost per gas foundation and installation technology. Smarter
kilogram of hydrogen is attributable to OWE itself. Cost integrated designs enable more efficient offshore
reductions in OWE are therefore a major stepping stone installation, and thus lead to important cost reductions.
for green hydrogen and the role it promises to play in Slip joints to connect turbines to their foundations are
our world's decarbonization targets. And cheaper OWE is a recent example. Instead of a time-consuming grouted
also key to Europe's energy independence and industrial or bolted connection, the mast of the turbine is simply
competitiveness. slid over a conical connector at the top of the monopile,
Fortunately, there is clear potential to realize the forming a friction-based connection like stacked coffee
next step change in OWE cost competitiveness through cups. Another example is the installation of jackets
industrialization and new technologies. Below we look with suction pile technology instead of piles that are
at some examples. hammered into the seabed, meaning lower costs and
noiseless installation.
INDUSTRIALIZATION
The OWE supply chain can still benefit from higher DIGITAL MAINTENANCE
levels of industrialization, but this requires the further Remote digital structural health and condition
standardization of parts. Once the industry settles on monitoring of OWE installations is essential for
the maximum turbine size, parts can be standardized reducing maintenance costs. This involves generating
throughout the supply chain. Robotizing the assembly of real-time data about system load and damage to predict
jacket foundations rather than manually welding them maintenance and repair needs of turbines, substations
could also greatly increase quality and reduce costs. and electrical cables. There is enormous potential here
However, to enable such robotization, parts need to be in the development of even more advanced sensors and
further standardized, and forecasts of upcoming capacity prognostics algorithms to further reduce the hefty cost
additions need to become more reliable. of maintenance in harsh offshore conditions.
LARGER TURBINES OPTIMIZED WIND FARM CONTROL
Turbine manufacturers continue to develop ever-larger Large-scale aerodynamic interactions within wind farms
turbines. GE, for example, has recently upgraded its and between turbines are still not well understood.
Haliade model to 14 MW, while Siemens and Vestas have Simulations and physical models are necessary to get
both launched a 15 MW model. Industry experts claim a better grip on these interactions in order to optimize
that there is a technical/economic limit to how large control of the entire array of a wind farm and gain higher
offshore wind turbines can ultimately become. However, energy yields.
Innovate and industrialize | 13SELF-HEALING AND HEALABLE MATERIALS floating designs, very deep ports (or fjords) would be
Manufacturing and maintenance practices have not yet needed, which are not always available.
made a full transition from metals to composites. For • Turbines can be towed back to port when large
instance, patching or bolting composite materials is maintenance operations – such as blade replacements
common practice in structural repairs of wind turbine or gearbox changes – are required.
blades. Such practices could be replaced by processable • All OWE turbines are currently designed for seabed-
and healable (dynamic) polymeric matrices for fiber based foundations. As the market for floating OWE
composites and/or coatings and adhesives. By using grows, it will become economically interesting to
self-repair materials and predictive maintenance design turbines specifically for floating foundations
approaches from the start, maintenance and repair and to do this using integrated design approaches to
costs will be drastically reduced over the wind farm's reduce costs. Breakthrough innovations will become
lifetime. G possible if wind and wave loads on turbine, floater and
mooring cables are considered as a single dynamic
THE COSTS OF FLOATING TECHNOLOGY CAN system6.
COME DOWN – A LOT
At today's EUR 180-200/MWh for pre-commercial Innovations in offshore wind often require close
projects, floating technology is expensive. Industry cooperation between several parties in the value
experts predict costs to fall to EUR 80-100/MWh by chain. Integrated design optimizations between
2025 and reach EUR 40-60/MWh by 2030 if volumes and turbine and foundation, for example, require intensive
industrialization go in the right direction5. But there are R&D cooperation between turbine and foundation
inherent reasons why floating OWE may become even manufacturers, as well as transport and installation
more cost-efficient than seabed-based OWE in the longer contractors. Europe has ample experience in executing
term, despite the higher steel requirements that floating such joint R&D, as proven by successful R&D programs
technology will likely entail: like GROW in the Netherlands and ORE Catapult in
the UK.
• Floating foundations can be highly standardized
because they do not have to be designed for different
water depths and soil conditions, expediting
industrialization moves.
• Floating turbines can be assembled and pre-
commissioned in a harbor and towed as an entire unit
to the offshore site by conventional tugs. This means
that assembly can take place in a safer, cheaper and
more controllable environment. However, for certain
5
ource: WindEurope, "Floating offshore wind energy – a policy blueprint
S
for Europe", 2020
6
Source: The Netherlands' Long-Term Offshore Wind R&D Agenda, 2019
14 | FocusG: Ready or not
Options for OWE cost reductions are at different stages of technological readiness,
with industrialization out in front
Optimized wind farm Integrated design Industrialization
control
Technology readiness levels
1 2 3 4 5 6 7 8 9
FUNDAMENTAL SERIES
RESEARCH MANUFACTURING
AND
INSTALLATION
Self-healing and Digital Larger
healable materials maintenance turbines
Source: The Netherlands' Long Term Offshore Wind R&D Agenda, 2019; GROW program; Roland Berger
Innovate and industrialize | 154 / Innovate and industrialize
EUROPEAN PLAYERS MUST ACT NOW TO FEND OFF COMPETITORS AND KEEP
THE UPPER HAND IN THE GLOBAL OFFSHORE WIND MARKET
T
he worldwide rollout of OWE capacity is led
by European companies that developed their
products and services in the competitive About 60% of the CAPEX
commercial environment and harsh weather conditions
of the North Sea. About 60% of the CAPEX value of global value of global OWE farms
OWE farms commissioned or due to be commissioned
between 2020 and 2023 has been captured by European commissioned or due to be
companies. Many of the world's offshore wind farms are
being developed by European project developers such as commissioned between
Ørsted, CIP and wpd. Siemens Gamesa, Vestas and GE
have strong positions in turbine manufacturing, as do 2020 and 2023 has been
SIF, EEW and Steelwind in foundation manufacturing.
In addition, Belgian and Dutch contractors, like captured by European
DEME and Van Oord, operate internationally in the
engineering, procurement and construction (EPC) of companies. But Europe
offshore wind farms, benefiting from their established
global presence in the dredging market. Many other needs to act to defend
European companies also have strong positions in the
value chain. its OWE lead. There are
But despite Europe's dominance, global competitors
are knocking on the door. In particular, Chinese ominous precedents if
companies are becoming more competitive as they
learn from their fast-developing home market. Chinese European players ignore
turbine manufacturer Mingyang, for example, launched
an 11 MW turbine in 2020. The company also established the warning signs.
a business and engineering center in Hamburg, and
recently secured a deal to supply turbines to the 30
MW Taranto offshore wind farm off the coast of Italy,
its first contract in Europe. Mingyang says it wants to
become the "leading global player in offshore wind in
the long term".
Such threats stress the need for Europe to act to
defend its OWE lead and keep the center of gravity on
its shores. There are ominous precedents if European
players ignore the warning signs: today, Chinese
companies hold an almost 70% market share in the
manufacturing of solar PV panels, and around 55% in
the manufacturing of onshore wind turbines7. H 7
Source: IEA, GWEC
16 | FocusH: Tight race
European countries are now vying with China for market share in the global seabed-based
wind farm sector [2020-2023] INDICATIVE
Project MANUFACTURING TRANSPORT & INSTALLATION
Offshore wind developer/
value chain owner Turbine Foundation Cable Turbine Foundation Cable
Country
Van Oord Van Oord
[# of firms] Van Oord
Seaway 7 Seaway 7
Netherlands SIF
[8]
Heerema Boskalis
DEME
Belgium Jan de
Smulders DEME DEME
[5] Nul
Germany Siemens
EEW NKT NKT
[4] Gamesa
Denmark
Ørsted Vestas Cadeler
[3]
France EDF GE Nexans
[3]
Italy
Prysmian Prysmian
[2]
UK
SSE JDR
[2]
Other Europe
Vattenfall Hellenic Fred. Olsen
[3]
Three Gorges Mingyang CCCC ZTT CCCC
China Shanghai CCCC ZTT
CGN ZPMC Nantong
[25] EPPG Ningbo Railway Ningbo
SPIC Jiangsu CRCC
Goldwind LZME FCME
Huaneng Envision Hengtong Nantong Jiangsu
CRCC
= 5% market share CSIC LZME
Top 8 per value chain step, measured in installed capacity [MW, (planned to be) operational in 2020-2023]. Companies are allocated to countries based on the footprint
of their operations; Lamprell from the United Arab Emirates, the fourth largest player in foundation manufacturing, is excluded as it is not European or Chinese
Source: WindEurope, 4COffshore, Roland Berger
Innovate and industrialize | 17Conclusion
GLOBALLY COMPETITIVE GREEN HYDROGEN AND REDUCED OFFSHORE WIND
COSTS GO HAND IN HAND – AND EUROPE CAN SEIZE THE DAY
I
t is clear that European companies, together with the In the coming years, billions of euros will have to be
knowledge infrastructure, must rapidly innovate and invested in innovation and industrialization to bring OWE
industrialize to expand the scope of offshore wind and to the next level and further reduce its costs. The supply
reduce its costs so that they can cement their place as chain can only make such investments if governments
global leaders. But such advances serve another, more and project developers ensure an environment where
important purpose. Green hydrogen costs are largely healthy returns on OWE capacity rollout are possible.
dictated by OWE costs, and therefore can be reduced This also entails governments facilitating reliable
only if OWE costs fall. This makes lower-cost OWE a projections of upcoming capacity additions. Combined
key requisite for globally competitive hydrogen – and in with the threefold approach proposed here, European
turn a requisite for Europe's energy independence. Not OWE can fortify its position as the world's offshore wind
to mention the fact that competitive green hydrogen leader, building a future above and beyond carbon for
costs will create more domestic value in downstream its own economies and citizens, and for the planet as a
products and enhance the international competitiveness whole. I
of Europe's energy-intensive industries.
I: Key targets
European offshore wind energy players should focus on three key innovation and industrialization
areas until 2030
DEVELOP OFFSHORE DEVELOP FLOATING OWE REDUCE OWE COST
HYDROGEN TECHNOLOGY FURTHER
Source: Roland Berger
18 | FocusCREDITS AND COPYRIGHT
AUTHORS CONTRIBUTORS
MAARTEN DE VRIES MANFRED HADER
Senior Associate Senior Partner
+31 6 54 22 84 01 +49 160 744 43 27
maarten.devries@rolandberger.com manfred.hader@rolandberger.com
BRAM ALBERS TORSTEN HENZELMANN
Principal Senior Partner
+31 6 23 63 73 56 +49 160 744 81 85
bram.albers@rolandberger.com torsten.henzelmann@rolandberger.com
SEBASTIAN GOOSSENS YVONNE RUF
Project Manager Partner
+32 476 44 63 72 +49 160 744 63 34
sebastian.goossens@rolandberger.com yvonne.ruf@rolandberger.com
BENNO VAN DONGEN FRANCOIS CASTELEIN
Senior Partner Partner
+31 6 20 61 69 64 +32 478 97 97 20
benno.vandongen@rolandberger.com francois.castelein@rolandberger.com
URS NEUMAIR
Partner
+49 160 744 80 38
urs.neumair@rolandberger.com
UWE WEICHENHAIN
Partner
We welcome your questions, +49 160 744 42 28
comments and suggestions uwe.weichenhain@rolandberger.com
WWW.ROLANDBERGER.COM
06.2021
This publication has been prepared for general guidance only. The reader should not act according to any information provided in this publication without receiving
specific professional advice. Roland Berger GmbH shall not be liable for any damages resulting from any use of the information contained in the publication.
© 2021 ROLAND BERGER GMBH. ALL RIGHTS RESERVED.ROLAND BERGER is the only management consultancy of
European heritage with a strong international footprint. As an
independent firm, solely owned by our Partners, we operate
50 offices in all major markets. Our 2400 employees offer a
unique combination of an analytical approach and an empathic
attitude. Driven by our values of entrepreneurship, excellence
and empathy, we at Roland Berger are convinced that the
world needs a new sustainable paradigm that takes the entire
value cycle into account and enables us to meet the profound
challenges of today and tomorrow.
PUBLISHER:
ROLAND BERGER GMBH
Sederanger 1
RB_PUB_21_011
80538 Munich
Germany
+49 89 9230-0You can also read