Neutron activation of gadolinium for ion therapy: a Monte carlo study of charged particle beams - Nature
←
→
Page content transcription
If your browser does not render page correctly, please read the page content below
www.nature.com/scientificreports
OPEN Neutron activation of gadolinium
for ion therapy: a Monte Carlo
study of charged particle beams
Kurt W. Van Delinder1*, Rao Khan2 & James L. Gräfe1
This study investigates the photon production from thermal neutron capture in a gadolinium (Gd)
infused tumor as a result of secondary neutrons from particle therapy. Gadolinium contrast agents
used in MRI are distributed within the tumor volume and can act as neutron capture agents. As a result
of particle therapy, secondary neutrons are produced and absorbed by Gd in the tumor providing
potential enhanced localized dose in addition to a signature photon spectrum that can be used to
produce an image of the Gd enriched tumor. To investigate this imaging application, Monte Carlo (MC)
simulations were performed for 10 different particles using a 5–10 cm spread out-Bragg peak (SOBP)
centered on an 8 cm3, 3 mg/g Gd infused tumor. For a proton beam, 1.9 × 10⁶ neutron captures per RBE
weighted Gray Equivalent dose (GyE) occurred within the Gd tumor region. Antiprotons (P̄ ), negative
pions (− π), and helium (He) ion beams resulted in 10, 17 and 1.3 times larger Gd neutron captures per
GyE than protons, respectively. Therefore, the characteristic photon based spectroscopic imaging and
secondary Gd dose enhancement could be viable and likely beneficial for these three particles.
The objective of depositing a therapeutic radiation dose to the tumor while minimizing damage to nearby healthy
structures requires imaging modalities for accurate target localization during radiation treatment. Modern exter-
nal beam radiation therapy uses collimated high energy photon beams in the form of either intensity modulated
radiation therapy (IMRT) or volumetric modulated arc therapy (VMAT)1 to deliver radiation doses. Contrary
to megavoltage photon beams, ion beams can provide an even higher dose to the tumor region while further
reducing dose to healthy tissues beyond the tumor. Based on this premise, there has been an exponential increase
in demand for systems employing the use of protons within clinical care in the last two decades. Heavy particles
have a higher relative biological effectiveness (RBE) than protons, which may provide a better therapeutic ratio
and therefore a clinical advantage. Globally, 12 centers are currently using carbon ion beams and many facili-
ties are investing large amounts of funding to investigate the use of other particles for therapeutic purposes2,3.
In particle therapy, high energy particles interact with beam shaping components located within the treat-
ment units, producing secondary neutrons through nuclear interactions. The initial neutron energies depend on
the initial particle energies, density and composition of the interacting medium. The amount of materials in the
path of the particle beam depends on the design of the treatment unit and the delivery method used. Passively
scattered techniques may require several beam shaping components to be added, which may include a scatterer,
modulator, collimator and range modulator. Magnetically scanned techniques use magnets to shape the pencil
beams and therefore do not require added materials in-front of the beam path4. As a result, techniques that use
magnets for beam placement, produce a smaller distribution of secondary neutrons. Secondary neutrons may
also be produced from the interaction of the charged particle beam and the tissue of the patient that is irradi-
ated. The two main nuclear processes responsible for the production of neutrons are: intranuclear cascade and
nuclear evaporation5. When a high energy charged particle (> 50 MeV) with an impact parameter less than the
atomic radius interacts with the target nucleus, neutrons in addition to other particles and light fragments can be
driven out with high energy in the forward direction. This process is referred to as the intranuclear cascade. As
a result of the missing nucleons, the excited nucleus decays from its excited state by the emission of low energy
nucleons (neutrons) isotropically. As the neutrons traverse within the tissue of the patient, the two main types
of interactions are neutron scattering and neutron absorption. The inelastic scattering process occurs when a
high energy neutron (> 1 MeV) interacts with a target nucleus resulting in a change of system energy. Inelastic
1
Department of Physics, Faculty of Science, Ryerson University, 350 Victoria St., Toronto, ON M5B 2K3,
Canada. 2Medical Physics Division, Department of Radiation Oncology, Washington University School of Medicine,
660 S Euclid Ave, St Louis, MO 63110, USA. *email: kvandelinder@ryerson.ca
Scientific Reports | (2020) 10:13417 | https://doi.org/10.1038/s41598-020-70429-9 1
Vol.:(0123456789)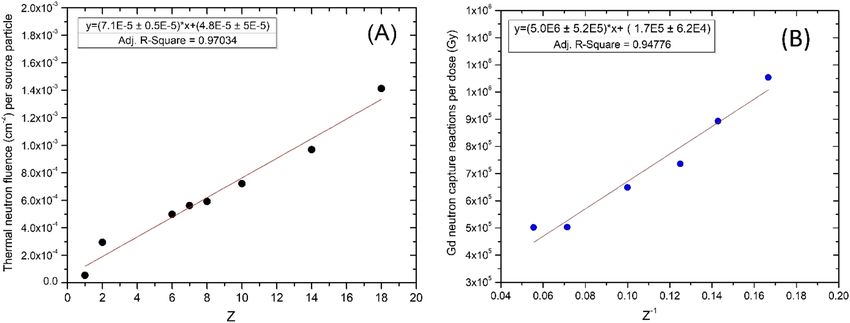
www.nature.com/scientificreports/
Thermal neutron capture Photon emission energy Photon emission
Isotope Percent abundance (%) cross section (b) (keV) probabilities (%)
157 Gd 15.65 254,000 ± 800a γ-ray 181.9 18.33 ± 1.69b
γ-ray 79.5 9.75 ± 0.69b
Kα 43 18.2 ± 1.0c
Kβ 49 4.5 ± 0.3c
a
155 Gd 14.80 60,900 ± 500 Kα 43 29.1 ± 3.8c
Kβ 49 7.1 ± 0.9c
Table 1. Gd isotopic abundance, neutron capture cross sections and photon emission probabilities per
neutron capture, for the photon emissions of interest in this study. a From IAEA26. b From Kibédi27. c From Gräfe
et al.28.
scattering results in an excited target nucleus which will destabilize by emitting gamma-rays. Elastic scattering
is the primary mechanism responsible for higher energy neutrons to thermalize down to very low energies. The
neutron absorption process occurs when a neutron is absorbed by a target nucleus. The nucleus will excite to a
higher energy state and the de-excitation process may occur by several different m echanisms5.
Since the radiation quality factor of neutrons can reach as high as 2 06, an increased healthy tissue damage
from this scattered neutron distribution becomes more significant. Recently, a procedure has been proposed
to inject a therapeutically beneficial neutron-capturing agent into the tumor. While the agent captures thermal
neutrons, it may result in the production of photons for imaging and could enhance the local dose to the tumor,
therefore, turning a negative byproduct into a positive therapeutic b enefit7,8. The concept of imaging the unique
signature photon spectrum produced from a material as a result of neutron activation is referred to as ‘neutron
activated imaging’. The specific application of measuring the gadolinium neutron capture (GdNC) spectrum
produced from proton therapy was previously termed Proton Neutron Gamma-X Detection (PNGXD)8. In
principle, this approach can be extended to include all heavy charged particles, therefore, a more general term,
Particle Neutron Gamma-X Detection PNGXD is being proposed here.
The prospective applications of PNGXD includes the production of a dynamic tumor image to be fused with
an anatomic image modality such as CT or MRI and used as a method to track tumor position. The localization
of the tumor volume could also be used as a method to determine treatment response and allow the incorporation
of additional treatment customizations such as, adaptive planning techniques9. In order to produce a PNGXD
nuclear medicine image, the addition of a spectroscopic detection system would be included with treatment
delivery. The main GdNC spectral signature ranges in energy from 43 to 181.9 keV and is therefore ideal for
most spectroscopic detection systems. The application of novel dynamic-SPECT (D-SPECT) systems may allow
a smaller treatment room presence with little reduction in imaging quality, however, further experimental inves-
tigation is needed. Experimental measurements performed on a 5 × 5 mm2 cadmium telluride (CdTe) detector
have documented signal-to-noise ratios as high as 159. As proton range verification techniques such as positron
emission tomography (PET) or prompt γ-ray emission also require the incorporation of a detection system, it
may be possible to perform a PNGXD imaging procedure in-synchrony to a range verification t echnique10,11.
In this application, gadolinium would be injected into the patient prior to treatment. Gadolinium is comprised
of seven naturally abundant isotopes, which have a total thermal neutron cross section of 48,800 barns (b). 157Gd
(15.7% abundance) and 155Gd (14.8% abundance) have thermal neutron capture cross sections of 254,000 b and
60,900 b, respectively12. As a result of 157Gd neutron capture reaction, 7.94 MeV (Q-value) of energy is released
with 99% of the Q-value energy given to prompt gamma-ray radiation12. The main spectral photon signature
from this capture reaction produces γ-rays of 79.5 and 181.9 keV and characteristic X-rays of 43 keV ( Kα) and
49 keV (Kβ). Neutron capture with 155Gd also contributes to the characteristic X-ray production. The neutron
capture cross sections and main spectral photon emission probabilities of interest to this study are listed within
Table 1. The absorption of a neutron with a 157Gd nucleus produces internal conversion (IC) electrons with a
total yield of 0.69 and average energy of 66.5 keV13. The discrete spectrum of IC electrons range in energy from
29 to 246 keV, with the most intense discrete emission occurring at 71 keV14.
The relaxation of 158Gd* compound nucleus also yields 5 Auger electrons with an average of 0.85 keV energy
per capture and 0.84 X-rays with an average energy of 12.77 keV per c apture13,15,16. The IC and Auger electrons
contribute to a high linear energy transfer (LET) dose that is deposited locally within tissue. In addition to
X-rays, as a result of the nuclear de-excitation, a high energy spectrum of γ-rays are emitted with a yield of 1.83
per neutron capture and an average energy of 1,330 keV13.
Several studies have demonstrated Gd as a dose enhancing neutron capture agent. The tumor uptake of Gd
and relative biological effectiveness (RBE) of the neutron capture produced Auger and internal conversion elec-
trons have been previously investigated. Cellular Gd uptake concentrations as high as 3,000 parts-per-million
(PPM) without reaching any signs of cytotoxicity have been d eveloped17,18. Cancer cells commonly possess
an elevated mitochondrial membrane potential as compared to healthy cells, and therefore the synthesis of
GdIII-triarylphosphonium salts have been developed. Within a feasibilitiy study, the novel GdIII complexes were
found to be tumor cell selective, mitochondrially-targeting and had a very high tumour-cell uptake17,18.
The most promising Gd compound that has been clinically studied, is the macrocyclic texaphyrin derivative
known as Motexafin-Gd (MGd) which is currently undergoing a Phase III clinical trial. This is a strong candidate
for GdNC for the application of whole brain radiation t herapy19. Gd has a prolonged tumor retention of up to
Scientific Reports | (2020) 10:13417 | https://doi.org/10.1038/s41598-020-70429-9 2
Vol:.(1234567890)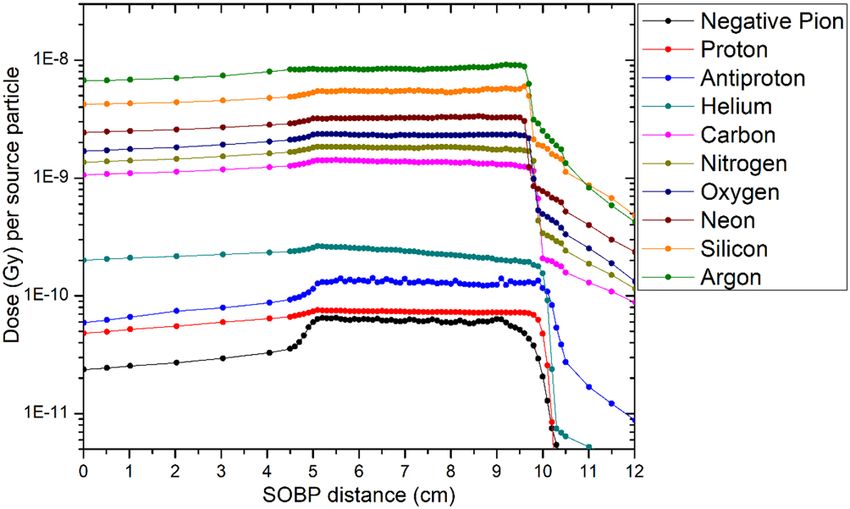
www.nature.com/scientificreports/
2 months, however, the absorbed concentration was found to peak within a 6 to 12 h w indow20. Gd possesses
a 70:1 (varying from 37 and 133) tumor-to-healthy tissue uptake ratio with a 90% uptake in glioblastoma cell
nuclei19–21. The RBE of the neutron capture produced electrons have been found to vary from one study to
another. An RBE of 12.6, 6 and 1.5 were quantified using a Monte Carlo (MC) toolkit along the inside, surface and
outside of a 3 nm radius cylinder mimicking a DNA m olecule22. By method of quantifying radiation weighting
factors and relative biological effectiveness, RBE values of 5 and 20 were recommended for spherical cells and
DNA, respectively23. An RBE of 10 was recommended by Humm et al. from a calculated review of Auger electron
dosimetry for an emitter bound to the DNA of a n ucleus24. These studies quantifying the RBE values, could take
advantage of the recent advances made in MC simulation of biological nanostructures and m icrostructures25.
In a previous experimental study, the main photon spectrum for Gd was characterized for a passive scattering
proton therapy beam9. In another study, gadolinium dose enhancement resulting from protons and carbon ion
therapy was investigated via a MC simulation7. Since a greater number of neutrons are produced per particle
from heavier ions, the quantification of both GdNC photon production and enhanced dose scaled per Gy is of
great interest for particles with a larger charge and mass than protons. In addition, there are several other unique
particles that have been explored for use in radiation therapy that may be of strong interest for the application
of gadolinium neutron
− capture therapy.
Antiprotons ( P ) and negative pions (− π), exhibit unique interaction mechanisms that can result in an
increased tumor dose however at the expense of large secondary neutron production. Antiprotons are similar
to protons in terms of physical beam characteristics such as energy-range, stopping power ratios and RBE29
along the entrance plateau region. However, within the Bragg peak, antiprotons undergo antiproton-nucleon
annihilation releasing approximately 2 GeV of energy. This annihilation leads to a doubling of physical dose in
addition to an increased biological d ose29. Negative pions have a mass of approximately 1/7th that of a proton,
but still exhibit characteristics similar to other charged particles including the capability to produce a spread-out
Bragg Peak (SOBP).
When a negative pion slows down within tissue, it may be captured by any of its elemental constituents pro-
ducing a star formation of heavily ionizing fragments capable of depositing a large localized radiation dose30.
When a negative pion slows down and is specifically captured by hydrogen, a unique feature occurs in which the
particle is placed within the electronic orbit, similar to an electron. When this atom comes close to a heavier atom,
the pion is transferred to the heavier element due to a lower binding energy. The pion becomes absorbed within
the nucleus of the heavy element releasing a total of 140 MeV of kinetic energy, a phenomenon known as a “star
formation” due to its star-like appearance in emulsion and cloud chambers30,31. Of this kinetic energy, ~ 70 MeV
is carried by neutrons, 30 MeV by other charged particles such as protons, alpha particles and heavy particles
and remaining 40 MeV to overcome the nuclear binding e nergy30,31.
To further study the role of GdNC and spectroscopic imaging, MC simulations were performed to determine
which particle therapy would benefit the most from dose enhancement and tumor localization. To investigate
the secondary thermal neutron production, MC simulations were developed to estimate the number of neutron
capture reactions with Gd for a wide variety of charged particles including protons, helium, carbon, nitrogen,
oxygen, neon, silicon, argon, antiprotons and negative pions. Within this study, all selected charged particles have
been considered or proposed for clinical use in radiation therapy of cancers. We simulated two different SOBP
depths and ranges for various particles on a soft tissue box containing a gadolinium contrast agent (GDCA)
infused tumor located in the center of each SOBP peak. Since the physics used to produce secondary thermal
neutron production is often susceptible to misrepresentations in particle transportation, a secondary objective
was included to incorporate Geant4 as an independent verification of the results produced from MCNP6. The
results from this study compare the amount of Gd neutron captures produced per absolute and RBE weighted
dose for 10 different particles. Therefore, we can identify which particle would clinically benefit the most from
Gd spectroscopic imaging and dose enhancement.
Materials and methods
MCNP particle simulations. We used two of the most widely used and well-benchmarked MC codes for
heavy charged particle transport in this study: Monte Carlo N-Particle 6 (MCNP Version 6.1.1, by LANL) a
general purpose radiation transport code and a second validation using GEometry ANd Tracking (Geant4 Vr.
10.02.p02) MC toolkit32.
We investigated two different SOBP configurations. In the first, we used a 5–10 cm SOBP with 5 × 5 cm2 field
size (FS) incident on a 30 × 30 × 30 cm3 box of ICRU Soft Tissue having four components (H 10.1%, C 11.1%, N
2.6%, O 76.2% and a tissue density of 1.00 g/cm3) for all incident particles. Located in the center of the SOBP, an
8 cm3 volume of 3 mg/g (3,000 parts per million (ppm)) Gd solution was created and placed along the 6.5–8.5 cm
depth of the soft tissue box to represent a Gd infused tumor.
To investigate the effect of GdNC with the increase of treatment depth, a second configuration with 10–15 cm
SOBP, 5 × 5 cm2 FS, was employed for three particles (proton, helium, carbon). We investigated these three
particles as they are the most clinically relevant particles, in addition, these particles can be compared to the
simulation work published by Safavi-Naeini et al.
Using MCNP for these configurations, total dose, total neutron spectrum, thermal neutron production and
the total Gd capture reaction rate were scored within the tumor. Secondary particle transport such as protons,
neutrons, electrons, photons, heavy ions, alpha particles, tritons, helium ions and deuterons were considered
in the simulation, except for antiprotons where both negative and positive muons, pions and kaons were also
included.
Within MCNP, the dose was scored in two separate ways: using the + F6 energy deposition tally with all
particle transport on except for photons, and using the F8* energy deposition tally measuring only the photon
Scientific Reports | (2020) 10:13417 | https://doi.org/10.1038/s41598-020-70429-9 3
Vol.:(0123456789)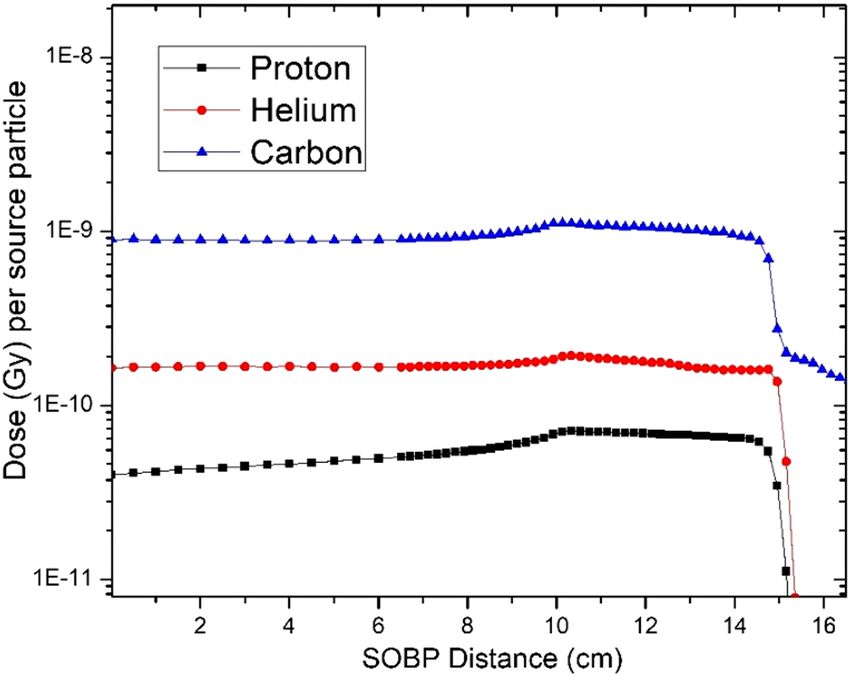
www.nature.com/scientificreports/
Particle (5 to 10 cm SOBP) Particle (10 to 15 cm SOBP)
Particle Min E (MeV/u) Max E (MeV/u) Min E (MeV/u) Max E (MeV/u)
Proton 80 117 117 147
Helium 80 117 117 147
Carbon 147 216 217 276
Nitrogen 160 236 – –
Oxygen 173 255 – –
Neon 196 289 – –
Silicon 237 350 – –
Argon 249 399 – –
Antiproton 80 117 – –
Negative Pion 34 52 – –
Table 2. Energy ranges of incident particle beams to produce a SOBP in each case.
dose component. This is a requirement in order to obtain accurate results for photon dose as the F6 measure-
ment tally assumes energy is deposited locally, which is not the case for secondary electrons released for photon
interactions. For MCNP, the total neutron spectrum and thermal neutral fluence were determined using the F4
cell flux tally for neutrons. To determine the Gd neutron capture reaction rate, the FM tally multiplier was used.
The total dose, thermal neutron fluence and Gd neutron capture rate were determined to within a statistical
uncertainty of < 1% and the total neutron fluence to within 5%. The neutron spectrum for antiprotons, negative
pions, protons, and helium ions, was scored in logarithmic bins ranging in neutron energy from 1 × 10⁻⁸ up to a
maximum of 600 MeV. For heavier ions such as, carbon, nitrogen, neon, oxygen, silicon and argon, logarithmic
bins were extended to 1.6 × 10⁴ MeV.
The physics used to produce secondary thermal neutron production from 10 different particles are complex
and susceptible to particle transportation misrepresentations from selected models. To mitigate erroneous results,
an additional MC toolkit, Geant4, was incorporated into this study to provide an independent check of the results
from MCNP6. Geant4 simulation outputs were determined using the G4ScoringManager (UI) interface over
the tumor volume for the thermal neutron fluence and total dose deposited. To determine the uncertainty value
of each output for Geant4, five sets of simulations were performed by varying the random number seed. The
standard deviation of the mean of each output was quantified and found to be (< 5%). All secondary particles
were transported throughout the Geant4 simulations.
Spread‑out Bragg peak simulations. To approximate the SOBP produced from an active scanning
beam, an analytical formalism was used to produce a proton SOBP from Jette et al.33. The formalism calculates
the beam energies with respective weights for the depth and range of a proton beam SOBP. To determine the
beam energy weights to build the SOBP of another particle, a relationship linking the heavy charged particle
(HCP) continuous slowing down approximation range ( RCSDAMi ) to that of a proton ( Rp
CSDA) can be established
34
as below :
2
Mi Z Mi p mp
RCSDA (KEi ) = RCSDA × (KE i ) (1)
zi2 mp Mi
where Z is the proton atomic number, zi is the HCP atomic number, (KE i ) and (KE p ) are the initial kinetic ener-
gies for the HCP and proton, Mi and mp are the mass of the HCP and proton, respectively.
To simulate the SOBP using MCNP, a 5 × 5 cm2 planar source was made incident on a 30 × 30 × 30 cm3 ICRU
soft tissue box. For the 5–10 cm SOBP, voxels were created using 0.25 cm increments along the plateau and 0.1 cm
increments along the Bragg peak beam direction and 2 × 2 cm2 in the direction perpendicular to the ion beam. For
the 10–15 cm SOBP, voxels of 0.5 cm increments were created within the plateau and 0.2 cm increments along the
Bragg peak in the beam direction. The simulation was continued until the dose calculation uncertainty of < 1%
was achieved inside the voxels. Within Geant4, the SOBP dose was scored in voxels (0.1 × 2 × 2 cm3) of 0.1 cm
resolution along the beam path. The dose distributions for each setup and particle were qualitatively compared
and found to follow a similar depth dose distribution between the two MC codes. Table 2 displays the maximum
and minimum particle energies in MeV per nucleon (MeV/u) used to produce each SOBP.
MCNP6 particle physics models. The MCNP6 continuous-energy neutron data libraries with the most recent
ENDF material card were selected. For the simulations using a proton source, the LA150 NJOY proton data
libraries were used when available, otherwise the default Cascade-Exciton Model (CEM) was used. For the par-
ticle simulations other than protons, the Los Alamos Quark Gluon String Model (LAQGSM) was employed to
simulate the nuclear collisions produced from heavy charged particles. The LAQGSM model describes the stages
of nuclear interactions and is valid over a high energy range up to 1 TeV35.
Scientific Reports | (2020) 10:13417 | https://doi.org/10.1038/s41598-020-70429-9 4
Vol:.(1234567890)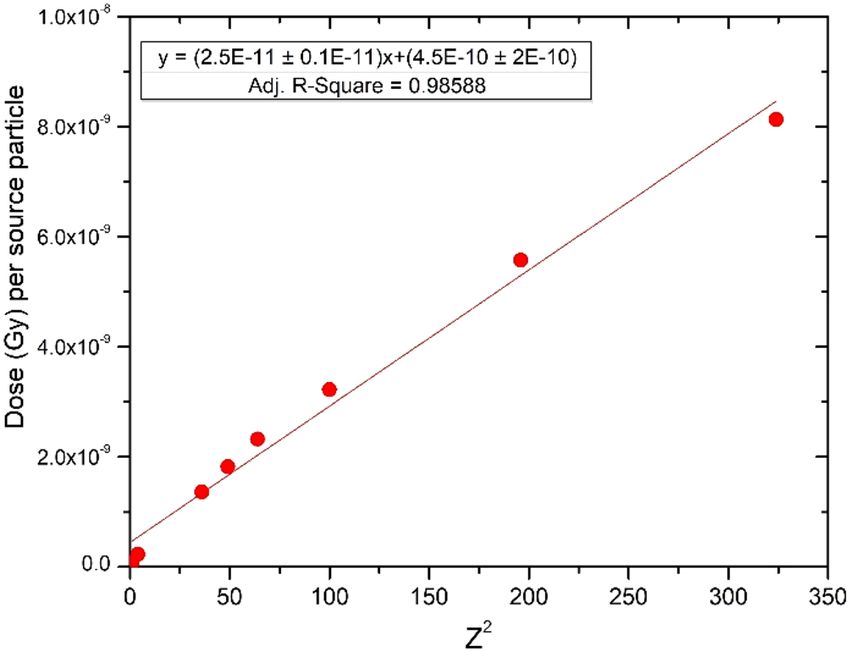
www.nature.com/scientificreports/
Interaction Energy range Geant4 model
Electromagnetic interaction 0–10 GeV G4EmStandardPhysics_option3
Radioactive decay N/A G4RadioactiveDecayPhysics
Particle decay N/A G4Decay
Hadron elastic 0–100 TeV G4HadronElasticPhysicsHP
Ion inelastic 0–110 MeV Binary Light Ion Cascade
100 MeV–10 GeV QMDModel
Neutron capture 0–20 MeV NeutronHPCapture
19.9 MeV–100 TeV nRadCapture
Neutron inelastic 0–20 MeV NeutronHPInelastic
19.9 MeV–9.9 GeV Binary Cascade
Neutron elastic 0–4 eV NeutronHPThermalScattering
4 eV–20 MeV NeutronHPElastic
20 MeV–100 TeV hElasticCHIPS
Proton inelastic 0–9.9 GeV Binary Cascade
Table 3. Geant4 physics models for all particle simulations.
Figure 1. Simulated SOBP dose distributions for 5–10 cm SOBP using MCNP6.
Geant4 particle physics models. For the Geant4 simulations, the full list of selected physics models are provided
in Table 3. The primary hadronic physics list selected is QGSP_BIC_HP. QGSP uses the quark gluon string
model (QGSP) for high energy interactions of protons, neutrons, pions, kaons and various nuclei. The high-
energy interaction creates an excited nucleus, which is passed on to the pre-compound model, which models
nuclear de-excitation. QGSP_BIC uses the G4 Binary cascade for primary protons and neutrons with energies
below ~ 10 GeV. Binary cascade has been validated to describe the production of secondary particles produced
in interactions of protons and neutrons with nuclei. QGSP_BIC also uses the binary light ion cascade to model
atter36.
the inelastic interactions of ions up to a few GeV/nucleon with m
The list QGSP_BIC_HP has the addition of the high precision neutron package (NeutronHP) to transport
neutrons below 20 MeV down to thermal e nergies37. The recommendation to use the high precision neutron
packages for each neutron interaction process was followed as these lists originate from evaluated nuclear data
files (ENDF), which have been extensively validated. Similar to MCNP, the thermal energy neutron elastic scat-
tering files S(α,β), from ENDF/B-VII, were used for the thermal neutron scattering of H in the ICRU soft tissue
phantom.
Results
Particle depth dose distributions. The 5–10 cm SOBP distributions for all 10 investigated particles are
shown in Fig. 1. The dose distributions were produced within MCNP6 and measured as a function of dose in
Gy per source particle. It is evident from the figure that fragmentation contributes to dose beyond the SOBP for
all heavy ions from carbon onward as previously r eported37. Also, the expected dose h alo38 from antiprotons is
evident from the long tail of the SOBP.
Argon (Ar) produced the largest amount of dose per source particle due the large atomic number (Z = 18).
This is expected based on the Z 2 dependence of the Bethe stopping power equation. The dose per source particle
is found to increase linearly with Z 2 for all ions except antiprotons and negative pions. A plot displaying dose as
2
a function of Z
is shown in Fig. 2. Antiprotons and negative pions were excluded from the plot as these particles
produce more complex dose distributions due to the uniqueness of their interactions.
Scientific Reports | (2020) 10:13417 | https://doi.org/10.1038/s41598-020-70429-9 5
Vol.:(0123456789)www.nature.com/scientificreports/
Figure 2. Dose per source particle versus atomic number squared ( Z2). The relationship is linear as expected
based on the Z2 dependence of the Bethe stopping power equation. A statistically significant slope was
determined (p < 0.001).
Particle (5 to 10 cm SOBP) Argon Silicon Neon Oxygen Nitrogen
Peak-to-plateau dose 1.25 1.33 1.33 1.35 1.29
Particle (5 to 10 cm SOBP) Carbon Helium Proton Antiproton Negative Pion
Peak-to-plateau dose 1.27 1.15 1.52 2.20 2.58
Particle (10 to 15 cm SOBP) Carbon Helium Proton – –
Peak-to-plateau dose 1.16 1.08 1.71 – –
Table 4. Peak-to-plateau dose for each particle and geometry.
The smallest dose per source particle was produced from the lightest ion investigated, negative pions (− π),
which is slightly less than protons over the Bragg peak region. The peak-to-plateau dose (Gy) for each particle
can be seen within Table 4. Antiprotons produced a much larger dose over the Bragg peak compared to protons.
At the center of the SOBP (7.5 cm depth), the physical dose from antiprotons is 1.8 times higher than protons. A
study validating experimental antiproton measurements with MC toolkits (FLUKA, SHIELD-HIT) conducted
by Bassler et al. found that antiprotons have roughly 2 times higher physical dose than protons39. Our results
are in agreement with the reported findings. Studies have also been conducted comparing the antiproton dose
characteristics between FLUKA and MCNP and have shown close a greement40. The SOBP distributions from
10 to 15 cm for protons, helium ions, and carbon ions are shown in Fig. 3.
Neutron production. The thermal neutron fluence, total neutron fluence, total amount of Gd neutron
captures and the Gd neutron capture rate normalized to protons are shown in Table 5. For simplicity, all values
have been normalized to the absolute dose in Gy.
For the 5–10 cm SOBP, antiprotons and negative pions were associated with the largest neutron production
and largest number of Gd neutron captures. The third largest was helium particles. For the 10–15 cm SOBP,
helium particles produced the largest number of Gd neutron captures. Table 6 shows Gd neutron capture results
normalized to RBE weighted dose in Gray Equivalent (GyE). It is widely known that the RBE in charged particle
therapy is one of the greatest sources of uncertainty41 and can vary based on many factors including location
within the Bragg peak42. However, we chose representative values from the literature for these comparisons. The
last column in Table 6 consists of the ratio of neutron capture per GyE normalized to protons.
The thermal neutron fluence was found to scale linearly with the atomic number for all particles except
antiprotons, and negative pions. This is shown in Fig. 4A. Since the dose is proportional to Z 2, and the thermal
neutron fluence is proportional to Z, the ratio of thermal neutron captures to dose was found to be proportional
to 1/Z for heavy charged particles as shown by the linear relationship in Fig. 4B. Protons, helium ions, antiprotons
and negative pions were excluded from Fig. 4B due to their lower Z number. The r 2 values from both fits in Fig. 4
demonstrate strong linear correlations with a positive slope (p < 0.001).
The comparison of thermal neutron fluence per absorbed dose (Gy) between both MC codes, MCNP and
Geant4, is provided in Table 7. All simulations were found to be within one order of magnitude. The agreement
is reasonable regardless of the subtleties of the physics models and computational implementation between the
two systems. The highest thermal neutron production originating from both antiprotons and negative pions is
Scientific Reports | (2020) 10:13417 | https://doi.org/10.1038/s41598-020-70429-9 6
Vol:.(1234567890)www.nature.com/scientificreports/
Figure 3. Simulated dose distributions for 10–15 cm spread-out Bragg peaks from MCNP6 for protons, helium
and carbon ions.
Thermal neutron fluence (cm-2/ Gd neutron capture reactions Normalized Gd neutron capture
Particle 5 to 10 cm (SOBP) Gy) Total neutron fluence (cm-2 /Gy) (captures/Gy) reactions (captures/Gy)
Argon 1.7 × 10⁵ 1.2 × 10⁷ 5.0 × 10⁵ 0.24
Silicon 1.7 × 10⁵ 9.5 × 10⁶ 5.0 × 10⁵ 0.24
Neon 2.2 × 10⁵ 1.1 × 10⁷ 6.5 × 10⁵ 0.30
Oxygen 2.6 × 10⁵ 1.2 × 10⁷ 7.4 × 10⁵ 0.34
Nitrogen 3.1 × 10⁵ 1.4 × 10⁷ 8.9 × 10⁵ 0.42
Carbon 3.7 × 10⁵ 1.5 × 10⁷ 1.1 × 10⁶ 0.49
Helium 1.3 × 10⁶ 3.3 × 10⁷ 3.7 × 10⁶ 1.7
Proton 7.4 × 10⁵ 1.1 × 10⁷ 2.1 × 10⁶ 1.0
Antiproton 1.4 × 10⁷ 2.8 × 10⁸ 3.7 × 10⁷ 18
Negative Pion 2.9 × 10⁷ 6.9 × 10⁸ 8.3 × 10⁷ 39
10 to 15 cm (SOBP)
Carbon 7.1 × 10⁵ 2.4 × 10⁷ 4.5 × 10⁶ 0.56
Helium 2.1 × 10⁶ 4.7 × 10⁷ 1.1 × 10⁷ 1.7
Proton 1.3 × 10⁶ 1.4 × 10⁷ 5.8 × 10⁶ 1.0
Table 5. Simulated neutron fluence and Gd neutron capture reactions per Gy of absolute dose for the various
charged particles investigated in this study. The last column is the Gd neutron capture rate relative to protons.
evident in both codes. Similarly, the trend of increased thermal neutron fluence per Gy with decreasing atomic
number can be observed for the two codes.
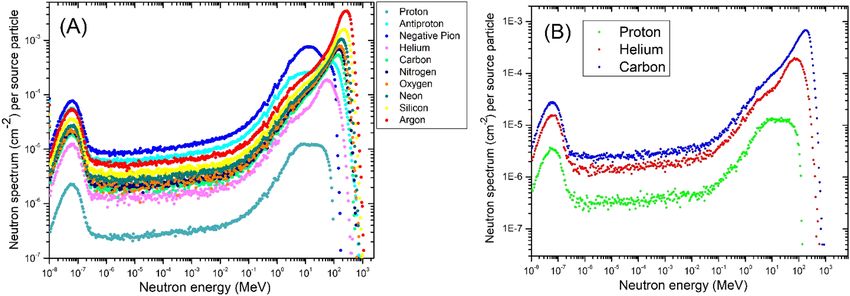
The total neutron fluence spectra per source particle for each SOBP investigated can be observed in Fig. 5.
Qualitatively, the neutron spectra has identical features consisting of a broad peak in the low energy (< 0.1 eV)
region and at the high energy region. The profound neutron peak in the thermal energy region is important for
the application of neutron capture techniques for each of the charged particles.
Discussion
In this work, we investigated the Gd neutron capture rate for ten ion beams. Negative pions, antiprotons, and
helium ions produced a Gd neutron capture per GyE value larger than that of the protons. Although, studies
have been conducted investigating the feasibility of using both antiprotons and negative pions for therapy, helium
ions may be the only clinically viable particle out of the three37,38,47,48. In a study conducted by Paganetti et al.,
it was determined that although 1 × 1 cm2 antiproton beam characteristics are comparable to that of protons, a
clinically relevant field size of 10 × 10 cm2 would be inferior38. This is because the majority of the annihilation
energy from antiprotons is given to the long-range secondary particles, which result in a dose halo around the
primary field and degrade both the lateral and distal fall-off38. Negative pions have been studied in the context
of several different clinical trials. The investigations concluded that though the negative pions lead to an effective
treatment, they add little to no benefit when compared to other ion therapies47. Three separate institutes, Los
Scientific Reports | (2020) 10:13417 | https://doi.org/10.1038/s41598-020-70429-9 7
Vol.:(0123456789)www.nature.com/scientificreports/
Gd neutron captures reactions per RBE × Gy (captures/ Normalized RBE weighted Gd neutron capture
RBE RBE value reference Particle 5 to 10 cm (SOBP) GyE) reactions
4.25 Goldstein et al.42 Argon 1.2 × 10⁵ 0.06
44
3.75 Blakely et al. Silicon 1.3 × 10⁵ 0.07
3.5 Goldstein et al.42 Neon 1.9 × 10⁵ 0.10
3.25 Tran et al.45 Oxygen 2.3 × 10⁵ 0.12
3 Tran et al.45 Nitrogen 3.0 × 10⁵ 0.15
2.75 Goldstein et al.42 Carbon 3.8 × 10⁵ 0.20
1.5 Goldstein et al.42 Helium 2.5 × 10⁶ 1.3
1.1 Tepper et al.43 Proton 1.9 × 10⁶ 1.0
2 Holzscheiter et al.46 Antiproton 1.9 × 10⁷ 10
2.5 Raju et al.31 Negative Pion 3.3 × 10⁷ 17
10 to 15 cm (SOBP)
2.75 Goldstein et al.42 Carbon 1.6 × 10⁶ 0.2
42
1.5 Goldstein et al. Helium 7.2 × 10⁶ 1.2
1.1 Tepper et al.43 Proton 5.3 × 10⁶ 1.0
Table 6. Simulated Gd neutron capture reactions normalized to an estimate of RBE weighted dose (RBE × Gy).
The last column is RBE weighted captures normalized to protons.
Figure 4. (A) Thermal neutron production per source particle as a function of atomic number (Z), (B)
Gadolinium neutron capture reactions per Gy as a function of 1/atomic number (Z).
Alamos Meson Physics Facility (LAMPF), Tri University Meson Facility (TRIUMF) and the Swiss Institute for
Nuclear Research (SIN-PSI) have performed a total of 245 negative pion treatments for prostate cancer. Results
varied throughout each institution, the most recent study conducted at SIN-PSI demonstrated a local control of
89% after 2 years and 83% after 5 years. A major concern with negative pion therapy is the justification for the
large therapeutic treatment cost47. While there are arguably other secondary particles that can be used for imag-
ing in antiproton49 and negative pion therapy50, these particles are correlated to deposited dose, whereas imaging
Gd would identify characteristics of the tumor volume. This dynamic tumor image displayed in coincidence
to treatment can be fused with a CT or MRI image series and used as a method to localize tumor position. The
visible tumor image can be used as a method to indicate the effectiveness of treatment with each subsequent
fractionation and provide spatial information for adaptive therapy techniques9. Also, dose enhancement was not
investigated within this study, however, it is worth further investigation to determine if Gd dose enhancement
would provide an impactful benefit to therapeutic treatment from any of these 10 particles.
Recently, there has been a strong interest in the application of helium ions for treatment of cancer48. Helium
exhibits depth dose characteristics identical to protons along the longitudinal depth, but has reduced lateral
scattering due to its larger mass. This advantage is interesting as the LET of helium ions is higher than that
of protons45. Distinct from carbon and other heavy ions, helium produces little to no fragmentation tail and
therefore treatments are capable of gaining the benefit of a higher RBE value while also maintaining a sharp
dose fall-off after the t umor48.
It was determined in this study that heavier ions were less than ideal for thermal neutron capture techniques,
particularly, when the neutron production was scaled in terms of relative biological dose. This result, although
Scientific Reports | (2020) 10:13417 | https://doi.org/10.1038/s41598-020-70429-9 8
Vol:.(1234567890)www.nature.com/scientificreports/
MCNP6 Vr. 6.1.1 Geant4 Vr. 10.02.p02
Particle 5 to 10 cm (SOBP) Thermal neutron fluence (cm−2/Gy) Thermal neutron fluence (cm−2/Gy) Ratio
5
Argon 1.74 × 10 2.81 × 10⁵ 1.62
Silicon 1.74 × 10⁵ 2.01 × 10⁵ 1.15
Neon 2.24 × 10⁵ 2.52 × 10⁵ 1.13
Oxygen 2.55 × 10⁵ 3.99 × 10⁵ 1.57
Nitrogen 3.09 × 10⁵ 3.75 × 10⁵ 1.22
Carbon 3.66 × 10⁵ 3.95 × 10⁵ 1.08
Helium 1.27 × 10⁶ 1.73 × 10⁶ 1.36
Proton 7.40 × 10⁵ 8.64 × 10⁵ 1.17
Antiproton 1.36 × 10⁷ 7.26 × 10⁶ 0.56
Negative Pion 2.89 × 10⁷ 4.28 × 10⁶ 0.14
10 to 15 cm SOBP
Carbon 7.05 × 10⁵ 9.66 × 10⁵ 1.37
6
Helium 2.13 × 10 2.19 × 10⁶ 1.03
Proton 1.26 × 10⁶ 1.49 × 10⁶ 1.18
Table 7. Comparison of MCNP and Geant4 MC results.
Figure 5. (A) Total neutron fluence spectrum for a 5 to 10 cm SOBP for all 10 particles. (B) Total neutron
fluence spectrum for a 10 to 15 cm SOBP for protons, helium ions, and carbon ions.
not advantageous for neutron capture based imaging, is beneficial due to a reduced neutron dose to healthy
structures for heavier ions.
To model the various ions used within this study, two Monte Carlo codes were selected and found to be within
one order of magnitude for each particle and measurement setup. This result comparing the Geant4 toolkit with
the MCNP6 transport code for the production of thermal neutron fluence over absolute dose relies heavily on
the physics models implemented in each simulation. Regardless, this study determined a consistently close
agreement in relative magnitude for the measurement of thermal neutron fluence per absorbed dose ( cm−2/Gy)
for each of the simulated particles.
In our previous feasibility study (Van Delinder et al. 2020), we studied for the first-time, experimental meas-
urements of the Gd neutron capture spectrum on a proton therapy treatment unit. Five measurements were
obtained in which a signal-to-noise ratio of greater than 5 was determined to be achievable for imaging Gd in
proton therapy for high dose per fraction treatments9. From our simulation results, it can be concluded that
these values would be larger for a passive treatment technique that utilizes helium particles, negative pions or
antiprotons.
A recent study by Safavi-Naeini et al. investigated tumor dose enhancement as a result of thermal neutron
capture in Gd for ion therapy. A 10–15 cm proton SOBP administered on a box of PMMA with a 5 c m3 tumor
resulted in an average fluence of roughly 8 × 10⁸ thermal neutrons per Gy (cm−2/Gy) of dose via simulation7. This
thermal neutron production is significantly higher than the results obtained in our work using ICRU soft-tissue,
as well as our previous study using a water phantom9. Based on this, there is a need for a Monte Carlo study
investigating neutron production with variation of SOBP by field size and Gaussian pencil beam on several differ-
ent tissue-like materials. Since neutron production is directly proportional to the specifics of the treatment unit,
beam configuration, tissue heterogeneity and other components; a more comprehensive study would incorporate
a scaling or validation from experimental measurements. Regardless, the increased thermal neutron production,
Scientific Reports | (2020) 10:13417 | https://doi.org/10.1038/s41598-020-70429-9 9
Vol.:(0123456789)www.nature.com/scientificreports/
which was determined from Safavi-Naeini et al. would result in a greater amount of Gd neutron captures and
therefore, provide a greater benefit for the spectroscopic application of PNGXD as well as Gd neutron capture
dose enhancement. A large thermal neutron production would have dual benefits: allowing an increased localized
tumor dose and the capability to image the enhanced dose component from the PNGXD photons.
Conclusions
Ten different particles were simulated to study thermal neutron production for the application of Gd neutron
capture imaging (PNGXD) and Gd neutron capture therapy. Excluding three particles (antiprotons, negative
pions, helium ions), a trend was observed demonstrating a decrease in neutron production per GyE with increas-
ing atomic number. We found that three particles, antiprotons, negative pions, and helium ions, consistently
produced more thermal neutron captures than protons. For a 5 to 10 cm SOBP, these three particles produced
1.9 × 10⁷, 3.3 × 10⁷, 2.5 × 10⁶ neutron captures per GyE, respectively. When normalized to protons per RBE
weighted dose, Gd neutron capture ratios of 10, 17 and 1.3 were determined in antiprotons, negative pions,
and helium ions. It is likely that these three particles would benefit the most from PNGXD imaging and tumor
dose enhancement, however, helium ions continue to be the most clinically attractive particle out of the three.
Received: 16 April 2020; Accepted: 28 July 2020
References
1. Otto, K. Volumetric modulated arc therapy: IMRT in a single gantry arc. Med. Phys. 35, 310–317 (2008).
2. Vogin, G. et al. A step towards international prospective trials in carbon ion radiotherapy: Investigation of factors influencing dose
distribution in the facilities in operation based on a case of skull base chordoma. Radiat. Oncol. 14, 24 (2019).
3. Particle Therapy Co-Operative Group. Particle therapy facilities in clinical operation https://www.ptcog.ch/index.php/facilities
-in-operation (2020).
4. Mohan, R. & Grosshans, D. Proton therapy—present and future. Adv. Drug Deliv. Rev. 109, 26–44 (2017).
5. ICRU. Basic Aspects of High Energy Particle Interactions and Radiation Dosimetry. ICRU Report 28 (1978).
6. Protection, R. ICRP publication 103. Ann. ICRP 37, 2 (2007).
7. Safavi-Naeini, M. et al. Opportunistic dose amplification for proton and carbon ion therapy via capture of internally generated
thermal neutrons. Sci. Rep. 8, 1–13 (2018).
8. Gräfe, J. L. Proton neutron gamma-X detection (PNGXD): An introduction to contrast agent detection during proton therapy via
prompt gamma neutron activation. Nucl. Instrum. Methods Phys. Res., Sect. B 407, 20–24 (2017).
9. Van Delinder, K. W., Crawford, D., Zhang, T., Khan, R. & Gräfe, J. L. Investigating neutron activated contrast agent imaging for
tumor localization in proton therapy: A feasibility study for proton neutron gamma-x detection (PNGXD). Phys. Med. Biol. 65,
035005 (2020).
10. Masuda, T. et al. Measurement of nuclear reaction cross sections by using Cherenkov radiation toward high-precision proton
therapy. Sci. Rep. 8, 1–8 (2018).
11. Yao, Z., Xiao, Y., Chen, Z., Wang, B. & Hou, Q. Compton-based prompt gamma imaging using ordered origin ensemble algorithm
with resolution recovery in proton therapy. Sci. Rep. 9, 1–15 (2019).
12. Miller, G. A. Jr., Hertel, N. E., Wehring, B. W. & Horton, J. L. Gadolinium neutron capture therapy. Nucl. Technol. 103, 320–331
(1993).
13. Goorley, T. & Nikjoo, H. Electron and photon spectra for three gadolinium-based cancer therapy approaches. Radiat. Res. 154,
556–563 (2000).
14. Kandlakunta, P., Cao, L. R. & Mulligan, P. Measurement of internal conversion electrons from Gd neutron capture. Nucl. Instrum.
Methods Phys. Res., Sect. A 705, 36–41 (2013).
15. Stepanek, J. Emission spectra of Gadolinium-158. Med. Phys. 30, 41–43 (2003).
16. Klykov, S. A. et al. Experimental determination of energy release in the neutron capture by gadolinium. Atomnaya Energiya 91, 1
(2001).
17. Morrison, D. E. et al. High mitochondrial accumulation of new gadolinium (III) agents within tumour cells. Chem. Commun. 50,
2252–2254 (2014).
18. Morrison, D. E. et al. Synthesis and biological evaluation of a class of mitochondrially-targeted gadolinium (III) agents. Chem. A
Eur. J. 20, 16602–16612 (2014).
19. Issa, F., Ioppolo, J. A. & Rendina, L. M. Boron and gadolinium neutron capture therapy. In Comprehensive Inorganic Chemistry II:
From Elements to Applications (eds Reedijk, J. & Poeppelmeier, K.) 877–900 (Elsevier, Amsterdam, 2013).
20. De Stasio, G. et al. Motexafin-gadolinium taken up in vitro by at least 90% of glioblastoma cell nuclei. Clin. Cancer Res. 12, 206–213
(2006).
21. Thomas, S. R. & Khuntia, D. Motexafin gadolinium: A promising radiation sensitizer in brain metastasis. Expert Opin. Drug Discov.
6, 195–203 (2011).
22. Cerullo, N., Bufalino, D. & Daquino, G. Progress in the use of gadolinium for NCT. Appl. Radiat. Isot. 67, 157–160 (2009).
23. Fairlie, I. RBE & wR values of Auger emitters and low-range beta emitters with particular reference to tritium. J. Radiol. Prot. 27,
157 (2007).
24. Humm, J. L., Howell, R. W. & Rao, D. V. Dosimetry of Auger-electron-emitting radionuclides: report no. 3 of AAPM Nuclear
Medicine Task Group No. 6. Med. Phys. 21, 1901–1915 (1994).
25. Schuemann, J. et al. TOPAS-nBio: an extension to the TOPAS simulation toolkit for cellular and sub-cellular radiobiology. Radiat.
Res. 191, 125–138 (2019).
26. Firestone, R. B. Database of Prompt Gamma Rays from Slow Neutron Capture for Elemental Analysis (International Atomic Energy
Agency, Vienna, 2006).
27. Kibedi, T., Burrows, T. W., Trzhaskovskaya, M. B., Davidson, P. M. & Nestor, C. W. Jr. Evaluation of theoretical conversion coef-
ficients using Br Icc. Nucl. Instrum. Methods Phys. Res. Sect. A 589, 202–229 (2008).
28. Gräfe, J. L., McNeill, F. E., Chettle, D. R. & Byun, S. H. Characteristic X ray emission in gadolinium following neutron capture as
an improved method of in vivo measurement: A comparison between feasibility experiment and Monte-Carlo simulation. Nucl.
Instrum. Methods Phys. Res., Sect. B 281, 21–25 (2012).
29. Kavanagh, J. N. et al. Antiproton induced DNA damage: proton like in flight, carbon-ion like near rest. Sci. Rep. 3, 1770 (2013).
30. Raju, M. R., Richman, C. & Curtis, S.B. A review of the physical characteristics of pion beams. Proc. 1st Intern. Symp. Biol. Inter-
pretation of Dose from Accelerator Produced Radiation, UCRL-17441 (1967).
31. Raju, M. R. & Richman, C. Negative pion radiotherapy: Physical and radiobiological aspects. Curr. Top. Radiat. Res. Q. 8, 159–233
(1972).
Scientific Reports | (2020) 10:13417 | https://doi.org/10.1038/s41598-020-70429-9 10
Vol:.(1234567890)www.nature.com/scientificreports/
32. Titt, U., Bednarz, B. & Paganetti, H. Comparison of MCNPX and Geant4 proton energy deposition predictions for clinical use.
Phys. Med. Biol. 57, 6381 (2012).
33. Jette, D. & Chen, W. Creating a spread-out Bragg peak in proton beams. Phys. Med. Biol. 56, 131 (2011).
34. Podgoršak, E. B. Radiation physics for medical physicists 262–265 (Springer, Berlin, 2006).
35. Kraan, A. C. Range verification methods in particle therapy: Underlying physics and Monte Carlo modeling. Front. Oncol. 5, 150
(2015).
36. Munteanu, D. & Autran, J. L. Susceptibility of group-IV and III-V semiconductor-based electronics to atmospheric neutrons
explored by Geant4 numerical simulations. in Numerical Simulations in Engineering and Science (eds. Rao, R.) 117–133 (Books
on Demand, 2018).
37. Jäkel, O. Physical advantages of particles: Protons and light ions. Br. J. Radiol. 93, 20190428 (2020).
38. Paganetti, H., Goitein, M. & Parodi, K. Spread-out antiproton beams deliver poor physical dose distributions for radiation therapy.
Radiother. Oncol. 95, 79–86 (2010).
39. Bassler, N. et al. The antiproton depth–dose curve in water. Phys. Med. Biol. 53, 793 (2008).
40. Michael Handley, S. & Ahmad, S. An antiproton simulation study using MCNPX for radiation therapy. J. X-ray Sci. Technol. 19,
345–353 (2011).
41. Jones, B., Underwood, T. S. A. & Dale, R. G. The potential impact of relative biological effectiveness uncertainty on charged particle
treatment prescriptions. Br. J. Radiol. 84, 61–69 (2011).
42. Goldstein, L. S., Phillips, T. L. & Ross, G. Y. Biological effects of accelerated heavy ions. II. Fractionated irradiation of intestinal
crypt cells. Radiat. Res. 86, 542–558 (1981).
43. Tepper, J. et al. In vivo determinations of RBE in a high energy modulated proton beam using normal tissue reactions and fraction-
ated dose schedules. Int. J. Radiat. Oncol. Biol. Phys. 2, 1115–1122 (1977).
44. Blakely, E. A., Ngo, F. Q., Curtis, S. B. & Tobias, C. A. Heavy-ion radiobiology: Cellular studies. Adv. Radiat. Biol. 11, 295–389
(1984).
45. Tran, L. T. et al. The relative biological effectiveness for carbon, nitrogen, and oxygen ion beams using passive and scanning tech-
niques evaluated with fully 3D silicon microdosimeters. Med. Phys. 45, 2299–2308 (2018).
46. Holzscheiter, M. H. et al. The biological effectiveness of antiproton irradiation. Radiother. Oncol. 81, 233–242 (2006).
47. Wisser, L. Pion treatment of prostate carcinoma at Paul Scherrer Institute (formerly Swiss Institute for Nuclear Research (SIN))
from 1983 to 1992. Cancer/Radiothérapie 8, 88–94 (2004).
48. Tessonnier, T. et al. Proton and helium ion radiotherapy for meningioma tumors: a Monte Carlo-based treatment planning com-
parison. Radiat. Oncol. 13, 1 (2018).
49. Kalogeropoulos, T. E. & Muratore, R. Antiprotons for imaging and therapy. Nucl. Instrum. Methods Phys. Res. Sect. B 40, 1322–1325
(1989).
50. Feege, N. Imaging pion showers with the CALICE analogue hadron calorimeter. 2nd International Conference on Advancements
in Nuclear Instrumentation, Measurement Methods and their Applications IEEE, 1–6 (2011).
Acknowledgements
This work was supported by the Natural Sciences and Engineering Research Council of Canada Discovery Grant
program RGPIN-2017-04386.
Author contributions
The idea to further investigate Proton Neutron Gamma-X Detection for the application of 10 ten different
particles was jointly proposed by K.V.D. and Dr. J.G. K.V.D. designed and carried out the Monte Carlo simula-
tions, calculations and data analytics produced within this study. The theory and layout of the manuscript was
conceptualized by Dr. J.G. and K.V.D. The scientific manuscript was first authored by K.V.D. Technical feedback
of the results were performed by both Dr. J.G. and Dr. R.K. Dr. J.G. and Dr. R.K. contributed their extensive
knowledge and experience in medical physics and particle therapy to assist with this manuscripts professional
preparation. All authors have carefully reviewed the finished manuscript.
Competing interests
The authors declare no competing interests.
Additional information
Correspondence and requests for materials should be addressed to K.W.V.D.
Reprints and permissions information is available at www.nature.com/reprints.
Publisher’s note Springer Nature remains neutral with regard to jurisdictional claims in published maps and
institutional affiliations.
Open Access This article is licensed under a Creative Commons Attribution 4.0 International
License, which permits use, sharing, adaptation, distribution and reproduction in any medium or
format, as long as you give appropriate credit to the original author(s) and the source, provide a link to the
Creative Commons license, and indicate if changes were made. The images or other third party material in this
article are included in the article’s Creative Commons license, unless indicated otherwise in a credit line to the
material. If material is not included in the article’s Creative Commons license and your intended use is not
permitted by statutory regulation or exceeds the permitted use, you will need to obtain permission directly from
the copyright holder. To view a copy of this license, visit http://creativecommons.org/licenses/by/4.0/.
© The Author(s) 2020
Scientific Reports | (2020) 10:13417 | https://doi.org/10.1038/s41598-020-70429-9 11
Vol.:(0123456789)You can also read