Corrosion Behavior of High Nickel Alloys in Molten Nitrate Solar Salt - IOPscience
←
→
Page content transcription
If your browser does not render page correctly, please read the page content below
Journal of The Electrochemical
Society

OPEN ACCESS

Corrosion Behavior of High Nickel Alloys in Molten Nitrate Solar Salt
To cite this article: Keenan O’Neill et al 2021 J. Electrochem. Soc. 168 021502

View the article online for updates and enhancements.

                               This content was downloaded from IP address 46.4.80.155 on 17/03/2021 at 11:45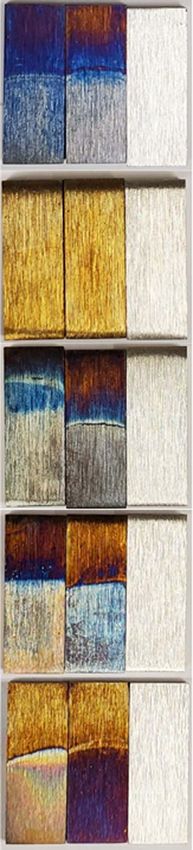
Journal of The Electrochemical Society, 2021 168 021502

                            Corrosion Behavior of High Nickel Alloys in Molten Nitrate Solar
                            Salt
                            Keenan O’Neill,1 Zachary Karmiol,1 John Groth,2 Helena Alves,3 and
                            Dev Chidambaram1,*,z
                            1
                                Materials Science and Engineering, University of Nevada, Reno, Reno, Nevada 89557-0388, United States of America
                            2
                                VDM Metals USA, Reno, Nevada 89506, United States of America
                            3
                                VDM Metals International GmbH, Werdohl, Germany

              Electrochemical corrosion testing was used to evaluate the corrosion resistance of four different nickel-based alloys, namely UNS
              N06230, UNS N06025, UNS N06617, and UNS N06625, in a molten nitrate salt that is used as a heat transfer media and thermal
              energy storage material in solar-thermal power plants. The tests were conducted at 500 °C to simulate near-maximum service
              temperature in the 3:2 by weight sodium nitrate: potassium nitrate mixture. All tested samples had corrosion current densities on
              the order of 10−4 A cm−2 with corrosion potentials varying from −227 mV to −66.2 mV vs Pt. The tested samples exhibited low
              corrosion current density in the range of 0.225 mA cm−2 to 0.431 mA cm−2. The morphology of the samples surfaces was studied
              using scanning electron microscopy which showed the formation of a surface film on all samples. Cross-sectional analysis was
              performed using focused ion beam scanning electron microscopy. The surface chemistry was ascertained using energy dispersive
              spectroscopy, X-ray diffraction, Raman spectroscopy and X-ray photoelectron spectroscopy (XPS). Raman spectra paired with
              XPS suggested the formation of various nickel-chromium-iron spinels on UNS N06625. These results show that UNS N06625 has
              the potential to be a material for use in solar-thermal plants.
              © 2021 The Author(s). Published on behalf of The Electrochemical Society by IOP Publishing Limited. This is an open access
              article distributed under the terms of the Creative Commons Attribution Non-Commercial No Derivatives 4.0 License (CC BY-
              NC-ND, http://creativecommons.org/licenses/by-nc-nd/4.0/), which permits non-commercial reuse, distribution, and reproduction
              in any medium, provided the original work is not changed in any way and is properly cited. For permission for commercial reuse,
              please email: permissions@ioppublishing.org. [DOI: 10.1149/1945-7111/abdc66]

              Manuscript submitted November 23, 2020; revised manuscript received January 11, 2021. Published February 1, 2021. This paper
              is part of the JES Focus Issue on Characterization of Corrosion Processes in Honor of Philippe Marcus.
              Supplementary material for this article is available online

    Energy demands around the world continue to grow steadily with                applications is the solar salt blend, a mix of 3:2 NaNO3:KNO3.8 A
increases in population and development. This growing energy                      significant issue with using salts as a HTF is the corrosive effect of
demand is increasing emphasis on methods of generating energy.1                   the salts at high temperatures which limits the container materials
Fossil fuels are the primary source of energy production, but their               that can be used for these systems. The corrosion behavior of service
burning produces CO2 which accounts for ∼81% of all U.S.                          alloys is especially important in plants that generate energy
greenhouse gas emissions.2,3 The atmospheric pollution from fossil                throughout the day since thermal cycling of the HTF can affect
fuel sources has created a worldwide initiative for the use of more               the tank materials even more. Since corrosion is not easily modelled
sustainable energy sources, like geothermal, hydroelectric, wind, and             or predicted, direct corrosion testing in the salt is required to
solar energy. Intermittent sources of energy (i.e. wind and solar)                understand the behavior of specific materials in these systems.
require a secondary energy storage system to provide energy                           In addition to solar thermal systems, similar salts are used in
consistently throughout the day like baseload energy sources. One                 other applications like heat-treatment of alloys. A molten nitrate salt,
source of sustainable energy that has gained increased interest in                called Drawsalt, is used for solution treatment of aluminum alloys.9
recent years is concentrated solar power (CSP) with thermal energy                Nitrate salts have also been employed for heat treatment of carbon
storage (TES) as it does not require a secondary energy storage                   and low-alloy steels owing to the temperature range at which nitrate
system. CSP involves collecting energy from the Sunlight and                      salts can operate. In a process called martempering, steels undergo
transferring it into a TES medium. CSP plants utilize many different              an interrupted quenching process where they are cooled rapidly to
designs—parabolic troughs, dish Sterling engines, and solar power                 just above the martensite formation temperature and are held there
towers—but the energy generated comes from reflecting light from                   for a period of time before being cooled to room temperature.10,11
the Sun onto a central point.4 The central point contains a heat                  Salts are also used to heat workpieces as it avoids thermal shock by
transfer fluid (HTF) that distributes its heat to a Rankine cycle steam            reducing the initial heat flux into the workpiece.12 These applications
generator to generate electricity.4 This process is more efficient at              will also benefit from the studies conducted here on identifying new
providing energy throughout a day than the photovoltaic cells used                corrosion resistant materials.
in solar panels because the harnessed energy can be stored in the                     Corrosion resistance of a material in an environment is often
form of thermal energy in a heat storage medium for use at later                  studied using exposure tests. Various materials, including ferritic
times when the Sun is not shining.5 The heat storage medium                       and stainless steels, nickel and nickel-chromium alloys, and high-
requires specific characteristics to be effective, such as a high boiling          temperature alloys have been the subject of extensive exposure
point, a low melting point, high heat capacity, high thermal                      studies in molten nitrate salts similar to solar salt.13–26 Exposure
conductivity, and a higher operating temperature.6                                testing yields direct information about a material’s performance
    Until recent years, the most common TES media was steam or                    through gravimetric analysis and corrosion layer analysis, but
thermal oils, but molten salt mixtures are able to reach higher                   exposure studies are expensive and require lengthy testing periods
operating temperatures than both water-based fluids and thermal                    to provide more accurate data. It is far more beneficial to use
oils.6,7 This higher operating temperature increases the theoretical              accelerated electrochemical testing as a screening process to
thermodynamic efficiency of the heat engine system according to                    evaluate materials to determine whether a material is a suitable
Carnot’s efficiency. A common salt currently in use for solar thermal              candidate for use in a specific environment. Results from accelerated
                                                                                  electrochemical testing have been successfully related to exposure
                                                                                  experiment results in aqueous systems making them a good
  *Electrochemical Society Life Member.                                           screening process.27 However, molten nitrate salts are unlike
  z
    E-mail: dcc@unr.edu                                                           aqueous systems because of their high temperature, high ion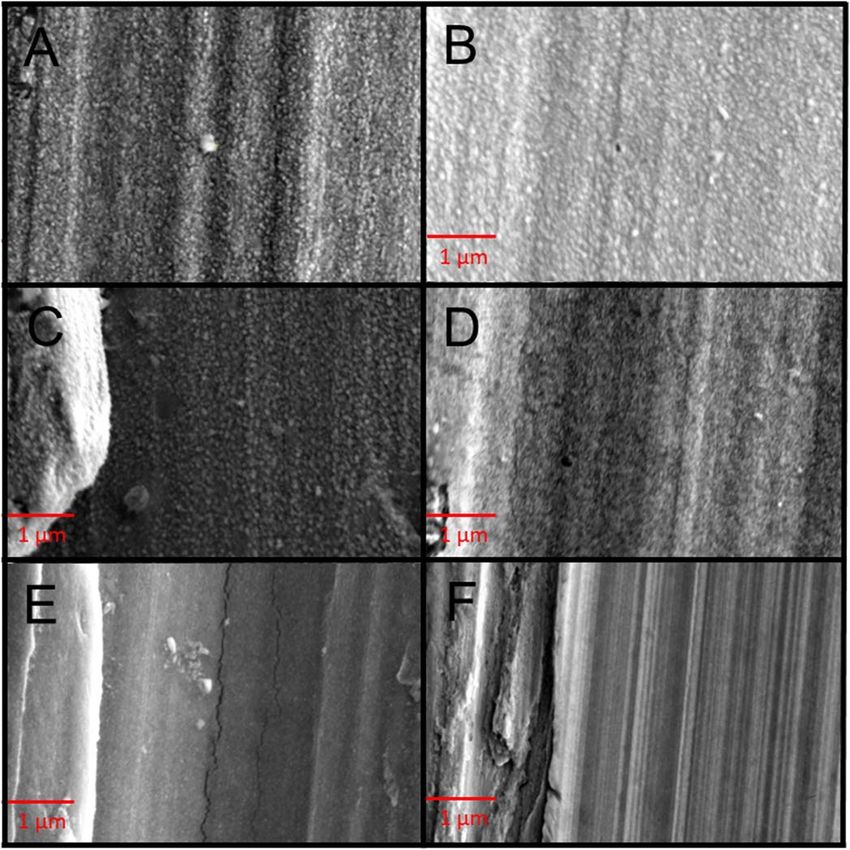
Journal of The Electrochemical Society, 2021 168 021502

concentration, and the added instability resulting from nitrate ion
decomposition at high temperatures into nitrite and various nitrous
oxides (NOx).14,28–30 Nevertheless, it has been shown that the
information obtained from accelerated corrosion tests in nitrate salts
can relate effectively to results obtained from long-term exposure
tests.26,29
    Potentiodynamic polarization has been conducted on various
iron-based alloys of varying degrees of corrosion resistance, and in
these alloys it is shown that a scale mainly composed of iron oxides
and sodium iron oxides is developed.26,31,32 It has also been
demonstrated that preferential leaching of chromium is a frequent
issue in high-chromium alloys like stainless steels and nickel-
chromium alloys.24,26,33–36 In various studies conducted, nickel-
based high-chromium alloys generally outperform ferritic alloys, but
the alloys reported to be most resistant to corrosion in nitrate salt are
those that contain aluminum in addition to chromium or those coated
with aluminum.20,22,31,37 Two out of the five materials tested herein
contain greater than 1 wt% aluminum, but it is unknown at this time
whether the aluminum content plays a role in corrosion resistance in
the salt at 500 °C. Here, four high-chromium, nickel-based alloy                Figure 1. The schematic of the setup used for this study. Briefly, the
samples were studied using potentiodynamic polarization to screen               experimental setup consisted of suspending the three electrodes (WE:
these materials for long-term exposure studies. Surface chemistry of            working electrode, RE: reference electrode, and CE: counter electrode) in
these alloys were then studied to understand the surface chemistry              molten 3:2 by weight NaNO3:KNO3 salt mixture.
and correlate it to the observed corrosion behavior.
                                                                                were tested in their as-received state with a final sanded surface
                            Experimental
                                                                                preparation of 120 grit for consistency between samples. The five
   Five different materials—UNS N06230, annealed (Alloy 230);                   different materials were evaluated using potentiodynamic polariza-
UNS N06025, solution annealed (VDM Alloy 602CA®); UNS                           tion tests in a 3:2 by weight NaNO3:KNO3 mixture. The sodium
N06617, solution annealed (VDM® Alloy 617); UNS N06625GR1,                      nitrate and potassium nitrate were of ACS Reagent grade and
annealed (VDM® Alloy 625 Grade 1); and UNS N06625GR2,                           purchased from VWR and Amresco, respectively. The preparation
solution annealed (VDM® Alloy 625 Grade 2) were used. The                       procedures for these salts and the experiments below have been
certified compositions of these materials are listed in Table I. Only            described in previous publications that included drying for a 24 h
one entry is given for alloys UNS N06625GR1 and UNS                             period to reduce water content of the salts.13,26 The salt was melted
N06625GR2 as they are the same alloy, UNS N06625, with different                in an alumina crucible in a furnace that was heated to 500 °C in a
heat treatments. The GR1 and GR2 suffixes refer to the following                 fume hood for each experiment. All potentiodynamic polarization
heat treatments: GR1 was annealed at 950 °C to 1,050 °C (1,742 to               experiments and open circuit potential (OCP) analyses were
1,922 °F) and met the requirement for ASTM B443 Grade 1; GR2                    conducted in a three-electrode setup using a Gamry Reference 600
was solution annealed at 1,080 °C to 1,160 °C (1,976 to 2,120 °F)               potentiostat that was controlled using the Gamry software. A coiled
and met the requirement for ASTM B443 Grade 2. The samples                      UNS N06625 wire was used as the counter electrode for each

   Table I. The chemical composition of the four alloys is shown below in weight percent.

   Element (wt%)                    UNS N06230                      UNS N06025                       UNS N06617                      UNS N06625GR1/2

   Ni                                   REM                             62.0                             54.28                              61.17
   Mo                                   1.24                             —                                8.6                                8.5
   W                                    13.90                            —                                —                                  —
   Co                                   0.18                             —                               11.4                               0.03
   Al                                   0.41                             2.2                             1.07                               0.10
   Ti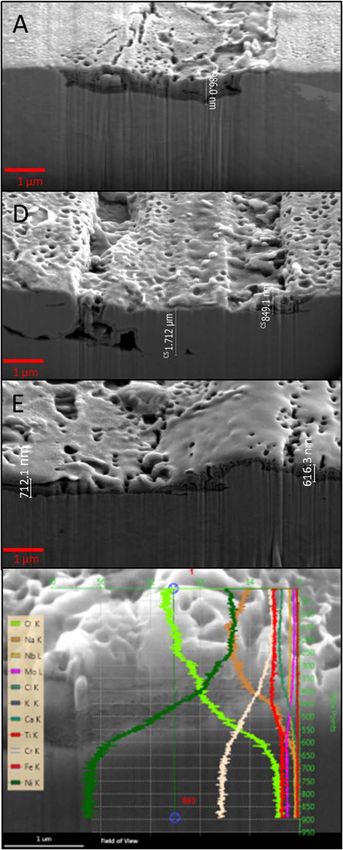
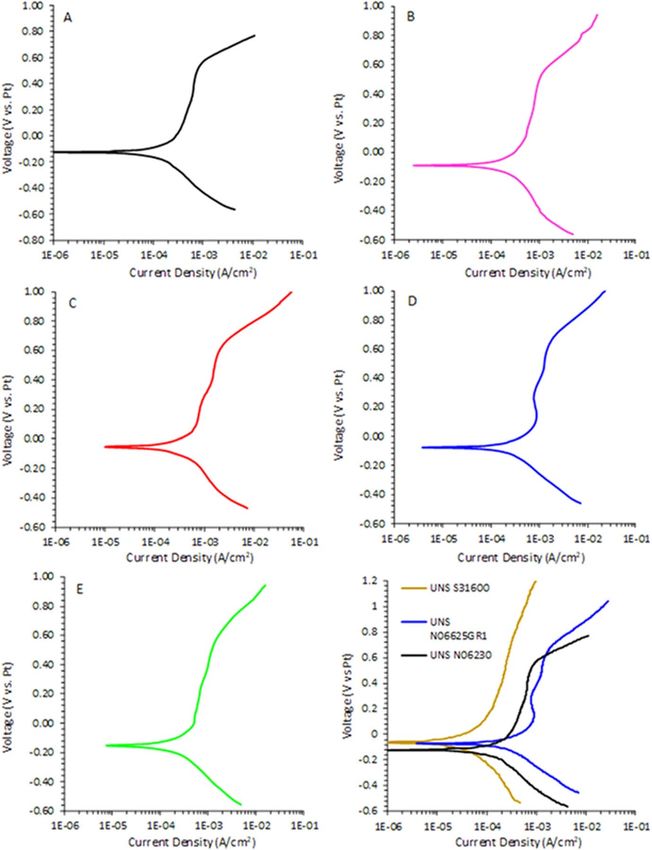
Journal of The Electrochemical Society, 2021 168 021502

Figure 2. Potentiodynamic polarization scans obtained at a scan rate of 5 mV s−1 from the five different samples (one of the duplicates) are shown. (A): UNS
N06230; (B): UNS N06025; (C): UNS N06617; (D): UNS N06625GR1; (E): UNS N06625GR2; (F): The samples showing the lowest (UNS N06230) and
highest (UNS N06625GR1) current density are shown against the results for UNS S31600.

Journal of The Electrochemical Society, 2021 168 021502

   Table II. The average corrosion current density (icorr) and the
   corrosion potential (Ecorr) are shown below for each sample. It may                  A
   be noted that UNS N06230 and UNS N06625GR2 are very similar in
   terms of corrosion potential and corrosion current density. Also,
   provided are values for three materials from a previous study.26

                               Ecorr (mV) vs Pt          Icorr (mA cm−2)

   This study
   UNS N06230                       −214.5                    0.225
   UNS N06025                       −114.4                    0.397
   UNS N06617                       −66.2                     0.348
   UNS N06625GR1                    −148.2                    0.431
   UNS N06625GR2                    −227.0                    0.244
   From prior study26                                                                     B
   UNS S31600                       −62.8                     0.183
   UNS N08810                       −59.1                     0.517
   UNS G41300                       −135.0                    0.321
   From prior study15
   NiCr25FeAlYB                    ∼ −25.0                   ∼2.000

experiment, and a platinum wire was used as a pseudo-reference
electrode mirroring previous studies.13,26 A schematic of the furnace
and electrode assembly is provided in Fig. 1.
    All electrodes were cleaned with deionized water, rinsed with
acetone, and then rinsed with isopropanol before being dried either
in air or with compressed air. Prior to potentiodynamic analysis,                         C
OCP was monitored for 1.25 h at which point OCP was found to be
within a range of 15 mV from the average. Following OCP
measurement, potentiodynamic polarization was conducted with a
scan rate of 5 mV s−1 with a range of −0.5 V to 1 V vs OCP. This
scan rate and potential range were chosen based on previous work
with similar metals in this salt blend.13,26 The tests were conducted
using duplicates. The samples were rinsed post-testing with deio-
nized water to remove any remaining salt residue. The area of each
sample exposed to the salt was measured post-experiment (uncer-
tainty of ±0.25 mm2) to establish the current density.
    Morphology of the sample surfaces was studied using back-
scattered and secondary electron (BSE and SE) detectors of a FEI                         D
Scios Dual-Beam scanning electron microscope (SEM). During
imaging studies, energy dispersive spectra (EDS) were also ob-
tained. Samples were cross-sectioned in the Thermo Scientific Scios
2 DualBeam focused ion beam scanning electron microscope (FIB-
SEM) using a Ga liquid metal ion source. Micrographs, EDS line
scans, and EDS maps, were taken of the cross-section. Samples were
analyzed using X-ray diffraction (XRD) using a Rigaku SmartLab
3 kW X-ray Diffractometer. Raman spectra from the sample surfaces
were also collected using a Thermo Scientific DXR Raman that was
equipped with a 10 mW, 532 nm laser. Sample surfaces were also
analyzed using X-ray photoelectron spectroscopy (XPS) to under-
stand the chemistry of the sample surfaces. A PHI model 5600
Spectrometer was utilized for XPS studies.
                                                                                         E

                                Results
    Electrochemical tests were conducted to evaluate the corrosion
resistance and corrosion behavior of each alloy. The results of the
potentiodynamic polarization tests for each alloy are shown in Fig. 2.
The corrosion current density (icorr) and corrosion potential (Ecorr)
were determined by the Tafel extrapolation method and are provided
in Table II. These values were compared to values obtained from
similar studies.15,26 Similar to most other studies in molten salts, a Pt
pseudo-reference was used in this study and thus the reported
potentials are relative to the Pt pseudo-reference electrode.13,26,38–40
    The lowest average corrosion current density was 0.225 mA cm−2          Figure 3. The post exposure samples (two duplicates on the left) are shown
for alloy UNS N06230, and the highest average corrosion current             along with their unexposed control on right for each material. The samples
density was 0.431 mA cm−2 for alloy UNS N06625GR1. These                    were exposed to molten salt on the bottom. (A): UNS N06230; (B): UNS
values correspond well to values reported for other nickel-based,           N06025; (C): UNS N06617; (D): UNS N06625GR1; (E): UNS N06625GR2.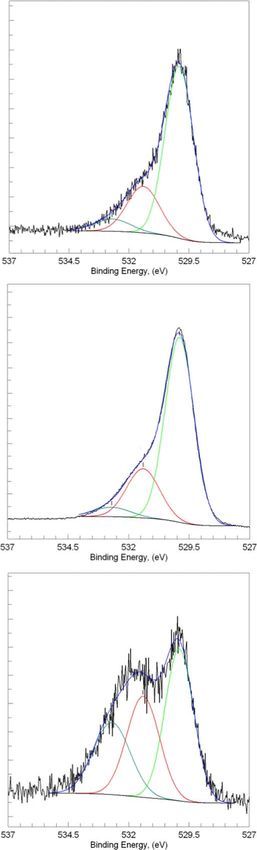
Journal of The Electrochemical Society, 2021 168 021502

Figure 4. The SE-SEM images for five post-exposure samples and one as-received sample are shown above at 35000X. All as-received samples looked similar.
The small, coarse shapes shown on the tested samples appear to be oxides. (A): UNS N06230; (B): UNS N06025; (C): UNS N06617; (D): UNS N06625GR1;
(E): UNS N06625GR2; (F): as-received UNS N06625GR2. F is shown as an example of sample surfaces of all materials in their pre-exposure state.

   Table III. The elemental composition of the surfaces of the post-exposure samples as obtained from EDS is given below. Values are given in weight
   %. Even though depth of analysis of EDS may lead to some of the bulk alloy composition being included in the results, it still is valuable to observe
   the changes in the surface compositions.

                    UNS N06230                 UNS N06025                  UNS N06617                 UNS N06625GR1                   UNS N06625GR2

   Ni                    46                          42                         36                            33                              36
   Cr                    27                          30                         26                            23                              25
   Fe                     3                          11                         3                             7                               6
   W                      6                          —                          —                             —                               —
   Mo                     3                          —                          7                             8                               9
   O                      9                          6                          7                             8                               5
   C                      2                          2                          —                             2                               2
   K                     —                           —                          —                             2                               2
   Na                     1                          1                          1                             1                               1
   Ca                    —                           2                          2                             2                               2
   Nb                    —                           —                          —                             5                               4
   Cu                    —                           2                          —                             —                               —
   Co                    —                           —                          9                             —                               —
   Al                    —                           5                          3                             2                               2
   Ti                    —                           —                          2                             2                               2
   Cl                    ——                          —                          2                             2                               2
   Si                    —                           2                          2                             3                               2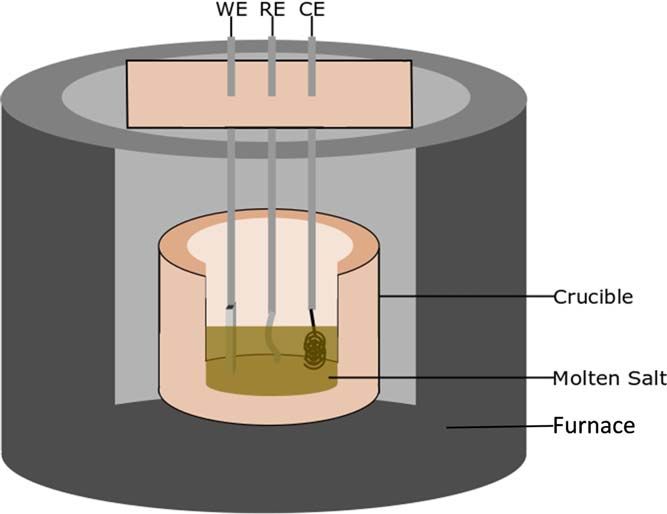
Journal of The Electrochemical Society, 2021 168 021502

                                                                            corrosion-resistant alloys and are comparable to that of stainless steels.
                                                                            UNS S31600 and UNS N08810 exhibited corrosion current densities
                                                                            of about 0.183 mA cm−2 and 0.517 mA cm−2, respectively, under
                                                                            similar experimental conditions.26 Figure 2F shows the lowest (UNS
                                                                            N06230) and highest (UNS N06625GR1) current density obtained
                                                                            here against the results for UNS S31600 also under similar
                                                                            conditions.26
                                                                                The polarization curves for the alloys do not show any clear
                                                                            region of passivation. Therefore, based on the polarization curves, it
                                                                            is unlikely that these alloys are passivating during these tests. There
                                                                            is a region of pseudo-passivity (Fig. 2D) in the polarization curve
                                                                            obtained from UNS N06625GR1 as indicated by a small section of
                                                                            the curve having a slope that is negative which agrees with prior
                                                                            studies on alloys with similar compositions.23 However, the decrease
                                                                            in current density with increasing potential is not significant enough
                                                                            to indicate stable passivation and is thus referred to as
                                                                            pseudopassive.41,42 UNS N06230 had the highest corrosion resis-
                                                                            tance based on its corrosion current density (0.225 mA cm−2) which
                                                                            may correlate to this being the only alloy with tungsten as a
                                                                            component. However, solution annealed UNS N06625GR2 had
                                                                            very similar corrosion current density at 0.244 mA cm−2. It has
                                                                            been proposed that the presence of tungsten in the alloy leads to the
                                                                            formation of salt-soluble tungstates that result in increased
                                                                            corrosion.17 However, the results from this study did not provide a
                                                                            correlation between tungsten and corrosion rates.
                                                                                Corrosion current density is not the only indicator of corrosion
                                                                            resistance. Alloy UNS N06625GR1 had the largest average Tafel
                                                                            slope. An exposure study that tested UNS N06625 and various
                                                                            stainless steels showed that UNS N06625 formed a stable nickel-
                                                                            iron-oxide scale and underwent a lower magnitude of mass change.36
                                                                            These results correlate with the relatively higher corrosion resistance
                                                                            of UNS N06625 in this salt. It is unknown how these alloys compare
                                                                            to aluminized alloys which generally exhibit a lower level of
                                                                            corrosion than other alloys in the solar salt off-eutectic.20,22 The
                                                                            corrosion behavior of chromium-containing alloys such as stainless
                                                                            steels has been studied extensively in this salt; it has also been
                                                                            frequently observed, including in prior studies by the authors, that
                                                                            chromium ionizes and leaches out from the bulk alloy when exposed
                                                                            to nitrate salts.19,24,26,34,36 It should be noted that the corrosion
                                                                            current densities observed agree with corrosion current densities
                                                                            observed for other nickel alloys and are amongst the lowest for bulk
                                                                            alloys observed.43,44 While, the Solar Energy Technology Office of
                                                                            the U. S. Department of Energy has set a year 2030 corrosion rate
                                                                            target goal of 30 μm year−1, studies have yet to identify a bulk alloy
                                                                            capable of achieving that corrosion rate on short-term studies.
                                                                            Corrosion current density in solar nitrate salt, under similar
                                                                            conditions, have been reported to range from 10−4 A cm−223 to
                                                                            10−3 A cm−244,45 corresponding to corrosion rates of ∼300 μm
                                                                            year−1.46 This study reports corrosion current densities of in the
                                                                            range of 10−4 A cm−2, which can be approximated to corrosion rate
                                                                            in the range of ∼250 μm year−1, based on assumptions. Also, the
                                                                            corrosion rate calculated from accelerated corrosion studies should
                                                                            not be compared with long term exposure studies which enable a
                                                                            material to develop a passive film and does not polarize the material
                                                                            to high potentials. Thus, the corrosion current densities observed are
                                                                            at the lower end of corrosion current densities that have been
                                                                            reported and thus makes all of these alloys potential candidates for
                                                                            molten nitrate salts.
                                                                                The samples were cleaned and imaged before and after the
                                                                            potentiodynamic polarization testing. The photographs of the sam-
                                                                            ples prior to and post-testing are shown in Fig. 3 with the submerged
Figure 5. SEM images from the cross-sections obtained using FIB milling     end on the bottom half of each sample. The top and bottom halves of
are shown for UNS N06230 (A); UNS N06625GR1 (D); and UNS
N06625GR2 (E). The surface layer is not complete on UNS N06230 and
                                                                            the samples show corrosion from the vapor and the melt, respec-
vary in thickness on UNS N06625GR1 and is relatively consistent on UNS      tively. The first two samples from the left on each image are
N06625GR2. The line scan data for UNS N06625GR2 (bottom image)              duplicate samples (post-testing) and the third sample in each image
indicates highest levels of oxide, sodium, iron, and niobium in the outer   is that of an untested control (pre-exposure). Several similarities
surface which decreases rapidly towards the bulk. Chromium and nickel       exist in the visual appearance of the materials that were tested. Four
follow a reverse trend.                                                     distinctly colored corrosion layers were observed on the samples:
Journal of The Electrochemical Society, 2021 168 021502
Since the depth of analysis of EDS is large, it may allow for signal
from the base metal. Thus, while the EDS alone may not be used as
conclusive evidence for determining stoichiometry, the differences
observed between the surface film and the bulk metal can be used to
understand the nature of the surface film. The results for UNS
N06625GR1 indicate that the surface composition was primarily
nickel and chromium with lower concentrations of molybdenum,
oxygen, niobium, and iron. The EDS scans for UNS N06625GR2
reveal similar results with slightly more chromium and nickel present.
The elemental composition on the surface of UNS N06617 was
similar to its bulk composition with nickel and chromium making up
most of the surface layer with lower compositions of cobalt, oxygen,
molybdenum, iron, and aluminum. The scans for UNS N06230
indicate a surface composed primarily of nickel and chromium with
smaller concentrations of tungsten, iron, oxygen, and molybdenum.
The EDS scans for UNS N06025 indicated nickel as the primary
element on the surface with a smaller concentration of chromium. The
presence of aluminum, iron, and oxygen was also indicated as well as
Figure 6. XRD patterns obtained from the surface of the samples showed,
for all samples, only the pattern of nickel with orientations noted at the top of lower concentrations of copper and carbon. The minor species
the figure. Thus, the oxide film on the surface was too thin for XRD studies. observed in the EDS scan (K, Ca, N, Na) were likely from the
A: UNS N06230; B: UNS N06025; C: UNS N06617; D: UNS N06625GR1; presence of impurities in the salt or salt that was still present on the
€: UNS N06625GR2. sample.
Three of the samples, UNS N06230, UNS N06625GR1, and
UNS N06625GR2, were cross-sectioned and imaged using FIB-
SEM and the micrographs of the cross-section for these samples are
given in Fig. 5. As discussed in subsequent sections, UNS N06625
(GR1 and GR2) alloys appear to be the better suited for the
conditions used here. UNS N06230 has been well studied in this
environment and was therefore used to compare the performance of
UNS N06625. Thus, these three samples underwent more detailed
examination. The oxide layer on UNS N06230 is very non-uniform
in thickness as seen in the SEM micrographs. One imaged area
shown in Fig. 5 did have some oxide formation in a localized area
about 4 μm across where the oxide thickness was 986 nm, whereas
the other regions had oxide films thinner than 150 nm. The
composition of this area as indicated through an EDS map
(supporting material Fig. S1 (available online at stacks.iop.org/
JES/168/021502/mmedia)) was mainly oxygen and iron but appears
to be depleted of chromium. The oxide layer formed on UNS
N06625GR1 seemed to vary significantly from 150 nm up to 1.7 μm.
The EDS map indicates a surface composition of mostly oxygen and
nickel with some iron present (supporting material Fig. S2).
Chromium appears to be more concentrated in the bulk than on
Figure 7. Stacked Raman spectra for all five samples is shown above. the surface of this sample. The thickness of the oxide layer on UNS
Features marked with 1, 2, and 5 correspond to NiFe2O4. Features marked N06625GR2 was mostly consistent and ranged between 600 and
with 3 and 4 correspond to NiCr2O4. The potential feature for Nb2O5 is also 800 nm. The EDS line scan data, provided in Fig. 5, indicates a
located at position 1 on spectra D and E. Raman spectra obtained from composition of nickel, sodium, and oxygen in the oxide layer with
samples UNS N06625GR2, UNS N06625GR1, and UNS N06025 are seen to smaller levels of iron and chromium. Sodium and oxygen content
be similar. A: UNS N06230; B: UNS N06025; C: UNS N06617; D: UNS decreased rapidly towards the bulk of the sample, whereas chro-
N06625GR1; E: UNS N06625GR2.
mium and nickel content increased; this result can also be seen in the
EDS map (supporting material Fig. S3). Niobium content decreased
violet, blue, gray, and gold. These colors can be seen with varying from the oxide layer into the bulk metal of the sample. Since these
presence on every tested sample. UNS N06230, UNS N06617, UNS surface films were formed after polarization studies, they should not
N06625GR1, and UNS N06625GR2 seem to have all four of these be considered as indicative of the long term behavior of the samples.
colors, while UNS N06025 was observed to have a gold colored The corrosion behavior of nickel in eutectic NaNO3:KNO3
oxide film. Thus, while the images show that all samples underwent mixtures has been studied previously, and it has been shown that
some level of tarnishing and film formation, the UNS N06625 nickel passivates with a nickel oxide layer that can still allow
samples (under both heat treatment conditions) appear to be visually transfer of Ni2+.47 Nickel-based alloys have also been shown to
least tarnished. develop layers formed primarily of nickel oxides.15,23,30,33,35,36 The
Micrographs of the sample surface obtained from secondary rhombohedral shape of the oxides seen in the SE-SEM images of the
electron microscopy show the morphology of the sample surface tested samples resembles similar SEM images of a nickel oxide that
before and after corrosion testing (Fig. 4). As all samples had similar developed on UNS N06690 exposed to pressurized water reactor
surface morphology prior to testing, one sample image has been simulated water.48 The crystallites also approximate those found on
provided to represent pre-testing morphology (Fig. 4F). The SE- UNS N06230 and UNS N06625 in an exposure experiment of the
SEM images show development of some oxide crystallites at 35kx same salt.17
magnification on the tested samples and are shown in Fig. 4. The XRD patterns obtained from the samples are shown in Fig. 6.
EDS scans at 4 k× magnification were performed on all samples Due to the brief exposure of the samples to the salt, the corrosion
with a general surface composition of nickel and chromium with layer was exceedingly thin. Thus, the XRD patterns of only the
small concentrations of other elements as provided in Table III. matrix of the sample were observed in each case and the XRD didJournal of The Electrochemical Society, 2021 168 021502
not detect the presence of a surface film, likely because the surface composition. The Raman results for UNS N06025 resemble the
film was very thin. Raman spectra for a mixed spinel primarily composed of
Raman spectrum from the surface of each exposed alloy is shown NiFexCr2−xO4 with a likely value of 0.4–1.2 for x.50
in Fig. 7. The results for the Raman spectra on UNS N06230 had Raman spectra for UNS N06625GR1 and UNS N06625GR2 are
features at 575 cm−1 and 700 cm−1 with the feature at 575 cm−1 similar with slight differences in feature intensities. A feature that
being considerably larger than the feature at 700 cm−1. These may correspond to niobium oxide was observed on Raman scans for
features may be representative of NiCr2O4, but the results for both UNS N06625GR1 and UNS N06625GR2 which is supported
UNS N06230 seem to be shifted by about 25 wave numbers from by the presence of Nb observed in EDS scans on these samples. The
the spectra for NiCr2O4 which has features at 550 cm−1 and presence of niobium in the oxide layer formed in this salt on alloys
675 cm−1.49,50 The Raman spectra for UNS N06617 exhibited similar in composition to UNS N06625 has been reported in tests
features at 550 cm−1 and 675 cm−1 which can be attributed to performed on this alloy in a simulated supercritical water reactor.51
NiCr2O4. The Raman spectra for UNS N06025 exhibits three clear Further investigations need to be performed to understand whether
features near 330, 470, and 710 cm−1 which corresponds fairly well Nb2O5 forms from the presence of oxygen at high temperatures and
to the Raman spectra for NiFe2O4.49–51 The Raman spectra for its effect on corrosion in this environment. It is unclear whether this
UNS N06625GR1 and UNS N06625GR2 both showed features oxide is resistant to corrosion or if it accelerates corrosion as a result
(700 cm−1, ∼580 cm−1) corresponding to NiFe2O4, but these of galvanic coupling as reported in literature on UNS N06625 in
samples also had a feature (700 cm−1) that could potentially be supercritical water.54 The EDS results for N06230 indicate the
attributed to Nb2O5.49,50,52,53 In conjunction with the EDS line scan formation of an oxide of an undetermined composition. It has been
shown in Fig. 5, it may be ascertained that Nb is present on the reported that tungsten forms oxides at high potentials (⩾1.3 V vs
surface of UNS N06625GR2, and that it may be present as Nb2O5. It Ag/Ag+) that were not reached in this experiment.55 Tungsten has
is unclear whether molybdenum is present in the oxide layer as none also been reported to dissolve and form tungstates in this
of the features observed in the Raman spectra correspond to oxides environment.35,56 Further studies into the corrosion layer of UNS
with molybdenum as part of their composition. The Raman spectra N06230 in this salt are required to better understand the influence of
for UNS N06025 corresponded well to previous results for NiFe2O4 tungsten on corrosion of the samples. The iron concentration is
with several matching features.49–51 indicative of an iron-nickel-chromium oxide forming on the surface.
Raman spectroscopy results indicate a mixed Ni-Fe-Cr oxide Aluminum and chromium in UNS N06025 have been reported to
present on every tested sample with varying compositions. It is prevent metal dusting corrosion through the formation of
reported that mixed metal oxides such as nickel-iron-chromium corundum.57 Corundum was not observed in the Raman spectro-
oxide will have varying features due to specific metal cations scopy data for this sample which may be attributed to the thinness of
occupying certain sites in the lattice.50 The position of features the oxide layer. The EDS data for UNS N06617 indicate small
and their relative intensity can change from varying levels of iron amounts of cobalt, molybdenum, and oxygen. Cobalt has been
and chromium and their position in the lattice which influences the reported to prevent wear corrosion and erosion-corrosion in chro-
Raman shift. For UNS N06230, the presence of a layer made up of mium-nickel alloys, but has not been reported to prevent corrosion in
mostly nickel oxide is indicated by the main feature at about nitrate salts.58 Cobalt has been reported to be selectively leached
500 cm−1.49 The formation of an oxide layer mainly composed of from alloys similar to UNS N06617 in NaNO3:KNO3 salt at
nickel oxide on UNS N06230 in this nitrate salt is reported in 600 °C.59 Molybdenum has been reported to ionize and form
literature.17 It is possible that chromium and iron are present in the molybdates in this environment.56 As discussed later, the presence
initial oxide layer causing the formation of these secondary features of chromium was also confirmed by its identification in the XPS and
and the similarity to spectra for a mixed NiFexCr2−xO4 spinel.50 The EDS data on all samples, and this is likely a result of chromium
Raman spectra for UNS N06617 closely resembles that of UNS forming a spinel with nickel and iron. While it was not observed in
N06230 which likely indicates an oxide layer with a similar the alloys studied here, the presence of molybdenum has been
Figure 8. Stacked XPS survey scan spectra are shown for the two samples of alloy UNS N06625 with spectrum E obtained from GR2 and spectrum D obtained
from GR1 samples. A survey scan from UNS N06230 (spectrum A) is also shown for comparison. The most intense lines from the elements are labeled.Journal of The Electrochemical Society, 2021 168 021502
reported to accelerate intergranular corrosion in austenitic steels in a
similar salt environment.60 It has been suggested that stainless steels
may undergo intergranular corrosion due to sensitization in
molten nitrate salts and intergranular cracking has been observed in
UNS N06625 during extension testing in the nitrate salt
environment.34–36,61 The alloys tested were high-chromium, nickel-
based alloys that may have undergone sensitization of chromium
caused by the temperature at which the study was conducted. It is well
known that chromium forms carbides at grain boundaries at tempera-
tures as low as 450 °C; the formation of chromium carbides leads to
depleted chromium in the areas adjacent to the grain boundary.62–64
These chromium depleted regions lead to intergranular corrosion. Due
to the short duration of the test, it is unlikely that intergranular
corrosion can be directly observed. However, chromium has been
reported to be soluble as a chromate ion in this nitrate salt which can
yield to dissolution of chromium into the salt.14,26 While the salt was
not tested in the current study, previous studies by this research group
conducted in the same environment has shown dissolution of Cr into
the salt from Cr containing alloys, including UNS S31600 and UNS
N0881026 in agreement with other results.14 Further studies with
longer exposures are required to yield evidence of intergranular
corrosion in these alloy samples.
A study conducted on the corrosion performance of UNS N06230
in a binary nitrate salt showed that it formed an outer layer of nickel
oxide with 5 at.% sodium, and beneath this layer, another oxide layer
with a significantly higher concentration of nickel was present.17
This inner layer of nickel oxide exhibited uniform corrosion by
oxidation, which may explain the stable corrosion behavior of UNS
N06230 in these experiments. In addition, one study conducted on
the corrosion performance of UNS N06617 in the same salt mix
showed that this alloy suffered pitting, chromium dissolution, and
oxidation at the pitted region.59 It was also suspected by the study
that chromium nitride formed under low oxygen partial pressure.
The same study also reported that high-chromium alloys can form
K2CrO4 along the grain boundaries, indicating intergranular corro-
sion in high-chromium, nickel-based alloys. The presence of
potassium in small concentrations was indicated in the EDS scans
performed on the samples, but no evidence of this compound was
indicated through Raman analysis. In high-chromium steels like
UNS S31600, chromium forms carbides during sensitization.62 This
process is less determined by the salt mixture and more dependent
on the high temperature environment related with these types of
corrosion tests.34 This phenomenon does lead to enhanced corrosion
as discussed earlier. The study conducted on UNS N06625 showed
development of an oxide layer primarily composed of nickel,
oxygen, and iron, with small amounts of sodium present.36 This is
similar to the results obtained from EDS scans conducted on UNS
N06625GR1 and UNS N06625GR2. The aforementioned study on
UNS N06625 also proposed that this alloy exhibits scale dissolution
in the salt environment during polarization, but the study also
reported lower level of corrosion compared to stainless steels and
ferritic steels. This is contrary to the polarization curve data
observed for UNS N06625GR1 and UNS N06625GR2 which
indicates these samples did not undergo passivation during the
polarization tests. However, as discussed earlier the sample does
show pseudo passivation and thus has the ability to form a more
protective oxide film with time. It is unknown what role aluminum
and niobium play in the corrosion behavior of these alloys in the
molten nitrate salt.
XPS spectra obtained from UNS N06625GR1, UNS
N06625GR2, and UNS N06230 after 1 min of Ar+ sputtering are
shown in Fig. 8. As can be seen, both UNS N06625GR1 and UNS
Figure 9. Peak-fitted XPS O1s spectra obtained from the same three N06625GR2, show a much higher ratio of O to Ni compared to UNS
samples in Fig. 6 namely, UNS N06230 (A, bottom), UNS N06625GR1 N06230. This is again indicative of a thicker or more complete oxide
(D, center), and UNS N06625GR2 (E, top) are shown. Peaks labeled x, y and film formed on UNS N06625GR1 and UNS N06625GR2 compared
z refer to contributions to the O1s spectrum from oxide, hydroxide and water. to UNS N06230. Furthermore, the O1s spectra obtained from the
Both samples of alloy UNS N06625 have less hydrated surface films. three samples were peak-fit and are shown in Fig. 9. It can be easilyJournal of The Electrochemical Society, 2021 168 021502
seen that the oxygen signal is very noisy on UNS N06230 further 3. Environmental Protection Agency, (2020), Inventory of U.S. Greenhouse gas
indicative of the thinner film. Peak-fit shows that the UNS N06230 emissions and sinks: 1990-2018 https://www.epa.gov/ghgemissions/inventory-us-
greenhouse-gas-emissions-and-sinks-1990-2018.
surface consists of a significant amount of hydroxide and adsorbed 4. A. G. Fernández, J. Gomez-Vidal, E. Oró, A. Kruizenga, A. Solé, and L. F. Cabeza,
water. In comparison, both UNS N06625GR1, UNS N06625GR2 Renewable Energy, 140, 152 (2019).
surfaces consist primarily of oxide and much smaller amounts of 5. M. Medrano, A. Gil, I. Martorell, X. Potau, and L. F. Cabeza, Renewable
hydroxide and almost negligible absorbed water. Hydration levels of Sustainable Energy Rev., 14, 56 (2010).
6. T. Bauer, N. Pfleger, N. Breidenbach, M. Eck, D. Laing, and S. Kaesche, Appl.
a surface film is known to change65 and also affect the corrosion Energy, 111, 1114 (2013).
behavior.66,67 Deprotonation of such films may occur leading to the 7. E. González-Roubaud, D. Pérez-Osorio, and C. Prieto, Renewable Sustainable
formation of an inner oxide film and a more hydrated outer gel-like Energy Rev., 80, 133 (2017).
film that have different ion selectivity.68,69 Such a bipolar behavior 8. V. M. B. Nunes, C. S. Queirós, M. J. V. Lourenço, F. J. V. Santos, and C. A. Nieto
de Castro, Appl. Energy, 183, 603 (2016).
has been described on iron,68,69 stainless steels,70–72 and aluminum 9. R. W. Carling and R. W. Mar, “Industrial use of molten nitrate/nitrite salts.” Energy
alloys.67,73 It is hypothesized that such a bipolar behavior might Report, Sandia Report SAND81-8020 (Sandia National Laboratories, Albequerque,
occur on the surfaces of UNS N06625GR1 and UNS N06625GR2 as NM) (1981).
well, as they are Ni-Cr alloys. If such a behavior were to occur, it 10. K. M. P. Rao and K. N. Prabhu, Metallurgical and materials transactions. A,
Physical metallurgy and materials science, 48, 4895 (2017).
would explain the stronger oxide film observed upon sputtering 11. G. P. Dubal, “The basics of molten salt quenchants.” Heat Treating Progress (ASM
(inner film) compared to hydrated film. This would also help explain International, United States of America) p. 81 (2003), https://www.asminterna-
the pseudopassive behavior observed in these alloys. In a study done tional.org/documents/10192/1909623/htp00305p081.pdf/95816305-0147-4546-
on the long-term corrosion resistance of UNS N06625, a protective 8db6-4735a0aa3627.
12. M. Galopin and J. S. Daniel, “Molten salts in metal treating: Present uses and future
oxide film composed primarily of nickel, oxygen, and iron was trends.” Electrodeposition and Surface Treatment, 3, 31 (1975).
formed which corresponds well to the observed Raman spectra of 13. J. T. Moon, E. J. Schindelholz, M. A. Melia, A. B. Kustas, and D. Chidambaram,
NiFe2O4 on UNS N06625GR1 and UNS N06625GR2.36 J. Electrochem. Soc., 167, 081509 (2020).
14. R. W. Bradshaw and R. W. Carling, Proceedings of The Electrochemical Society,
1987-7, 959 (1987).
Conclusions 15. R. Bäßler, O. Yevtushenko, and H. Hattendorf, “Suitability of High Alloyed
Accelerated electrochemical testing was conducted on several Materials in Molten Salts at 600 °C.” NACE International Corrosion Conference
Proceedings, Houston, 7363, p. 1 (2016).
alloys in a molten salt composed of a 3:2 by weight NaNO3:KNO3 16. K. Vignarooban, X. Xu, A. Arvay, K. Hsu, and A. M. Kannan, Appl. Energy, 146,
mixture. All tested samples had corrosion current densities on the 383 (2015).
order of 10−4 A cm−2. UNS N06230 ( Alloy 230) exhibited the 17. A. M. Kruizenga, D. D. Gill, M. Laford, and G. McConohy, “Corrosion of High
lowest average corrosion current density at 0.225 mA cm−2, and Temperature Alloys in Solar Salt at 400, 500, and 680°C.” Sandia Report Report
SAND2013-8256 (Sandia National Laboratories, Albequerque, NM) 1 (2013).
UNS N06625GR1 (VDM® Alloy 625 Grade 1) had the highest 18. P. F. Tortorelli, P. S. Bishop, and J. R. DiStefano, “Selection of corrosion-resistant
average corrosion current density at 0.431 mA cm−2. UNS materials for use in molten nitrate salts.” Report ORNL/TM-11162 (Oak Ridge
N06625GR2 (VDM® Alloy 625 Grade 2) had the highest range of National Laboratory, Oak Ridge, TN, USA) p. 62 (1989), https://www.osti.gov/
effective corrosion resistance based on the slope of the Tafel region. servlets/purl/5236321.
19. A. G. Fernández, M. I. Lasanta, and F. J. Pérez, Oxid. Met., 78, 329 (2012).
The corrosion current densities for all tested samples were higher 20. A. G. Fernández, A. Rey, I. Lasanta, S. Mato, M. P. Brady, F. J. Pérez, and
than that of UNS S31600 which may appear to be at odds with O. R. T. N. Oak, (2014), Ridge National LabMater. Corros., 65, 267.
research indicating that nickel-based, high-chromium alloys are 21. F. J. Ruiz-Cabañas, C. Prieto, R. Osuna, V. Madina, A. I. Fernández, and L. F. Cabeza,
more corrosion resistant in molten nitrate salt. However, the ability Sol. Energy Mater. Sol. Cells, 157, 383 (2016).
22. P. Audigié, V. Encinas-Sánchez, M. Juez-Lorenzo, S. Rodríguez, M. Gutiérrez,
to form long-term passive protective films in the nitrate salt was not F. J. Pérez, and A. Agüero, Surf. Coat. Technol., 349, 1148 (2018).
studied and it appears from the pseudopassive region that UNS 23. S. Khorsand, A. Sheikhi, K. Raeissi, and M. A. Golozar, Oxid. Met., 90, 169 (2018).
N06625GR1 may possess the ability to passivate. The corrosion 24. S. H. Goods and R. W. Bradshaw, J. Mater. Eng. Perform., 13, 78 (2004).
layer was too thin to be detected through XRD scan. The SE-SEM 25. I. B. Singh, Corros. Sci., 37, 1981 (1995).
26. K. L. Summers and D. Chidambaram, J. Electrochem. Soc., 164, H5357 (2017).
images show signs of a developing oxide layer at 35 k× magnifica- 27. J. G. Kim, Y. J. Yu, and J. K. Yoo, Met. Mater. Int., 11, 209 (2005).
tion on the samples that underwent potentiodynamic polarization. 28. A. J. Arvía, R. C. V. Piatti, and J. J. Podestá, Electrochim. Acta, 17, 901 (1972).
Raman spectra paired with XPS suggested the formation of various 29. S. L. Marchiano and A. J. Arvía, Electrochim. Acta, 17, 25 (1972).
nickel-chromium-iron oxides and the potential formation of niobium 30. G. McConohy and A. Kruizenga, Sol. Energy, 103, 242 (2014).
31. C. Oskay, T. M. Meißner, C. Dobler, B. Grégoire, and M. C. Galetz, Coatings, 9,
oxide on UNS N06625GR1 and UNS N06625GR2. These results 687 (2019).
compare well to results from other research, but the role and 32. A. G. Fernández, M. Cortes, E. Fuentealba, and F. J. Pérez, Renewable Energy, 80,
behavior of niobium in these samples requires further study to be 177 (2015).
properly understood. While accelerated testing shows that all of the 33. R. W. Bradshaw and S. H. Goods, “Corrosion of alloys and metals by molten
nitrates.” Sandia Report SAND2000-8727 (Sandia National Laboratories,
tested high nickel alloys performed at a similar level in nitrate salts, Albequerque, New Mexico) (2001).
further work is necessary to fully understand the long-term behavior 34. R. W. Bradshaw and S. H. Goods, “Corrosion resistance of stainless steels during
in this environment, especially to understand their ability to thermal cycling in alkali nitrate.” Sandia Report SAND2001-8518 (Sandia National
passivate. Laboratories, Albequerque, New Mexico) p. 1 (2001).
35. A. M. Kruizenga, D. D. Gill, M. Laford, and G. McConohy, “Materials corrosion of
high temperature alloys immersed in 600C binary nitrate salt.” Sandia Report
Acknowledgments SAND2013-2526 (Sandia National Laboratories, Albequerque, New Mexico) 1
(2013).
We thank Kodi Summers at the University of Nevada, Reno for 36. A. Soleimani Dorcheh, R. N. Durham, and M. C. Galetz, Sol. Energy Mater. Sol.
technical discussions. This study was funded in part by VDM Metals Cells, 144, 109 (2016).
USA and by Materials Characterization Nevada (MCNV) at the 37. A. S. Dorcheh and M. C. Galetz, Sol. Energy Mater. Sol. Cells, 146, 8 (2016).
38. J. Liang, H. Li, D. Huo, H. Yan, R. G. Reddy, L. Wang, and L. Wang, Ionics, 24,
University of Nevada, Reno. 3221 (2018).
39. J. I. Barraza-Fierro, M. A. Espinosa-Medina, and H. Castaneda, Metall. Mater.
ORCID Trans. B, 46, 2593 (2015).
40. J. Híveš, M. Benová, K. Bouzek, and V. K. Sharma, Electrochem. Commun., 8,
Dev Chidambaram https://orcid.org/0000-0002-3918-3559 1737 (2006).
41. B. Wang, L. Xu, J. Zhu, H. Xiao, and M. Lu, Corros. Sci., 111, 711 (2016).
References 42. N. Mundhenk, K. G. Knauss, S. R. S. Bandaru, R. Wonneberger, T. M. Devine, and
B. C. A. Lawrence, (2019), Berkeley National LabThe Science of the total
1. OECD, “Towards green growth? tracking progress.” OECD Green Growth Studies environment, 677, 307.
(OECD, Paris) (2015), https://read.oecd-ilibrary.org/environment/towards-green- 43. J. C. Gomez-Vidal, Npj Materials degradation, 1, 1 (2017).
growth_9789264234437-en#page1 Towards green growth?tracking progress. 44. J. Wang, Y. Jiang, Y. Ni, A. Wu, and J. Li, Mater. Corros., 70, 102 (2019).
2. M. I. Qureshi, A. M. Rasli, U. Awan, J. Ma, G. Ali, A. A Faridullah, F. Sajjad, and 45. M. Zhu, S. Zeng, H. Zhang, J. Li, and B. Cao, Sol. Energy Mater. Sol. Cells, 186,
K. Zaman, Environ. Sci. Pollut. Res. Int., 22, 3467 (2014). 200 (2018).Journal of The Electrochemical Society, 2021 168 021502
46. V. Encinas-Sánchez, M. T. D. Miguel, M. I. Lasanta, G. García-Martín, and F. 59. M. Spiegel and J. Mentz, Mater. Corros., 65, 276 (2014).
J. Pérez, Sol. Energy Mater. Sol. Cells, 191, 157 (2019). 60. W. Wang, B. Guan, X. Li, J. Lu, and J. Ding, Sol. Energy Mater. Sol. Cells, 194, 36
47. A. Baraka, R. M. S. Baraka, and A. Abdel-Razik, Surf. Technol., 26, 199 (1985). (2019).
48. M. Sennour, L. Marchetti, F. Martin, S. Perrin, R. Molins, and M. Pijolat, J. Nucl. 61. S. H. Goods and R. W. Bradshaw, Corros. Sci., 41, 1119 (1999).
Mater., 402, 147 (2010). 62. T. M. Devine, Corros. Sci., 30, 135 (1990).
49. J. Kim, K. J. Choi, C. B. Bahn, and J. H. Kim, J. Nucl. Mater., 449, 181 (2014). 63. E. L. Hall and C. L. Briant, Metall. Trans. A, 15, 793 (1984).
50. B. D. Hosterman, “PhD Dissertation, Raman spectroscopic study of solid solution 64. R. K. Dayal, N. Parvathavarthini, and B. Raj, Int. Mater. Rev., 50, 129 (2005).
spinel oxides.” Physics, (University of Nevada, Las Vegas ) p. 144 (2011). 65. B. C. Bunker, G. C. Nelson, K. R. Zavadil, J. C. Barbour, F. D. Wall, J. P. Sullivan,
51. D. Rodriguez, A. Merwin, Z. Karmiol, and D. Chidambaram, Appl. Surf. Sci., 404, C. F. Windisch, M. H. Engelhardt, and D. R. Baer, J. Phys. Chem. B, 106, 4705 (2002).
443 (2017). 66. H. Chen, V. Maurice, L. H. Klein, L. Lapeire, K. Verbeken, H. Terryn, and
52. L. M. Marcondes, S. Maestri, B. Sousa, R. R. Gonçalves, F. C. Cassanjes, and G. P. Marcus, J. Solid State Electrochem., 19, 3501 (2015).
Y. Poirier, J. Am. Ceram. Soc., 101, 220 (2018). 67. D. Chidambaram, C. R. Clayton, and G. P. Halada, J. Electrochem. Soc., 150, B224
53. Y. Wang, S. Aghamohammadi, D. Li, K. Li, and R. Farrauto, Applied catalysis. B, (2003).
Environmental, 244, 438 (2019). 68. M. Sakashita and N. Sato, Corros. Sci., 17, 473 (1977).
54. X. Ren, K. Sridharan, and T. R. Allen, Corrosion, 63, 603 (2007). 69. M. Sakashita and N. Sato, Corrosion, 35, 351 (1979).
55. L. Sabbatini, J. Electrochem. Soc., 130, 2199 (1983). 70. C. R. Clayton and Y. C. Lu, J. Electrochem. Soc., 133, 2465 (1986).
56. P. Afanasiev and D. H. Kerridge, J. Alloys Compd., 322, 97 (2001). 71. Y. C. Lu, C. R. Clayton, and A. R. Brooks, Corros. Sci., 29, 863 (1989).
57. J. Z. Albertsen, Ø. Grong, R. H. Mathiesen, and B. Schmid, Corrosion engineering, 72. Y. C. Lu and C. R. Clayton, Corros. Sci., 29, 927 (1989).
science, and technology, 40, 239 (2005). 73. D. Chidambaram, C. R. Clayton, and G. P. Halada, J. Electrochem. Soc., 151, B151
58. Y. Birol, Wear, 269, 664 (2010). (2004).You can also read