Towards parameterising atmospheric concentrations of ice-nucleating particles active at moderate supercooling
←
→
Page content transcription
If your browser does not render page correctly, please read the page content below
Atmos. Chem. Phys., 21, 657–664, 2021
https://doi.org/10.5194/acp-21-657-2021
© Author(s) 2021. This work is distributed under
the Creative Commons Attribution 4.0 License.

Towards parameterising atmospheric concentrations of
ice-nucleating particles active at moderate supercooling
Claudia Mignani1 , Jörg Wieder2 , Michael A. Sprenger2 , Zamin A. Kanji2 , Jan Henneberger2 , Christine Alewell1 , and
Franz Conen1
1 Department      of Environmental Sciences, University of Basel, Bernoullistrasse 30, 4056 Basel, Switzerland
2 Institute   for Atmospheric and Climate Science, ETH Zurich, Universitätstrasse 16, 8092 Zurich, Switzerland

Correspondence: Claudia Mignani (claudia.mignani@unibas.ch), and Franz Conen (franz.conen@unibas.ch)

Received: 28 May 2020 – Discussion started: 22 June 2020
Revised: 23 November 2020 – Accepted: 23 November 2020 – Published: 18 January 2021

Abstract. A small fraction of freezing cloud droplets prob-        DeMott et al., 2010; Phillips et al., 2013; DeMott et al.,
ably initiates much of the precipitation above continents.         2015). A current empirical parameterisation established by
Only a minute fraction of aerosol particles, so-called ice-        DeMott et al. (2015), hereafter D15, predicts [INP] based on
nucleating particles (INPs), can trigger initial ice forma-        the nucleation temperature and number concentration of min-
tion at −15 ◦ C, at which cloud-top temperatures are fre-          eral dust particles with diameters > 0.5 µm ([n0.5 ]) (DeMott
quently associated with snowfall. At a mountaintop site in         et al., 2015). Although D15 may be applicable to tempera-
the Swiss Alps, we found that concentrations of INPs ac-           tures below −20 ◦ C, it is not expected to represent a multi-
tive at −15 ◦ C can be parameterised by different functions        variate INP population and remains “weakly constrained at
of coarse (> 2 µm) aerosol particle concentrations, depend-        temperatures > −20 ◦ C, where much additional ambient and
ing on whether an air mass is (a) precipitating, (b) non-          laboratory data are needed” (DeMott et al., 2015).
precipitating, or (c) carrying a substantial fraction of dust         The coldest part of a cloud – typically cloud tops and their
particles while non-precipitating. Consequently, we suggest        temperature – determines what fraction of the INP population
that a parameterisation at moderate supercooling should con-       will get activated and form ice crystals. Any INPs with colder
sider coarse particles in combination with air mass differen-      activation temperatures will remain inactive. Cloud-top tem-
tiation.                                                           peratures associated with winter snowfall have a primary
                                                                   temperature mode near −15 ◦ C, as derived from close to 105
                                                                   parallel observations of cloud-top temperatures and falling
                                                                   solid precipitation throughout the United States (Hanna et al.,
1   Introduction                                                   2008). The majority of these observations were for light
                                                                   snowfall. In contrast, cloud-top temperature distributions for
The presence of ice in clouds is important for precipitation       moderate and heavy snowfall are bimodal, with a second mi-
initiation (Mülmenstädt et al., 2015; Heymsfield et al., 2020).    nor mode around −40 ◦ C (Hanna et al., 2008). This is con-
Ice-nucleating particles (INPs) affect clouds and their devel-     sistent with observations in mountainous regions (Rauber,
opment by generating primary ice at temperatures between           1987). Of all snowfall observations with cloud tops above
0 and −38 ◦ C. The difficulty of understanding and thus pre-       homogeneous freezing temperature (i.e. > −38 ◦ C), approx-
dicting the atmospheric INP concentration ([INP]) originates       imately 30 % are associated with cloud-top temperatures not
from observational challenges related to field measurement         colder than −15 ◦ C (Hanna et al., 2008). Therefore, substan-
techniques (Cziczo et al., 2017), the large variety of poten-      tial fractions of initial ice crystals in snow-producing mixed-
tial sources (Kanji et al., 2017), and the wide range in at-       phase clouds may be caused by INPs that nucleate ice at tem-
mospheric abundances from 10−6 to 103 L−1 (Petters and             peratures ≥ −15 ◦ C (INPs−15 ). This inference may extend to
Wright, 2015). The past decade has seen substantial efforts        other midlatitude continental regions. Considering −15 ◦ C to
toward improving empirical parameterisations of [INP] (e.g.

Published by Copernicus Publications on behalf of the European Geosciences Union.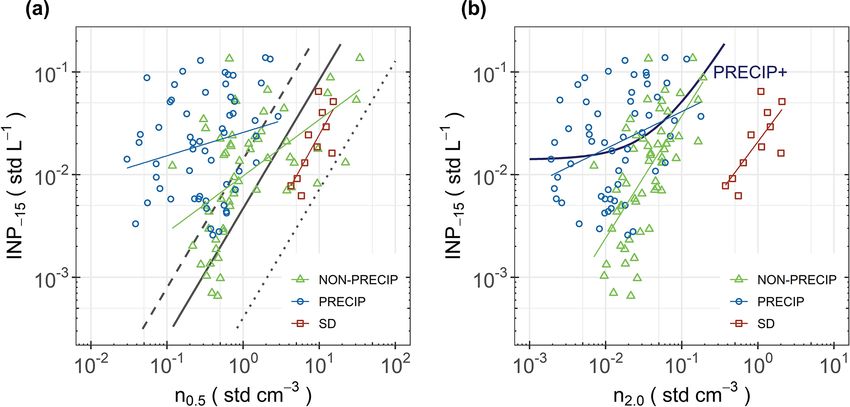
658                                    C. Mignani et al.: Towards parameterising atmospheric concentrations of INPs−15

be a temperature that is important for snow formation also        minium inlet tubing had an inner diameter of 4.5 cm through-
makes physical sense because maximum depositional growth          out its total length of 7 m. Particles entering the inlet travelled
of ice crystals is around −15 ◦ C (Rogers and Yau, 1989).         at a speed of about 3 m s−1 first 2.5 m downward, then turned
In this work, we therefore focus on INPs active at that tem-      by 70◦ in a radius of 20 cm towards the inside of the lab-
perature, although future studies would benefit from relating     oratory and continued for another 4.5 m about 20◦ downs-
measurements to overall cloud thermal structures, which may       lope before being trapped in the impinger, approximately
at times include lower cloud-top temperatures.                    2.2 s after they had entered the inlet. Ice particles resus-
   Based on current understanding, atmospheric INPs−15 are        pended from surrounding surfaces (snow-covered through-
mostly biological aerosol particles (Murray et al., 2012). Al-    out the campaign and with an average local wind speed of
though their number concentration is generally smaller com-       7.1 (standard deviation ± 3.4) m s−1 during sampling inter-
pared to those < −15 ◦ C (Petters and Wright, 2015), pri-         vals) cannot be ruled out but are unlikely to contribute signif-
mary ice formed by INPs−15 may get multiplied by an or-           icant amounts to the total sampled particles. The airflow was
der of magnitude due to secondary ice formation (Mignani          maintained throughout the campaign at 300 L min−1 , during
et al., 2019). Findings from a sparse number of size-resolved     sampling by a high-flow-rate impinger (Bertin Technologies,
measurements of atmospheric INPs show that INPs−15 are            Coriolis®µ) and between sampling intervals by a makeup
mostly > 2 µm in diameter (Huffman et al., 2013; Mason            flow using an external blower. In addition, an aerodynamic
et al., 2016; Creamean et al., 2018). This particle size, how-    particle sizer (APS; model 3321, TSI Corporation) sampled
ever, is under-represented for instrumental reasons in the em-    from the same inlet upstream of the impinger at 1 L min−1 .
pirical data on which D15 and other parameterisations (e.g.          Aerosol samples were collected using the Coriolis®µ as
DeMott et al., 2010; Phillips et al., 2013) are based. Further-   was done in recent studies (Els et al., 2019; Tarn et al., 2020;
more, an increase in atmospheric abundance of INPs active         Miller et al., 2020). Each sample consisted of aerosol parti-
at moderate supercooling has been observed during precip-         cles collected throughout 20 min (i.e. from 6 m3 of air) into
itation (Bigg and Miles, 1964; Huffman et al., 2013; Hara         15 mL of ultra-pure water (Sigma-Aldrich, W4502-1L). With
et al., 2016; Conen et al., 2017). This might be explained        increasing particle size the theoretical sampling efficiency
by aerosolisation of INPs by rain itself, a mechanism simi-       of the Coriolis®µ increases from around 50 % for particles
lar to the generation of bioaerosol by raindrop impingement       of 0.5 µm in size and 80 % for particles of 2.0 µm to close
(Joung et al., 2017), which is probably dependent on various      to 100 % for particles of 10 µm (personal communication
parameters like surface wetness or land cover.                    with Bertin Technologies). Water losses due to evaporation
   To test whether the general approach of D15 (i.e. param-       were compensated for by replenishing the circulating water
eterising INPs as a function of particles larger than a cer-      after 10 and 20 min. To avoid storage effects (Beall et al.,
tain size) can be reconciled with the findings of INPs−15 be-     2020), samples were analysed immediately after collection
ing mostly larger than > 2.0 µm and increasing during pre-        in a drop-freezing assay with 52 droplets of 100 µL each,
cipitation, we collected and analysed aerosol samples from        as previously described (Stopelli et al., 2014), and cumula-
February to March 2019 on Weissfluhjoch, Switzerland, at          tive [INP] was calculated (Vali, 1971). Sampling and anal-
an average local air temperature of −7.1 (standard deviation      ysis were designed in such a way that expected [INP−15 ]
± 4.3) ◦ C during sampling intervals (Fig. S1). The site, sur-    of each sample would be well within the detection lim-
rounding mountains, and nearby valleys were snow-covered,         its, meaning that several but not all droplets in the assay
while most of the lower-lying plain and the foothill regions      would be frozen. With our sampling and analysis design
were not, and precipitation occurred in the form of rain in       the detection range lies between 4.8 × 10⁻⁴ (i.e. first drop
those regions during our study period.                            frozen) and 8.1 × 10⁻² L−1 (i.e. second to last drop frozen).
                                                                  In 15 samples, all droplets were frozen and in one sample
                                                                  no droplet was frozen at −15 ◦ C. These samples were not
2   Material and method                                           considered because their [INP−15 ] was outside the detection
                                                                  limits. For the other samples (n = 124) several, but not all,
Between 11 February and 26 March 2019, we collected               droplets froze. Background measurements (n = 15) follow-
and analysed a total of 140 aerosol samples at Weiss-             ing an identical procedure as with the samples, but without
fluhjoch, Switzerland (46◦ 490 58.67000 N, 9◦ 480 23.30900 E;     turning on the airflow of the impinger, were below the detec-
2671 m a.s.l.), during the “Role of Aerosols and Clouds En-       tion limit. Number concentrations of particles [n] with aero-
hanced by Topography on Snow (RACLETS)” campaign.                 dynamic diameters from 0.5 to 20 µm were measured with
Total aerosol was sampled through a heated inlet (heating el-     the APS (20 s scanning time) and were integrated (summed)
ement kept at +46 ◦ C) similar to the one described in Wein-      from the particles sizes of interest onward, i.e. ≥ 0.542 µm
gartner et al. (1999), which was designed such that particles     for [n0.5 ] (51 bins) and ≥ 1.982 µm for [n2.0 ] (33 bins). The
with diameters < 40 µm are sampled up to a wind speed of          20 s data were averaged over each time period (20 min) of
20 m s−1 . The inlet extended through the eastern wall of the     the impinger-based aerosol samples taken. [n0.5 ], [n2.0 ], and
laboratory and was about 8 m above local ground. The alu-         [INP−15 ] were adjusted to standard pressure conditions (std;

Atmos. Chem. Phys., 21, 657–664, 2021                                                 https://doi.org/10.5194/acp-21-657-2021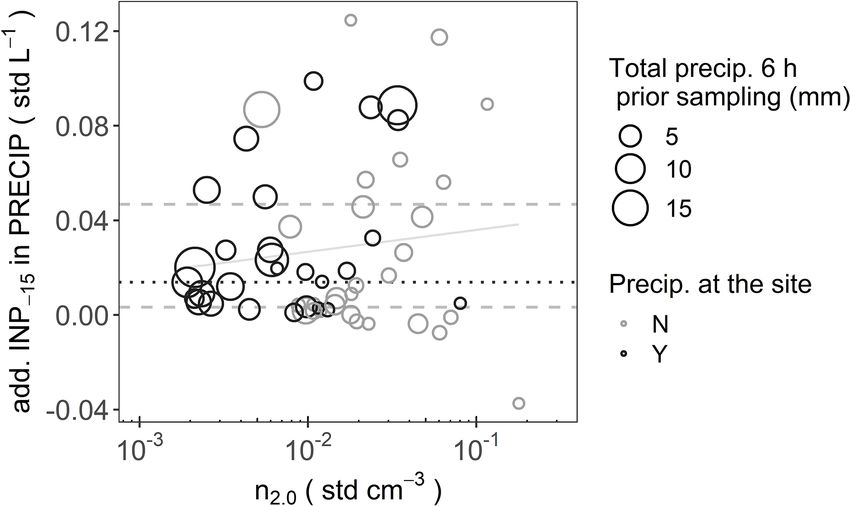
C. Mignani et al.: Towards parameterising atmospheric concentrations of INPs−15 659
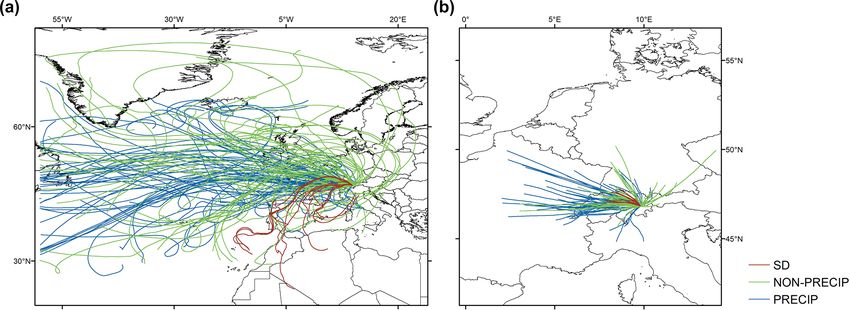
Figure 1. (a) 5 d and (b) 6 h back trajectories of air masses that were precipitating (PRECIP, blue), non-precipitating (NON-PRECIP, green),
and carrying a substantial fraction of Saharan dust while non-precipitating (SD, red).
pref = 1013.25 hPa). [INP−15 ] estimates based on D15 were 2015). For each sample, one trajectory was started at the full
calculated as hour closest to the sampling time and from the exact sam-
pling position. The driving wind fields were taken from the
INPT = CF · n0.5 β · eγ ·(−T )+δ , (1) operational analysis of the Swiss National Weather Service
where β = 1.25, γ = 0.46, δ = −11.6, T is the temperature (COSMO1; https://www.meteoswiss.admin.ch/home.html?
in degrees Celsius, INPT the ice nucleation particle concen- tab=overview, last access: 7 January 2021) and the European
tration (STP L−1 ) at T , and n0.5 the number concentration Centre for Medium-Range Weather Forecasts (ECMWF;
of aerosol predominantly consisting of mineral dust particles https://www.ecmwf.int/, last access: 7 January 2021). Started
with a physical diameter > 0.5 µm (STP cm−3 ). A physical in the COSMO domain, the trajectories were extended based
diameter of 0.5 µm is equivalent to an aerodynamic diameter on ECMWF data at the time and location where they leave
of 0.9 µm, assuming a particle density of 2.6 g cm−2 and a this domain. Their position was saved every 10 min. Along
shape factor of 1.3 (Raabe, 1976), which are typical values the trajectories, total precipitation was traced amongst others
for mineral dust particles. Similar transformations for obser- (i.e. height, pressure, temperature, specific humidity, and sur-
vations not dominated by mineral dust would require infor- face height), enabling us to determine the total precipitation
mation about the densities and shapes of the main compo- amount along the last 6 h prior to sampling (Fig. S2).
nents of sampled particle populations, which were not avail-
able for our site and would require unsupported assumptions.
Therefore, we chose to show for all our observations the di- 3 Results and discussion
rectly measured particle concentrations in terms of aerody-
namic diameter. To use the D15 parameterisation in our con- We found cumulative concentrations of atmospheric INPs ac-
text, we corrected predicted [INP] for the difference between tive at −15 ◦ C ([INP−15 ]) that are lying within the lower
the aerodynamic diameter measured and the physical diam- half of values summarised in Petters and Wright (2015).
eter used in Eq. (1) by multiplying n0.5 in Eq. (1) by the ra- From the total of 124 impinger-based aerosol samples with
tio of particles with aerodynamic diameter > 0.9 µm (equiv- quantified [INP−15 ], about half (56) were collected from
alent to 0.5 µm physical diameter) to particles with aerody- air masses that had precipitated at least 1.0 mm during the
namic diameters > 0.5 µm, which we observed in Saharan- 6 h prior to sampling (defined as “precipitating”). About
dust-dominated air masses during our campaign. The aver- half of these air masses were also precipitating when sam-
age value of this ratio was 0.59. The calibration factor (CF) pled at Weissfluhjoch, as observed by a precipitation gauge.
accounts for so-called instrument-specific calibration and is A similar number of samples (57) was from air masses
suggested to be 3 (CF = 3) to predict maximum immersion- with less or no prior precipitation (“non-precipitating”),
mode atmospheric [INP] (DeMott et al., 2015). Schrod et al. and 11 were from air masses including a substantial frac-
(2017), who collected samples with an unmanned aircraft tion of Saharan dust (SD) and no prior precipitation. Air
system in the Mediterranean region with substantial Saharan masses mainly reached the sampling position from the west
dust influence, used it as a mathematical degree of freedom (Fig. 1a). Precipitating air masses came on a rather direct
when fitting Eq. (1) to their observations. path from the Atlantic, crossing the west of Europe with
The 5 d back trajectories were calculated using the La- fewer detours than non-precipitating air masses, whereas air
grangian analysis tool LAGRANTO (Sprenger and Wernli, masses carrying dust came from the direction of the Sahara,
https://doi.org/10.5194/acp-21-657-2021 Atmos. Chem. Phys., 21, 657–664, 2021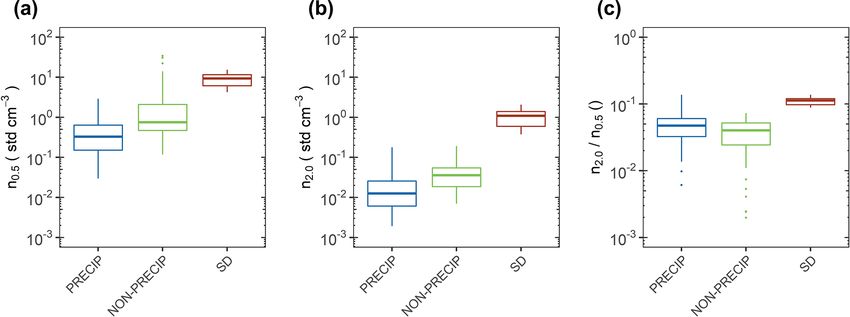
660                                         C. Mignani et al.: Towards parameterising atmospheric concentrations of INPs−15

passing the south of Europe. Considering 6 h before arriv-                Table 1. Equations of the functions shown in Fig. 3 (i.e. PRE-
ing at Weissfluhjoch, the trajectories crossed a mean dis-                CIP, PRECIP+, NON-PRECIP, SD) predicting cumulative concen-
tance of 242 (standard deviation ± 145) km and spent two-                 trations of ice-nucleating particles active at −15 ◦ C [INP−15 ] based
thirds of the time over Switzerland (Fig. 1b). Forested land              on aerosol particles with aerodynamic diameters > 0.5 µm [n0.5 ]
(31 %), agricultural fields (17 %), pasture (12 %), and natural           and > 2.0 µm [n2.0 ] along with their respective R 2 values. In addi-
                                                                          tion, equations and R 2 values of power functions fitted to all data
grasslands (12 %) were the most common land cover types
                                                                          points irrespective of air mass classes are shown (ALL). The equa-
they passed, as derived by the European Copernicus pro-                   tions are listed based on the following formula: y = b · x a + c, with
gramme’s Corine land cover map (https://land.copernicus.eu/               y equal to [INP−15 ].
pan-european/corine-land-cover/clc2018, last access: 13 Oc-
tober 2020).                                                               Air mass type        n         x        b       a        c     R2
   Precipitating air masses had the lowest [n0.5 ] and the low-
est concentration of aerosol particles with diameters > 2 µm               ALL                124    [n0.5 ]    0.02    0.19        0    0.06
([n2.0 ]) but similar ratios as non-precipitating air masses of            PRECIP              56    [n0.5 ]    0.03    0.23        0    0.05
                                                                           NON-PRECIP          57    [n0.5 ]    0.01    0.55        0    0.29
[n2.0 ] to [n0.5 ] (Fig. 2a–b). The largest ratio of [n2.0 ] to [n0.5 ]
                                                                           SD                  11    [n0.5 ]   0.001    1.34        0    0.55
was in SD air masses (Fig. 2c). Therefore, relative differ-
ences in measured [INP−15 ] between precipitating and non-                 ALL                124    [n2.0 ]    0.03    0.22       0     0.07
precipitating air masses would be affected very little if a                PRECIP              56    [n2.0 ]    0.09    0.36       0     0.12
substantial fraction of INPs−15 were of a size near 0.5 µm,                PRECIP+             56    [n2.0 ]    0.58    1.19   0.014     0.14
                                                                           NON-PRECIP          57    [n2.0 ]    0.58    1.19       0     0.44
which was sampled with a lower efficiency (50 %) than 2 µm
                                                                           SD                  11    [n2.0 ]    0.02    0.99       0     0.55
(80 %). However, [INP−15 ] in both of these air masses would
have been underestimated relative to [INP−15 ] in SD-affected
air masses, which had the highest [n2.0 ] to [n0.5 ] ratio.
   In general, [INP−15 ] in non-precipitating and precipitating           precipitating air masses by adding a constant to the func-
(not dominated by mineral dust) air masses was higher than                tion fitted to the non-precipitating cases (Fig. 3b). The me-
in mineral-dust-dominated air masses for the same [n0.5 ]                 dian difference between the function of non-precipitating air
(Fig. 3a). The observed slope for SD air masses was the same              masses and measured [INP−15 ] in precipitating air masses
as that predicted by the D15 parameterisation. The offset of              was 0.014 std L−1 (Fig. 4). The relationship between these
the D15 curve depends on the calibration factor (see Eq. 1).              differences and [n2.0 ] was weakly positive and not signifi-
Observed SD data were between the D15 curves with the CF                  cant, meaning that the absolute value of additional INPs in
set to 1 and to 0.086, respectively. The latter value is reported         precipitating air masses was independent of [n2.0 ]. This find-
in Schrod et al. (2017), who sampled the Saharan dust layer               ing corroborates our assumption that additional INPs dur-
above Cyprus with a drone up to 2850 m a.s.l.                             ing precipitating air masses are independent of background
   Considering the fact that the observed size of INP−15 is               [n]. A consequence of our finding is that for precipitating
mostly larger than 2 µm (Huffman et al., 2013; Mason et al.,              air masses with low [n2.0 ], the addition of INPs aerosolised
2016; Creamean et al., 2018), we plot measured [INP−15 ]                  by precipitation makes a relatively large contribution to the
against [n2.0 ] instead of [n0.5 ], resulting in a more distinct          overall [INP−15 ]. The additional INPs during precipitation
separation of the data to the different air masses (Fig. 3b).             could be emitted through the impact of rain on snow-free
In each of the three categories of air masses, [INP−15 ] can              lower-lying plain regions, a speculation which needs to be
be described as a function of [n2.0 ] that is valid for a range           investigated in future.
of [INP−15 ] from 0.0006 to 0.14 std L−1 (Table 1). For data                 Overall, for each air mass class, the correlation coefficient
in SD and non-precipitating air masses, [INP−15 ] can be                  of the obtained functions is the same or higher with [n2.0 ]
described as power functions of [n2.0 ], with similar linear              as a predictor than with [n0.5 ] (Table 1). This confirms that
slopes on a log–log plot but lower [INP−15 ] per [n2.0 ] for SD.          [n2.0 ] is a more powerful predictor of INPs−15 than [n0.5 ]
This goes hand in hand with the earlier observations that air             when combined with air mass differentiation (Fig. S3). It
masses influenced by SD carry fewer INPs active at moderate               underlines the importance of considering aerosol particles
supercooling per unit mass of aerosol particles than European             > 2 µm. To further develop a parameterisation valid for tem-
background air masses (Conen et al., 2015). In precipitating              peratures > −20 ◦ C, we suggest further investigating the pre-
air masses, the ratio between [INP−15 ] and [n2.0 ] was usu-              sented functions because INPs active at other temperatures
ally larger than in non-precipitating air masses. This reveals            or at other locations and during different seasons may also
that the aerosol population was enriched with INPs active at              be associated with other particle sizes or other INP concen-
moderate supercooling during precipitation, consistent with               trations. The addition of INPs in precipitating air masses,
previous findings (Bigg and Miles, 1964; Huffman et al.,                  in particular, should be constrained with data from all over
2013). Since additional INPs during precipitation might be                the globe.
due to aerosolisation of INPs by rain, which is likely inde-
pendent of the background in [n], we describe [INP−15 ] in

Atmos. Chem. Phys., 21, 657–664, 2021                                                          https://doi.org/10.5194/acp-21-657-2021
C. Mignani et al.: Towards parameterising atmospheric concentrations of INPs−15 661
Figure 2. Number concentrations of aerosol particles with aerodynamic diameters (a) > 0.5 µm [n0.5 ] and (b) > 2.0 µm [n2.0 ] along with
(c) their ratio for the aerosol populations of PRECIP, NON-PRECIP, and SD air masses.
Figure 3. Cumulative concentrations of ice-nucleating particles active at −15 ◦ C [INP−15 ] (a) versus [n0.5 ] and (b) versus [n2.0 ] for PRECIP
(blue circles), NON-PRECIP (green triangles), and SD (red squares) air masses. Power functions (solid lines) for each type of air mass
based on [n0.5 ] and [n2.0 ] are shown. An additional preliminary parameterisation for precipitating air masses based on [n2.0 ] is shown
(PRECIP+, thick dark blue line). It is the same as for non-precipitating air masses but with an added constant equivalent to 0.014 INPs L−1 .
The corresponding equations and R 2 values are shown in Table 1. The grey lines show the D15 parameterisation extrapolated to −15 ◦ C
and corrected for the difference between physical and aerodynamic diameters (see the “Material and method” section) with three different
calibration factors (Eq. 1): CF = 3 (dashed), CF = 1 (continuous), and CF = 0.086 (dotted). The latter value was the best fit found by Schrod
et al. (2017) for Saharan dust above Cyprus.
4 Conclusions ing a substantial fraction of Saharan dust. More of the vari-
ance of [INP] was explained by aerosol concentrations in air
masses that were non-precipitating or carrying desert dust
In summary, it is possible to reconcile two fundamental as-
compared to air masses that were precipitating. The absolute
pects of INPs active at moderate supercooling – increased
value of additional INPs in precipitating air masses, versus
abundance during precipitation and size – with a widely
non-precipitating air masses, seems to be independent of to-
used approach to parameterise INPs active at colder temper-
tal aerosol concentrations.
atures. Parameterisations based on the number concentration
To tackle predictions of INPs active at moderate super-
of aerosol particles are reasonable to predict INPs at mod-
cooling, particular attention has to be devoted to sampling
erate supercooling. However, relating [INP−15 ] to the num-
larger aerosol particles at mixed-phase cloud height, includ-
ber concentration of larger particles can further improve the
ing air masses that have been precipitating, and adjusting
predictions, which is not to say that INPs−15 are always in
procedures to reliably quantify [INP] at the targeted activa-
such a size range. An even greater improvement in predic-
tion temperatures, as was done in this study. Although our
tions is possible when we additionally distinguish between
proposed parameterisation has a generalisable structure, the
air masses that are precipitating, non-precipitating, or carry-
https://doi.org/10.5194/acp-21-657-2021 Atmos. Chem. Phys., 21, 657–664, 2021662 C. Mignani et al.: Towards parameterising atmospheric concentrations of INPs−15
Competing interests. The authors declare that they have no conflict
of interest.
Acknowledgements. The authors would like to deeply thank Paul
DeMott and the anonymous referee for their careful reviews. We
are indebted to Martin Genter for logistical support, Carolin Rösch
and Michael Rösch for technical support, Nora Els for borrowing
the Coriolis®µ from the University of Innsbruck and sharing her
experience, Lucie Roth and Mario Schär for helping with the mea-
surements, and Pedro Batista for helping with preparing Fig. 1. We
thank MeteoSwiss for weather data and providing access to the
COSMO1 and ECMWF data and all the RACLETS members for
fruitful discussions. We acknowledge funding from the Swiss Na-
Figure 4. Difference between [INP−15 ] in precipitating (PRE- tional Science Foundation (SNSF).
CIP) air masses and the function fitted to the non-precipitating
(NON-PRECIP) air masses (additional [INP−15 ] in PRECIP) ver-
sus [n2.0 ]. The median difference is 0.014 std L−1 (black dotted
Financial support. This research has been supported by the
line), and the lower and upper quartiles are 0.003 and 0.047 std L−1 ,
Swiss National Science Foundation (grant nos. 200021_169620,
respectively (grey dashed lines). The linear fit (grey solid line) is
200021_175824).
weakly positive but not significant (Pearson correlation test, R =
0.0027, and p = 0.98). The circle area is proportional to the amount
of precipitation along the last 6 h of the trajectory prior to sampling.
Black circles are for samples precipitating at Weissfluhjoch. Review statement. This paper was edited by Ulrich Pöschl and re-
viewed by Paul DeMott and one anonymous referee.
parameters have so far only been constrained by data from
one campaign. While a new parameterisation for a previously
weakly constrained temperature is clearly beneficial, it com- References
plements rather than replaces previous parameterisations. In
a changing climate with increasing temperatures and chang- Beall, C. M., Lucero, D., Hill, T. C., DeMott, P. J., Stokes, M.
D., and Prather, K. A.: Best practices for precipitation sam-
ing precipitation patterns, it is important to predict feedbacks
ple storage for offline studies of ice nucleation in marine and
between INPs and precipitation. coastal environments, Atmos. Meas. Tech., 13, 6473–6486,
https://doi.org/10.5194/amt-13-6473-2020, 2020.
Bigg, E. K. and Miles, G. T.: The results of large-
Data availability. The backward trajectories and the ice- scale measurements of natural ice nuclei, J. At-
nucleating particle concentrations plus complementary mos. Sci., 21, 396–403, https://doi.org/10.1175/1520-
data are published on ENVIDAT (https://www.envidat.ch, 0469(1964)0212.0.CO;2, 1964.
last access: 7 January 2021) and are accessible via Conen, F., Rodríguez, S., Hüglin, C., Henne, S., Herrmann, E.,
https://www.envidat.ch/dataset/raclets-backward-trajectories Bukowiecki, N., and Alewell, C.: Atmospheric ice nuclei at the
(last access: 7 January 2021, https://doi.org/10.16904/envidat.120, high-altitude observatory Jungfraujoch, Switzerland, Tellus B,
Sprenger, 2019) and https://www.envidat.ch/dataset/ice-nucleating- 67, 25014, https://doi.org/10.3402/tellusb.v67.25014, 2015.
particle-concentrations-active-at-15-c-at-weissfluhjoch (last access: Conen, F., Eckhardt, S., Gundersen, H., Stohl, A., and Yttri, K. E.:
7 January 2021, https://doi.org/10.16904/envidat.193, Mignani Rainfall drives atmospheric ice-nucleating particles in the coastal
et al., 2020), respectively. climate of southern Norway, Atmos. Chem. Phys., 17, 11065–
11073, https://doi.org/10.5194/acp-17-11065-2017, 2017.
Creamean, J. M., Kirpes, R. M., Pratt, K. A., Spada, N. J., Maahn,
Supplement. The supplement related to this article is available on- M., de Boer, G., Schnell, R. C., and China, S.: Marine and ter-
line at: https://doi.org/10.5194/acp-21-657-2021-supplement. restrial influences on ice nucleating particles during continuous
springtime measurements in an Arctic oilfield location, Atmos.
Chem. Phys., 18, 18023–18042, https://doi.org/10.5194/acp-18-
Author contributions. CM and FC conceived the study. CM and JW 18023-2018, 2018.
conducted the measurements. JW provided the aerosol data. MAS Cziczo, D. J., Ladino, L., Boose, Y., Kanji, Z. A., Kupiszewski,
conducted the modelling. JH and ZAK hosted the entire measure- P., Lance, S., Mertes, S., and Wex, H.: Measurements of ice
ment campaign. CM processed the data and prepared the figures for nucleating particles and ice residuals, Meteor. Mon., 58, 1–
the paper. CM and FC interpreted the data and wrote the paper with 13, https://doi.org/10.1175/AMSMONOGRAPHS-D-16-0008.1,
contributions from JW, MAS, ZAK, JH, and CA. 2017.
DeMott, P. J., Prenni, A. J., Liu, X., Kreidenweis, S. M., Petters,
M. D., Twohy, C. H., Richardson, M. S., Eidhammer, T., and
Atmos. Chem. Phys., 21, 657–664, 2021 https://doi.org/10.5194/acp-21-657-2021C. Mignani et al.: Towards parameterising atmospheric concentrations of INPs−15 663
Rogers, D. C.: Predicting global atmospheric ice nuclei distribu- Mignani, C., Wieder, J., Sprenger, M. A., Kanji, Z. A., Hen-
tions and their impacts on climate, P. Natl. Acad. Sci. USA, 107, neberger, J., Alewell, C., and Conen, F.: Ice nucleating parti-
11217–11222, https://doi.org/10.1073/pnas.0910818107, 2010. cle concentrations active at −15 ◦ C at Weissfluhjoch, EnviDat,
DeMott, P. J., Prenni, A. J., McMeeking, G. R., Sullivan, R. C., https://doi.org/10.16904/envidat.193, 2020.
Petters, M. D., Tobo, Y., Niemand, M., Möhler, O., Snider, J. Miller, A. J., Brennan, K. P., Mignani, C., Wieder, J., David,
R., Wang, Z., and Kreidenweis, S. M.: Integrating laboratory and R. O., and Borduas-Dedekind, N.: Development of the drop
field data to quantify the immersion freezing ice nucleation activ- Freezing Ice Nuclei Counter (FINC), intercomparison of droplet
ity of mineral dust particles, Atmos. Chem. Phys., 15, 393–409, freezing techniques, and use of soluble lignin as an atmo-
https://doi.org/10.5194/acp-15-393-2015, 2015. spheric ice nucleation standard, Atmos. Meas. Tech. Discuss.,
Els, N., Larose, C., Baumann-Stanzer, K., Tignat-Perrier, R., https://doi.org/10.5194/amt-2020-414, in review, 2020.
Keuschnig, C., Vogel, T. M., and Sattler, B.: Microbial composi- Mülmenstädt, J., Sourdeval, O., Delanoë, J., and Quaas, J.: Fre-
tion in seasonal time series of free tropospheric air and precipita- quency of occurrence of rain from liquid-, mixed-, and ice-phase
tion reveals community separation, Aerobiologia, 35, 671–701, clouds derived from A-Train satellite retrievals, Geophys. Res.
https://doi.org/10.1007/s10453-019-09606-x, 2019. Lett., 42, 6502–6509, https://doi.org/10.1002/2015GL064604,
Hanna, J. W., Schultz, D. M., and Irving, A. R.: Cloud-top tem- 2015.
peratures for precipitating winter clouds, J. Appl. Meteorol. Cli- Murray, B. J., O’Sullivan, D., Atkinson, J., and Webb,
matol., 47, 351–359, https://doi.org/10.1175/2007JAMC1549.1, M. E.: Ice nucleation by particles immersed in super-
2008. cooled cloud droplets, Chem. Soc. Rev., 41, 6519–6554,
Hara, K., Maki, T., Kobayashi, F., Kakikawa, M., Wada, https://doi.org/10.1039/C2CS35200A, 2012.
M., and Matsuki, A.: Variations of ice nuclei con- Petters, M. D. and Wright, T. P.: Revisiting ice nucleation from
centration induced by rain and snowfall within a lo- precipitation samples, Geophys. Res. Lett., 42, 8758–8766,
cal forested site in Japan, Atmos. Environ., 127, 1–5, https://doi.org/10.1002/2015GL065733, 2015.
https://doi.org/10.1016/j.atmosenv.2015.12.009, 2016. Phillips, V. T. J., DeMott, P. J., Andronache, C., Pratt, K. A., Prather,
Heymsfield, A. J., Schmitt, C., Chen, C.-C.-J., Bansemer, A., Get- K. A., Subramanian, R., and Twohy, C.: Improvements to an Em-
telman, A., Field, P. R., and Liu, C.: Contributions of the liq- pirical Parameterization of Heterogeneous Ice Nucleation and
uid and ice phases to global surface precipitation: observations Its Comparison with Observations, J. Atmos. Sci., 70, 378–409,
and global climate modeling, J. Atmos. Sci., 77, 2629–2648, https://doi.org/10.1175/JAS-D-12-080.1, 2013.
https://doi.org/10.1175/JAS-D-19-0352.1, 2020. Raabe, O. G.: Aerosol aerodynamic size conventions for inertia!
Huffman, J. A., Prenni, A. J., DeMott, P. J., Pöhlker, C., Ma- Sampler calibration, J. Air Pollut. Control Assoc., 26, 856–860,
son, R. H., Robinson, N. H., Fröhlich-Nowoisky, J., Tobo, Y., https://doi.org/10.1080/00022470.1976.10470329, 1976.
Després, V. R., Garcia, E., Gochis, D. J., Harris, E., Müller- Rauber, R. M.: Characteristics of cloud ice and precipitation during
Germann, I., Ruzene, C., Schmer, B., Sinha, B., Day, D. A., An- wintertime storms over the mountains of Northern Colorado, J.
dreae, M. O., Jimenez, J. L., Gallagher, M., Kreidenweis, S. M., Clim. Appl. Meteor., 26, 488–524, https://doi.org/10.1175/1520-
Bertram, A. K., and Pöschl, U.: High concentrations of biolog- 0450(1987)0262.0.CO;2, 1987.
ical aerosol particles and ice nuclei during and after rain, At- Rogers, R. R. and Yau, M. K.: A short course in cloud physics,
mos. Chem. Phys., 13, 6151–6164, https://doi.org/10.5194/acp- Pergamon Press, Oxford, New York, 1989.
13-6151-2013, 2013. Schrod, J., Weber, D., Drücke, J., Keleshis, C., Pikridas, M., Ebert,
Joung, Y. S., Ge, Z., and Buie, C. R.: Bioaerosol gen- M., Cvetković, B., Nickovic, S., Marinou, E., Baars, H., Ans-
eration by raindrops on soil, Nat. Commun., 8, 14668, mann, A., Vrekoussis, M., Mihalopoulos, N., Sciare, J., Curtius,
https://doi.org/10.1038/ncomms14668, 2017. J., and Bingemer, H. G.: Ice nucleating particles over the East-
Kanji, Z. A., Ladino, L. A., Wex, H., Boose, Y., Burkert- ern Mediterranean measured by unmanned aircraft systems, At-
Kohn, M., Cziczo, D. J., and Krämer, M.: Overview mos. Chem. Phys., 17, 4817–4835, https://doi.org/10.5194/acp-
of ice nucleating particles, Meteor. Mon., 58, 1.1–1.33, 17-4817-2017, 2017.
https://doi.org/10.1175/AMSMONOGRAPHS-D-16-0006.1, Sprenger, M.: Backward Trajectories, EnviDat,
2017. https://doi.org/10.16904/envidat.120, 2019.
Mason, R. H., Si, M., Chou, C., Irish, V. E., Dickie, R., Elizondo, Sprenger, M. and Wernli, H.: The LAGRANTO Lagrangian anal-
P., Wong, R., Brintnell, M., Elsasser, M., Lassar, W. M., Pierce, ysis tool – version 2.0, Geosci. Model Dev., 8, 2569–2586,
K. M., Leaitch, W. R., MacDonald, A. M., Platt, A., Toom- https://doi.org/10.5194/gmd-8-2569-2015, 2015.
Sauntry, D., Sarda-Estève, R., Schiller, C. L., Suski, K. J., Hill, Stopelli, E., Conen, F., Zimmermann, L., Alewell, C., and Morris,
T. C. J., Abbatt, J. P. D., Huffman, J. A., DeMott, P. J., and C. E.: Freezing nucleation apparatus puts new slant on study of
Bertram, A. K.: Size-resolved measurements of ice-nucleating biological ice nucleators in precipitation, Atmos. Meas. Tech., 7,
particles at six locations in North America and one in Europe, At- 129–134, https://doi.org/10.5194/amt-7-129-2014, 2014.
mos. Chem. Phys., 16, 1637–1651, https://doi.org/10.5194/acp- Tarn, M. D., Sikora, S. N. F., Porter, G. C. E., Wyld, B. V.,
16-1637-2016, 2016. Alayof, M., Reicher, N., Harrison, A. D., Rudich, Y., Shim,
Mignani, C., Creamean, J. M., Zimmermann, L., Alewell, C., and J.-U., and Murray, B. J.: On-chip analysis of atmospheric ice-
Conen, F.: New type of evidence for secondary ice formation at nucleating particles in continuous flow, Lab Chip, 20, 2889–
around −15 °C in mixed-phase clouds, Atmos. Chem. Phys., 19, 2910, https://doi.org/10.1039/D0LC00251H, 2020.
877–886, https://doi.org/10.5194/acp-19-877-2019, 2019. Vali, G.: Quantitative evaluation of experimental results on
the heterogeneous freezing nucleation of supercooled liq-
https://doi.org/10.5194/acp-21-657-2021 Atmos. Chem. Phys., 21, 657–664, 2021664 C. Mignani et al.: Towards parameterising atmospheric concentrations of INPs−15 uids, J. Atmos. Sci., 28, 402–409, https://doi.org/10.1175/1520- 0469(1971)0282.0.CO;2, 1971. Weingartner, E., Nyeki, S., and Baltensperger, U.: Seasonal and di- urnal variation of aerosol size distributions (10 < D < 750 nm) at a high-alpine site (Jungfraujoch 3580 m asl), J. Geophys. Res., 104, 26809–26820, https://doi.org/10.1029/1999JD900170, 1999. Atmos. Chem. Phys., 21, 657–664, 2021 https://doi.org/10.5194/acp-21-657-2021
You can also read