A Lacustrine Biomarker Record From Rebun Island Reveals a Warm Summer Climate in Northern Japan During the Early Middle Holocene Due to a Stronger ...
←
→
Page content transcription
If your browser does not render page correctly, please read the page content below
ORIGINAL RESEARCH
published: 14 June 2021
doi: 10.3389/feart.2021.704332
A Lacustrine Biomarker Record From
Rebun Island Reveals a Warm Summer
Climate in Northern Japan During the
Early Middle Holocene Due to a
Stronger North Pacific High
Masanobu Yamamoto 1,2*, Fangxian Wang 2, Tomohisa Irino 1,2, Kenta Suzuki 1,
Kazuyoshi Yamada 3, Tsuyoshi Haraguchi 4, Katsuya Gotanda 5, Hitoshi Yonenobu 6,
Xuan-Yu Chen 7,8 and Pavel Tarasov 9
1
Faculty of Environmental Earth Science, Hokkaido University, Sapporo, Japan, 2Graduate School of Environmental Science,
Hokkaido University, Sapporo, Japan, 3School of Human Science, Waseda University, Tokorozawa, Japan, 4Department of
Geosciences, Osaka City University, Osaka, Japan, 5Faculty of Global Studies, Chiba University of Commerce, Ichikawa, Japan,
6
Graduate School of Education, Naruto University of Education, Naruto, Japan, 7State Key Laboratory of Isotope Geochemistry,
Guangzhou Institute of Geochemistry, Chinese Academy of Sciences, Guangzhou, China, 8CAS Center for Excellence in Deep
Edited by: Earth Science, Guangzhou, China, 9Institute of Geological Sciences, Freie Universität Berlin, Berlin, Germany
Min-Te Chen,
National Taiwan Ocean University,
Taiwan The summer climate of northern Japan since the last glacial period has likely been
Reviewed by: determined by atmospheric and oceanic dynamics, such as changes in the North
Deming Kong,
Pacific High, the position of the westerlies, the Kuroshio Current, the Tsushima Warm
Guangdong Ocean University, China
Liang-Chi Wang, Current (TWC), and the East Asian summer monsoon. However, it is unclear which factor
National Chung Cheng University, has been most important. In this study, we analyzed leaf wax δ13C and δD and glycerol
Taiwan
dialkyl glycerol tetraethers (GDGTs) in sediments from Lake Kushu, Rebun Island, northern
*Correspondence:
Masanobu Yamamoto
Japan, and discuss changes in climate over the past 17,000 years. The GDGT-based
myama@ees.hokudai.ac.jp temperature, the averaged chain length, δ13C and δD of long-chain n-fatty acids indicated
that the climate was cold during the Oldest Dryas period ∼16 ka and warm in the early
Specialty section:
Middle Holocene from ∼9 to 6 ka. This climate change is consistent with the sea surface
This article was submitted to
Quaternary Science, Geomorphology temperature in the Kuroshio–Oyashio transition, but inconsistent with changes in the TWC
and Paleoenvironment, in the Sea of Japan. The results imply that the summer climate of northern Japan was
a section of the journal
Frontiers in Earth Science
controlled mainly by changes in the development of the North Pacific High via changes in
Received: 02 May 2021
the position of the westerly jet and East Asian summer monsoon rainfall, whereas the
Accepted: 28 May 2021 influence of the TWC was limited over a millennial timescale.
Published: 14 June 2021
Keywords: climate change, Northern Japan, holocene, lateglacial, Biomarkers, rebun, RK12
Citation:
Yamamoto M, Wang F, Irino T,
Suzuki K, Yamada K, Haraguchi T,
Gotanda K, Yonenobu H, Chen X-Y INTRODUCTION
and Tarasov P (2021) A Lacustrine
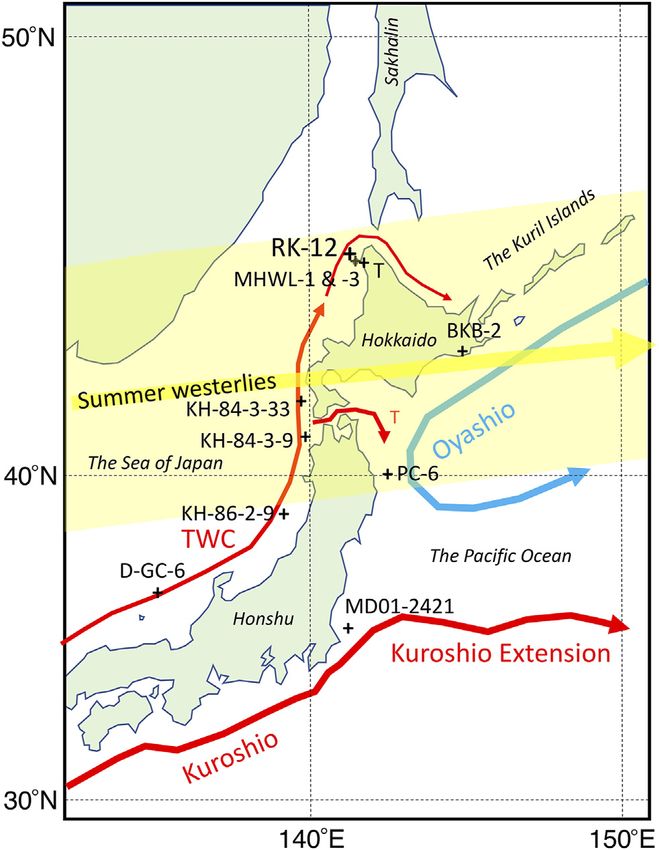
Biomarker Record From Rebun Island The summer climate of northern Japan is influenced by the summer position of the westerly winds
Reveals a Warm Summer Climate in
and the strength of the Tsushima Warm Current (TWC). The position of the westerly winds is linked
Northern Japan During the Early
Middle Holocene Due to a Stronger
to the oceanic subarctic boundary between the subtropical Kuroshio and subarctic Oyashio currents
North Pacific High. in the Pacific (Figure 1) (e.g., Yamamoto et al., 2004; Yamamoto et al., 2005; Isono et al., 2009;
Front. Earth Sci. 9:704332. Yamamoto, 2009). Yamamoto et al. (2005) and Isono et al. (2009) identified the southern summer
doi: 10.3389/feart.2021.704332 position of the Kuroshio–Oyashio transition (KOT) in the Oldest Dryas and Younger Dryas periods
Frontiers in Earth Science | www.frontiersin.org 1 June 2021 | Volume 9 | Article 704332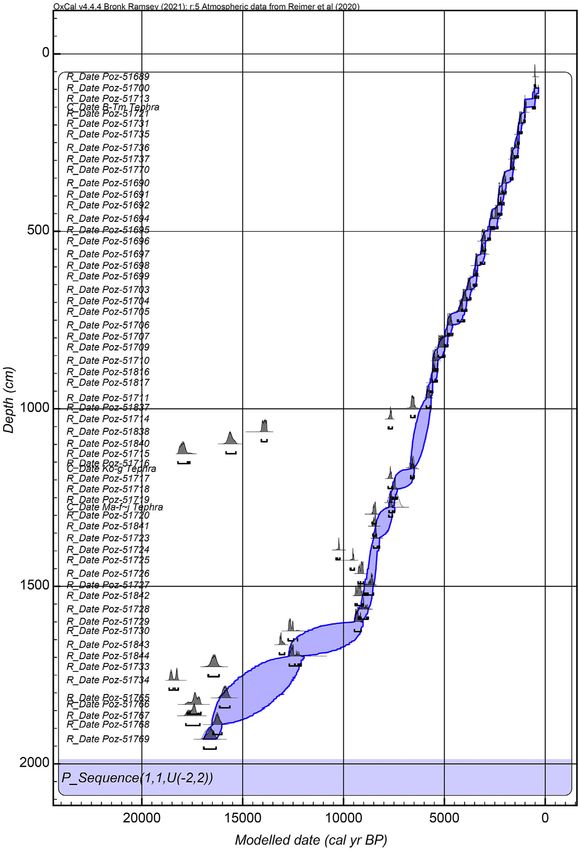
Yamamoto et al. Holocene Biomarker Record From Japan
more Abies and Pinaceae trees spread during the Late Holocene
due to gradual cooling.
Other proxies such as Sphagnum and vascular plant cellulose
δ18O in peat are more sensitive to summer hydrological
conditions. They showed remarkable changes in the high
moors in Rishiri (Sites MHWL-1 and -3) and Hokkaido (Site
BKB-2) during the Late Holocene, which corresponded to
changes in the summer sea surface temperature (SST) in the
KOT and the TWC strength (Sakurai et al., 2021; Yamamoto and
Seki, unpublished data).
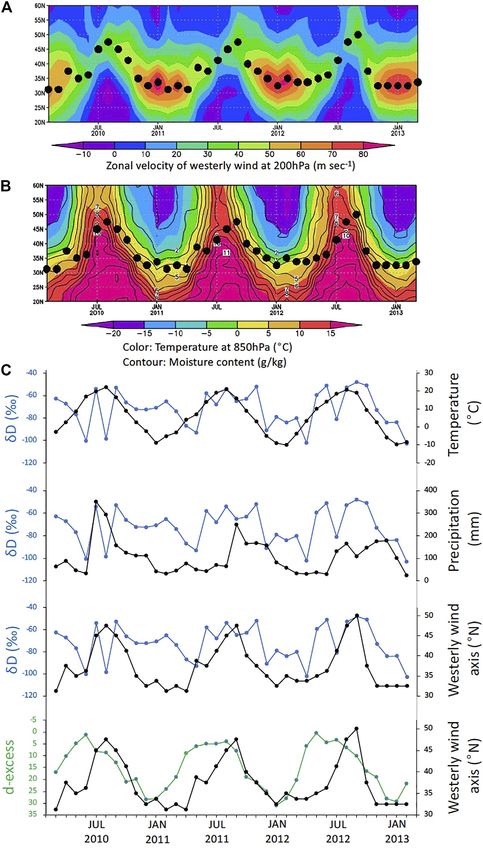
The summer westerly wind axis, moisture content,
temperature, precipitation, and precipitated water δD and
d-excess seasonally covaried at the study site (Figure 2),
indicating a close relationship between the position of the
summer westerly wind axis, the East Asian summer monsoon,
and precipitated water δD and d-excess (Figure 2). In summer,
the westerly wind axis shifts north, a warm and moist air mass
occupies the study site (45°N), the δD of precipitated water
is heavier, and the d-excess is lower. In winter, the westerly
wind axis shifts south, a cold and dry air mass occupies the study
site, the δD of precipitated water is lighter, and the d-excess is
higher. The higher d-excess in winter is attributed to kinetic
fractionation during the evaporation process in the Sea of Japan
under a large humidity deficit and a strong temperature contrast
in the air-sea surface interface (Sugimoto et al., 1988; Li et al.,
2017).
In this study, we analyzed leaf wax δ13C and δD and glycerol
dialkyl glycerol tetraethers (GDGTs) in sediments from Lake
FIGURE 1 | Map showing study site RK12-2 and the reference site Kushu, Rebun Island, northern Japan, and discuss changes in the
locations, i.e., MHWL-1 and 3 (Yamamoto and Seki, in preparation), BKB-2 summer climate and the atmospheric and ocean dynamics that
(Sakurai et al., 2021), PC-6 (Minoshima et al., 2007), MD01-2421 (Yamamoto affected the climate of northern Japan over the past 17 ka.
et al., 2004), KH-84-3-9, KH-84-3-33, KH-86-2-9, and D-GC-6
(Koizumi et al., 2006), and D-GC-9 (Koizumi et al., 2006), as well as the mean
positions of the summer (June to August) westerly wind axis with the range of
variation for 30 years from 1988 to 2017 (yellow shading) of summer SAMPLES AND METHODS
westerlies, the Kuroshio, Kuroshio Extension, Oyashio, Tsushima Warm
Current (TWC), and Tsugaru Warm Current (T). T indicates the meteorological
station at Teshio.
Sediment and Chronology
Lake Kushu is located in the northern part of Rebun Island
(45°25′58″N, 141°02′05″E) (Figure 1), 230–400 m from the
modern sea coast. The bean-shaped lake has a maximum
due to the weaker North Pacific High, a northward shift of the length of ∼1,100 m. The maximum water depth is ∼6 m in
KOT at the end of the Younger Dryas period, the northernmost the eastern part of the lake, with average depths of 3–5 m. In
position at 8 ka and the gradual southward shift during the February 2012, when a thick ice layer covered the lake, Dokon
Middle and Late Holocene. The TWC flows northwards as a (Sapporo, Japan) performed coring in the central part of the
branch of the Kuroshio Current along the eastern margin of the lake. Composite core RK12 was recovered from two boreholes
Sea of Japan (Figure 1). The TWC promotes moisture uptake by (RK12-1 and RK12-2) located within a few meters of each
the predominant winter monsoon winds and carries heat to other.
northern Japan. Diatom records from four offshore sites along The composite core revealed a continuous, partly laminated,
the Sea of Japan coast showed that TWC species appeared after organic-rich 20.3 m-long sediment column. The lithology is
7 ka and fluctuated in abundance on a millennial timescale described in Müller et al. (2016). In brief, the basal unit
(Koizumi et al., 2006). contains sandy clay with pebbles, suggesting a stronger river
Pollen records from Hokkaido (Igarashi, 2013 and references influence. Peat (1,925–1,935 and 1,905–1,915 cm) and organic-
therein) and Lake Kushu (Müller et al., 2016; Leipe et al., 2018) on rich clay (1,915–1,925 and 1,895–1,905 cm) layers appear in the
Rebun Island showed that the vegetation of northern Japan lower part of the core, suggesting shallow water or marshy
changed from a boreal forest in the Late Glacial to a cool- environments. The interval within 1,895–1,390 cm is
temperate forest in the Early Holocene due to deglacial characterized by homogeneous, relatively organic-poor clay,
warming. Temperate deciduous oak trees were more widely which is interrupted only by two sand seams (1,790–1,815 and
spread during the Middle Holocene, while forests containing 1,765–1,780 cm). Within 1,390–850 cm, the clay is mostly finely
Frontiers in Earth Science | www.frontiersin.org 2 June 2021 | Volume 9 | Article 704332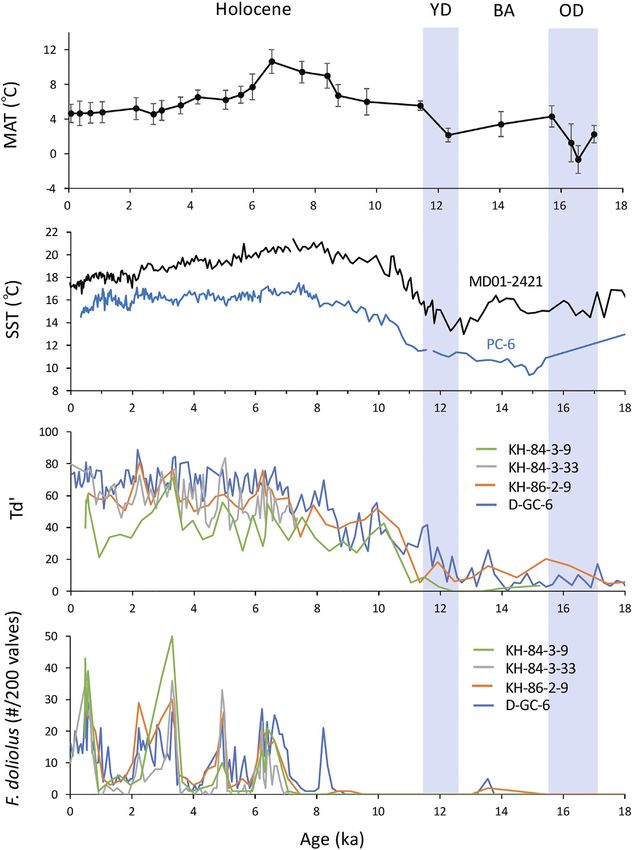
Yamamoto et al.                                                                                                                    Holocene Biomarker Record From Japan

  FIGURE 2 | (A) Zonal wind velocity at 200 hPa (positive westward) along 145°E, (B) Temperature and moisture content at 850 hPa along 145°E (Sakurai et al.,
  2021), (C) Precipitated water δD, d-excess, temperature and precipitation at the site of Teshio Town (2010–2013; Li et al., 2017) 80 km southeast of the study site, and
  the position of the westerly wind axis. Black solid dots indicate the positions of the westerly wind axis.

laminated with sections of relatively low to high organic matter                             An age–depth model of the RK12 core was established based on
concentrations. The upper 850 cm of the sediment column                                   57 accelerated mass spectrometry (AMS) radiocarbon dates (Müller
consists of homogeneous organic-rich clay.                                                et al., 2016), showing continued sedimentation beginning ∼17 ka

Frontiers in Earth Science | www.frontiersin.org                                      3                                              June 2021 | Volume 9 | Article 704332
Yamamoto et al.                                                                                                             Holocene Biomarker Record From Japan

  FIGURE 3 | Distribution of 57 calibrated AMS radiocarbon and three tephra dates used to construct Bayesian P_sequence depositional age–depth model for the
  RK12 sediment core from Lake Kushu (Supplementary Table S1).

(Supplementary Table S1). All available AMS dates were converted                     2013) and a “General” Outlier_Model (Bronk Ramsey, 2009),
into calendar ages using Oxcal v4.4 (Bronk Ramsey, 2021) and the                     applying the latest IntCal20 calibration curve (Reimer et al.,
latest IntCal20 calibration curve (Reimer et al., 2020). The 95.4%                   2020). The 14C dates regarded as outliers (see Müller et al., 2016
probability ranges obtained in this study (Supplementary Table S1)                   and Supplementary Table S1) have been removed from the model.
show very minor differences from the data published in Müller et al.                 Three precise tephra ages have been incorporated into the model for
(2016), thus indicating general robustness of the published age                      providing additional chronological constraints, given the
model. For the current study, an updated Bayesian age model for                      identification of these tephra layers in the RK12 sediment core of
the Kushu sequence has been constructed using Oxcal v4.4 (Bronk                      Lake Kushu (Chen et al., 2016; Chen et al., 2019). These include
Ramsey, 2021) based on the 57 AMS 14C dates (Müller et al., 2016)                    B-Tm tephra (composite core depth—150.5 cm; 1,004 cal yr BP;
and three tephra ages using Oxcal v4.4 (Bronk Ramsey, 2021). The                     Oppenheimer et al., 2017), Ko-g tephra (core depth—1,169 cm;
model utilizes a P_Sequence deposition model (Bronk Ramsey,                          95.4% probability range—6,651–6,446 cal yr BP; Chen et al., 2021)
2008), with a variable k parameter (Bronk Ramsey and Lee,                            and Ma-f∼j tephra (core depth—1,277 cm; 95.4% probability

Frontiers in Earth Science | www.frontiersin.org                                 4                                            June 2021 | Volume 9 | Article 704332
Yamamoto et al.                                                                                                    Holocene Biomarker Record From Japan

range—7,550–7,128 cal yr BP; Chen et al., 2021). The 95.4% Highest             hexane:toluene (3:1); F3, 4 ml toluene; and F4, 3 ml
Probability Density (HPD) range for the deposition model is                    toluene:CH3OH (3:1). An aliquot of F4 was dissolved in
illustrated in Figure 3.                                                       hexane-2-propanol (99:1), spiked with an internal standard
    In the upper half of the core, representing the past ∼6 ka, the            (500 ng of C46 glycerol trialkyl glycerol tetraether [GTGT];
linear sedimentation rate is very high (i.e., about 1 cm every 6 years).       Patwardhan and Thompson, 1999), and filtered through a
In the bottom half of the core, the age–depth model shows greater              short bed of Na2SO4. GDGTs were analyzed using high-
variation in the sedimentation rates and substantially slower                  performance liquid chromatography-mass spectrometry
sedimentation (i.e., about 1 cm every 20 years) before ∼9.5 ka.                (HPLC-MS) with an Agilent 1260 HPLC system coupled to
Based on a multi-proxy approach (diatoms, aquatic pollen, algae,               an Agilent 6130 Series quadrupole mass spectrometer.
geochemistry), Schmidt et al. (2019) reconstructed three phases of             Separation was achieved on two ultra-HPLC silica columns
lake basin development, including a marshy phase between 16.6 and              (ACQUITY BEH HILIC columns, 2.1 × 150 mm, 1.7 μm;
9.4 cal ka BP, a lagoon phase between 9.4 and 5.9 cal ka BP, and a             Waters, Milford, MA, United States) in series, fitted with a
freshwater lake phase after 5.9 cal ka BP, as the sand bar separating          2.1 × 5 m pre-column of the same material (Waters) and
the Kushu lagoon from the sea formed.                                          maintained at 30°C. GDGTs were eluted isocratically for
                                                                               25 min with 18% B, followed by a linear gradient to 35% B
                                                                               in 25 min, then a linear gradient to 100% B in 30 min, where
Analytical Methods
                                                                               A was hexane and B was hexane:isopropanol (9:1, v/v).
Lipids were extracted (×3) from ∼1 g of dried sediment using a
                                                                               The flow rate was 0.2 ml/min. The total run time was
Dionex ASE 200 Accelerated Solvent Extractor (Dionex,
                                                                               90 min with a 20 min re-equilibration. Ionization was
Sunnyvale, CA, United States) with dichloromethane:methanol
                                                                               achieved using atmospheric pressure, positive ion chemical
(6:4). The extract was separated into neutral and acid fractions via
                                                                               ionization-MS. The spectrometer was run in selected ion
aminopropyl silica gel column chromatography (Gao et al., 2015).
                                                                               monitoring mode (m/z 743.8, 1,018, 1,020, 1,022, 1,032,
The acid fraction was methylated with methanol:acetyl chloride
                                                                               1,034, 1,036, 1,046, 1,048, 1,050, 1,292.3, 1,296.3, 1,298.3,
(95:5) and purified with SiO2 column chromatography.
                                                                               1,300.3, and 1,302.3). Compounds were identified by
   The concentration of n-fatty acids in the acid fraction was
                                                                               comparing mass spectra and retention times with those in
analyzed using gas chromatography (GC) with an Agilent 6890
                                                                               the literature (Hopmans et al., 2000; De Jonge et al., 2014).
series gas chromatograph with on-column injection and
                                                                               Quantification was achieved by integrating the peak area in
electronic pressure control systems, and a flame ionization
                                                                               the (M+H)+ chromatogram and comparing these with the
detector (Agilent, Santa Clara, CA, United States). Samples
                                                                               peak area of an internal standard (C46 GTGT) in the (M+H)+
were dissolved in toluene. Helium was the carrier gas and the
                                                                               chromatogram according to the method of Huguet et al.
flow velocity was maintained at 30 cm/s. An Agilent J&W CP-Sil
                                                                               (2006). The correction value of ionization efficiency
5 CB column was used (length 50 m; i.d. 0.25 mm; thickness
                                                                               between GDGTs and the internal standard was obtained in
0.25 μm). The oven temperature was programmed from 100 to
                                                                               our laboratory by comparing the peak areas of isolated
130°C at 20°C/min and from 130 to 310°C at 4°C/min, and then
                                                                               crenarchaeol and branched GDGTs I and II (Schouten
maintained at 310°C for 30 min. The average chain length (ACL)
                                                                               et al., 2013) and C46 GTGT in known amounts. In the
of n-fatty acids in this study is defined as:
                                                                               routine analysis, a working standard that was a mixture of
                        (26C26 + 28C28 + 30C30 + 32C32 )                       C46 GTGT and the GDGTs extracted and purified from East
               ACL                                     .
                            (C26 . + C28 + C30 + C32 )                         China Sea sediment was inserted every 20 samples to monitor
                                                                               ionization efficiency changes.
   The δ13C (‰ Vienna Pee Dee Belemnite [VPDB]) of the                            To estimate the terrestrial/in-situ production ratio of branched
methylated n-fatty acids in the acid fraction was analyzed using a             GDGTs, the weighted average number of cyclopentane moieties
Thermo Fisher Scientific (Waltham, MA, United States) GC IsoLink                of tetramethylated branched GDGTs (#Ringstetra) was calculated
II with a capillary column coated with a TG-5MS column (30 m                   (Sinninghe Damsté, 2016):
length; i.d. 0.25 mm; 0.25 μm film thickness) combined with a Delta
V mass spectrometer through a combustion furnace at 1,000°C. The                                                  ([Ib] + 2[Ic])
                                                                                                #Ringstetra                         .
sample was dissolved in toluene. The oven temperature was                                                       ([Ia] + [Ib] + [Ic])
programmed from 100 to 230°C at 30°C/min and from 230 to
                                                                                   To estimate the mean annual temperature (MAT), the
310°C at 4°C/min and then maintained at 310°C for 15 min. As an
                                                                               following parameters were calculated with the following
internal isotopic standard, n-C36H74 was used to check the
                                                                               equations based on a global soil dataset obtained using
measurement conditions. Data were converted into values relative
                                                                               different calibration strategies (De Jonge et al., 2014):
to VPDB using standard delta notation by comparison with CO2
standard gas. The δ13C values of fatty acids were obtained from the                   ′                      ([Ia] + [Ib] + [Ic])
                                                                                 MBT5ME                                                           ,
measured values of fatty acid–methyl esters by correcting for methyl                         ([Ia] + [Ib] + [Ic] + [IIa] + [IIb] + [IIc] + [IIIa])
carbon (−34.1‰). The reproducibility of the measurement based on                                           ′
                                                                                    MAT  −8.57 + 31.45 MBT5ME
repeated analyses was better than ±0.1‰.
   The neutral fraction was separated into four fractions using                    (RMSE  4.8°C)
SiO2 column chromatography: F1, 3 ml hexane; F2, 3 ml                                                                                                 (1)

Frontiers in Earth Science | www.frontiersin.org                           5                                         June 2021 | Volume 9 | Article 704332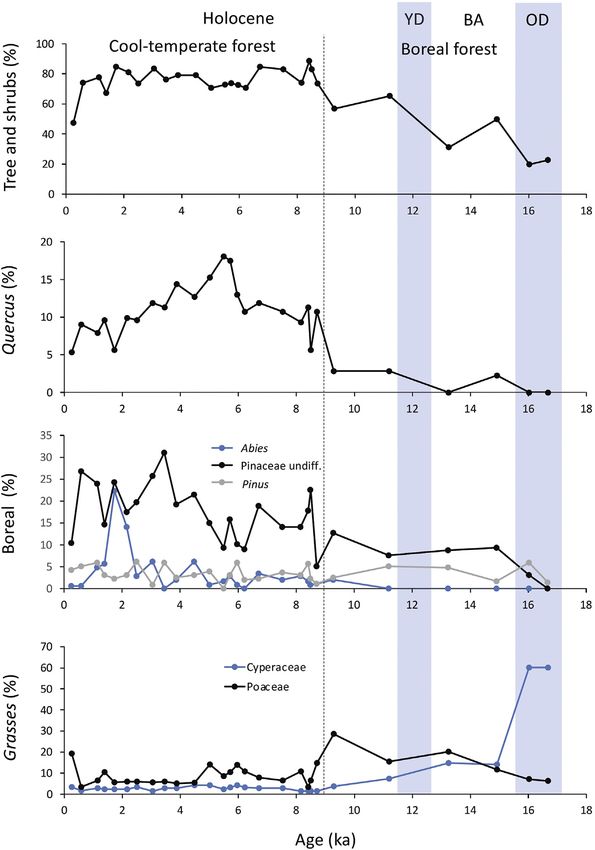
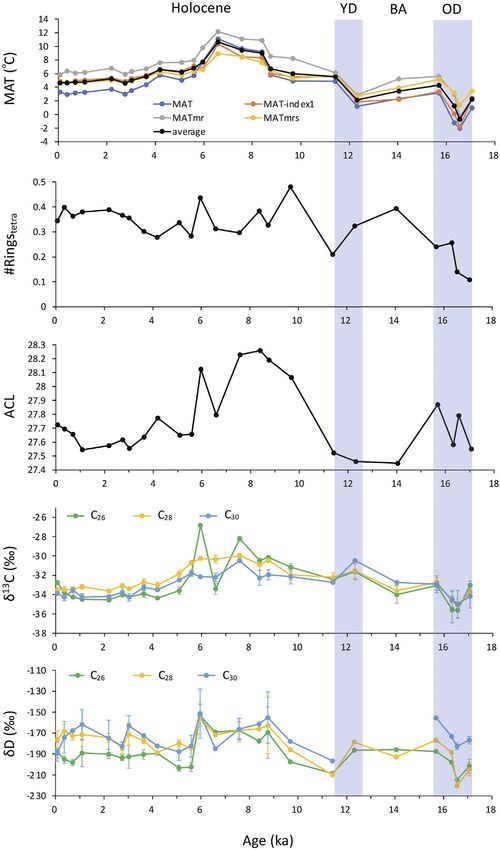
Yamamoto et al.                                                                                                                   Holocene Biomarker Record From Japan

  FIGURE 4 | Changes in the glycerol dialkyl glycerol tetraether (GDGT)-based mean annual temperatures (MATs) obtained using different calibrations (Equations
  1–4), weighted average number of cyclopentane moieties of tetramethylated branched GDGTs (#Ringstetra), average chain length (ACL), and δ13C and δD of long-chain
  n-fatty acids in sediments from core RK12-2, Kushu Lake, Rebun Island, over the last 17 ka. The vertical bar of the sample value indicates 1σ. OD, Oldest Dryas period;
  BA, Bølling–Allerød period; and YD, Younger Dryas period.

Frontiers in Earth Science | www.frontiersin.org                                     6                                               June 2021 | Volume 9 | Article 704332
Yamamoto et al.                                                                                                       Holocene Biomarker Record From Japan

  FIGURE 5 | Abundance of pollen in sediments from the RK12 core during the last 17 ka (Müller et al., 2016).

                         ([Ia] + [Ib] + [Ic] + [IIa′ ] + [IIIa′ ])                   RESULTS AND DISCUSSION
     Index 1  log                                                 ,
                        ([Ic] + [IIa] + [IIc] + [IIIa] + [IIIa′ ])
     MAT  5.05 + 14.86 Index 1
                                                                           (2)       GDGT-Based Temperature
                                                                                     The MAT reconstruction based on the four different calibrations
   (RMSE  4.7°C)                                                                    yielded similar variation within the calibration error of 4.6–5.0°C
 MATmr  7.71 + 17.1[Ia] + 25.9 [Ib] + 34.4 [Ic] − 28.6 [IIa],                       (Figure 4). The average value of the reconstructed temperature
 RMSE  4.6°C.                                                                       varied between –0.7 and 10.6°C and was low at ∼17 ka and high
                                                            (3)                      between 9 and 6 ka (Figure 4). The core-top temperature
        MATmrs  5.58 + 17.91[Ia] − 18.77[IIa]                                       (3.3–5.8°C) was consistent with the current mean annual air
        (RMSE  5.0°C)
                                                            (4)                      temperature ∼83 km southeast of the study site (6.4°C at
                                                                                     Teshio; Japan Meteorological Agency, https://weather.time-j.
   where [Ia] to [IIIc′] are the GDGTs defined in De Jonge et al.                     net/Stations/JP/teshio) within the calibration error. Because
(2014).                                                                              branched GDGTs are produced in both terrestrial and

Frontiers in Earth Science | www.frontiersin.org                                 7                                      June 2021 | Volume 9 | Article 704332
Yamamoto et al. Holocene Biomarker Record From Japan
lacustrine environments (e.g., Schouten et al., 2012), the Leaf13Wax δ13C
reconstructed temperature may reflect both terrestrial and lake The δ C of long-chain (C26, C28, and C30) n-fatty acids varied
water temperatures. The #Ringstetra index varied between 0.1 and between –35.6 and –26.8‰ (Figure 4). The values were higher in
0.5, but was mainly 0.3–0.4 after 16 ka (Figure 4), corresponding the period between 9 and 5 ka (Figure 4). The δ13C of long-chain
to the range of dominant terrestrial branched GDGTs (Sinninghe n-fatty acids of C3 and C4 plants sampled in the early 2000s (CO2
Damsté, 2016). This indicated that the branched GDGTs were concentration ∼370 ppm) averaged –37.1 ± 2.0‰ (n 13) and
mainly of terrestrial soil origin, with a small lacustrine –19.5 ± 1.8‰ (n 9), respectively (Chikaraishi et al., 2004).
contribution after 16 ka. We assume that the GDGT-derived However, these end-member values have varied in the past.
MAT reflects the terrestrial air temperature rather than the Contemporary δ13C values for both C3 and C4 plants have
lake water temperature. The record shows a colder climate in been affected by the Suess effect (decreasing by ∼2‰ over the
the Late Glacial and a warmer climate in the early Middle past 250 years; Keeling et al., 2017). The δ13C values of C3 plants
Holocene (Figure 4). have been reduced further by increasing isotopic fractionation,
The pollen assemblage in sediments from the RK12 core was which is governed by the atmospheric CO2 concentration
described and the paleovegetation discussed in Müller et al. (Schubert and Jahren, 2015). Considering these effects, the
(2016) and Leipe et al. (2018) is as follows. From 16 to 11 ka, calculated fatty acid δ13C of C3 plants at a CO2 of 280 ppm is
the vegetation shifted from herbaceous (predominantly –33.7‰. In comparison, the δ13C value for C4 plants is
Cyperaceae) to trees and shrubs (Pinaceae, Alnus, and Betula) independent of the atmospheric CO2 concentration. The fatty
(Figure 5). The spread of woody vegetation was interrupted acid δ13C of C4 plants before 1750 CE was –17.5‰. The δ13C of
during the Younger Dryas period, although the reversal was long-chain n-fatty acids in the study samples varied around the
not prominent. In the Middle Holocene between 8 and 4 ka, end-member values of C3 plants. If the variation in δ13C reflected
there was a major spread of deciduous Quercus trees, with the the mixing ratio of C3 and C4 plants, the higher δ13C between 10
highest percentages of Quercus pollen (17–27%) between 6 and and 5 ka would indicate the contribution of C4 plants. However,
5 ka (Figure 5) (Müller et al., 2016; Leipe et al., 2018). This is in the pollen record from the study core did not show evidence of a
line with a major spread of cool mixed and cool conifer forests in greater contribution of C4 plants in this period, suggesting that
the Hokkaido Region (Igarashi, 2013). The Late Holocene section another factor was responsible for the reconstructed shift in the
of the RK12 record showed the highest percentages of Abies and δ13C values.
Pinaceae pollen by ∼2 ka (Figure 5), suggesting an increase in The δ13C of C3 plants is affected by photosynthetic activity
coniferous tree cover in the regional forest vegetation. This pollen (Farquhar and Richards, 1984; Evans et al., 1986), where greater
record in Lake Kushu is consistent with the result of our MAT activity induces higher δ13C. In the RK12 core, higher δ13C
reconstruction. The culmination of Quercus pollen was delayed appeared in a warm period (Figure 4). Therefore, we postulate
behind the MAT maximum by ∼1 ka, presumably reflecting the that a warm climate enhanced C3 plant photosynthesis, which
time required for vegetation transition. increased δ13C.
Distribution of n-Fatty Acids Leaf Wax δD
All of the samples showed a bimodal homologous distribution of The δD of long-chain (C26, C28, and C30) n-fatty acids varied
n-fatty acids with maxima at C16 and C26 or C28. The n-fatty acids between –220.6 and –151.5‰ (Figure 4). The δD was lower at
around C16 are ubiquitous in eukaryotes and bacteria, while the long- ∼17, 11, and 5 ka and higher at 9–6 ka (Figure 4). The variation in
chain n-fatty acids (>C26) are derived from vascular plants (Eglinton δD was similar to that in the GDGT-based MATs (Figure 4).
and Hamilton, 1967). The long-chain n-fatty acids (>C26) were more Dansgaard (1964) and Jouzel et al. (1994) showed that the δ18O of
abundant than the shorter homologs. The even carbon number global precipitation is related to the MAT. Jouzel et al. (1994) also
preference ranged from 5 to 18, typical fresh leaf wax. found that areas with a MAT below 15°C had a linear relationship
The ACL varied between 27.5 and 28.2 and was higher in the between MAT and the mean annual δ18O of precipitation (δ18O
period between 10 and 6 ka than in other periods (Figure 4). In 0.64 MAT—12.8). This is equivalent to the formula δD 5.12
modern plants, the ACL of plant leaf wax (long-chain n-alkanes) MAT—92.4. The MAT at the study site is 6.4°C (1981–2010;
is higher in warmer climates (Tipple and Pagani, 2013). It is also Japan Meteorological Agency, https://weather.time-j.net/
sensitive to relative humidity, but the response is opposite in Stations/JP/teshio) and the mean annual δD at Teshio 80 km
different species (Hoffmann et al., 2013). The ACL is higher in southeast of the sampling site is −69.6‰ (2010–2014; Li et al.,
grasses than trees in the temperate climate zone (Bush 2017). These values are consistent with the relationship
McInerney, 2013). The abundance variation in Poaceae and described above.
Cyperaceae pollen was not consistent with the ACL (Figure 5; The maximum range of long-chain fatty acid δD variation was
Müller et al., 2016), suggesting that the higher ACL between 10 69.1‰ (Figure 4). If this variation was caused only by a process
and 6 ka does not reflect grass abundance and aridity but rather a following the above MAT–δD relationship, a 69.1‰ variation in
warm climate, as indicated by the GDGT indices. δD would correspond to a 13.5°C variation in MAT. Our MAT
Relatively high ACL was also found in the Oldest Dryas period estimates based on the GDGT compositions indicated that the
(Figure 4). The pollen record indicated that Cyperaceae pollen temperature variation over the last 17 ka was 11.3°C. Summer SST
was abundant in this period (Figure 5; Müller et al., 2016), records from the northern Japan margin over the past 17 ka show
suggesting that the high ACL reflected an abundance of sedge. a variation of ∼8°C (Site PC-6 in Minoshima et al., 2007; Site
Frontiers in Earth Science | www.frontiersin.org 8 June 2021 | Volume 9 | Article 704332Yamamoto et al. Holocene Biomarker Record From Japan FIGURE 6 | Changes in the glycerol dialkyl glycerol tetraether-based mean annual temperatures (MATs) obtained using different calibrations (averages and 1σ range), UK37’-based sea surface temperature (SST) at sites MD01-2421 (Yamamoto et al., 2004; Yamamoto et al., 2005; Isono et al., 2009; Yamamoto, 2009) and PC-6 (Minoshima et al., 2007) in the Kuroshio–Oyashio transition zone, temperature index of diatoms (Td’) and relative abundance of Fragilariopsis doliola, and Tsushima Warm Current species in cores KH-84-3-9, KH-84-3-33, KH-86-2-9, and D-GC-6 (Koizumi et al., 2006) over the last 17 ka. GH02-1030 in Inagaki et al., 2009). This implies that the The position of the westerly wind axis is the second factor temperature effect explains a large part of the variation controlling long-chain fatty acid δD via the mean annual δD of observed in C26 and C28 fatty acid δD. precipitation (Li et al., 2017). Precipitation occurs in Hokkaido Two other potential factors control long-chain fatty acid δD when a low-pressure system migrates from west to east along via the mean annual δD of precipitation. The first factor is the with the westerly jet. The δD values of precipitated water were seasonal variation in the δD of precipitation. Water precipitated 24–32‰ higher when the migration path of the low-pressure in autumn has ∼30‰ higher δD values than that precipitated in system was located to the north of the study location relative to winter and spring (Figure 2) (Li et al., 2017). Thus, a large times when the migration path was located to the south (Li amount of autumn precipitation or a lower amount of winter and et al., 2017). When the westerly jet is located north of the study spring precipitation would shift the mean annual δD values in a site, southerly winds bring moisture from the south, inducing positive direction. more precipitation at the study site (Figure 2). Thus, a Frontiers in Earth Science | www.frontiersin.org 9 June 2021 | Volume 9 | Article 704332
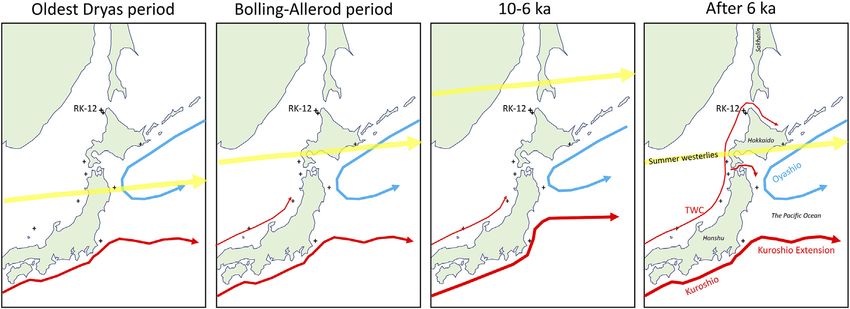
Yamamoto et al.                                                                                                      Holocene Biomarker Record From Japan

  FIGURE 7 | Schematic maps show the postulated positions of the summer westerly jet, the Kuroshio Extension (Yamamoto, 2009) and the Tsushima Warm
  Current (TWC; Koizumi et al., 2006) in different climate regimes.

northward shift in the position of the westerly jet increases the                reflected a warmer climate and the northern position of the
δD of precipitated water, and the associated higher fraction of                  westerlies.
summer-to-annual precipitation further increases the δD.
These results suggest that the position of the westerly jet
controls the amount of precipitation, as well as the δD of                       Factors Controlling Summer Climate in
precipitated water over a long timescale. Higher long-chain                      Northern Japan Over the Past 17 ka
fatty acid δD reflects a northerly position of the summer                         The Hokkaido region is located at the mean position of the
westerly jet and the resultant increase in summer and                            modern summer westerly jet (Figure 1) and at the northern
autumn precipitation.                                                            margin of the East Asian summer monsoon, which brings a
   One may speculate that the strengthening of the TWC                           warm, moist air mass from the Pacific Ocean to this area.
increased winter precipitation and decreased the fatty acid                      When the westerly jet is located in the north, the southerly
δD from the Middle to Late Holocene because, in winter,                          winds (i.e., the East Asian summer monsoon) reach Hokkaido,
the East Asian winter monsoon influences all of Hokkaido                          resulting in a warm, wet climate (Nitta, 1987; Kawamura et al.,
and brings heavy snowfall to mountainous areas. Plants                           1998).
might partly use the water supplied by winter precipitation.                        The GDGT-based MATs, the ACL, and the δ13C and δD of
Even if winter precipitation was higher, the δD should be lower.                 long-chain n-fatty acids indicated that climate was cold in the
However, the precipitation from January to April is only one                     Oldest Dryas period and warm during 10–6 ka (Figure 4). This
third that from June to October at present (Japan                                climate change is consistent with the SST changes in the KOT
Meteorological Agency, https://weather.time-j.net/Stations/JP/                   (Figure 6) (Site PC-6 in Minoshima et al. (2007); Site MD01-
teshio). If winter precipitation was lower in the Middle                         2421 in Yamamoto et al. (2004), Yamamoto et al. (2005), Isono
Holocene than in the Late Holocene, the effect on the δD of                      et al. (2009), Yamamoto, (2009)). The summer position of the
annual precipitation should be small. Therefore, this case can                   westerly wind axis in the study region is related to the strength
likely be neglected on a millennial timescale.                                   of the North Pacific High (Nitta, 1987; Kawamura et al., 1998),
   Evapotranspiration induces the enrichment of deuterium in                     with a stronger (weaker) North Pacific High shifting the
the plant body water. The evapotranspiration rate depends on the                 westerly wind axis northward (southward) (Figure 7). The
relative humidity. When the relative humidity is low,                            development of the North Pacific High drives the oceanic
evapotranspiration is expected to be more active, resulting in                   subtropical gyre circulation in the North Pacific. The Pacific
higher leaf wax δD. However, the low abundance of Poaceae and                    SST in the KOT is a good indicator of the strength of the
Cyperaceae pollen does not indicate a dry environment during                     Kuroshio and its extension, which form part of the subtropical
9–6 ka (Figure 5; Müller et al., 2016) and was not consistent with               gyre circulation. Thus, the correspondence between the
the high δD during 9–6 ka, suggesting that the higher high δD                    climate of Rebun Island and the SST in the KOT suggests
does not reflect a dry environment.                                               that the summer position of the westerly wind axis is linked to
   The above discussion summarizes that the leaf wax δD at the                   the oceanic subtropical gyre circulation in the North Pacific via
study site reflects the global distribution of precipitated water δD              regional atmospheric dynamics in the northwestern Pacific
and temperature. The latitudinal gradient of precipitated water                  region. The postglacial climate of Rebun Island reflects
δD is enhanced north and south of the westerly jet (Li et al., 2017).            changes in the atmospheric conditions, i.e., the northward-
We thus conclude that the higher leaf wax δD during 9–6 ka likely                shifted position of the westerly jet, stronger influence of the

Frontiers in Earth Science | www.frontiersin.org                            10                                         June 2021 | Volume 9 | Article 704332
Yamamoto et al.                                                                                                                      Holocene Biomarker Record From Japan

East Asian summer monsoon, and development of the North                                      DATA AVAILABILITY STATEMENT
Pacific High, and vice versa (Sakurai et al., 2021).
    However, the climate change during the Holocene is not                                   The original contributions presented in the study are included in
consistent with changes in the TWC in the Sea of Japan                                       the article/Supplementary Material, further inquiries can be
indicated by the temperature index of diatoms [Td’  warm/                                   directed to the corresponding author.
(warm + cold) water diatom species] or the abundance of
Fragilariopsis doliola, a marker diatom species of the TWC, in
core D-GC-6 from the southern Sea of Japan (Figure 6) (Koizumi                               AUTHOR CONTRIBUTIONS
et al., 2006). On Rishiri Island, 40 km south of Rebun Island,
cellulose δ18O in peat cores from site MHWL showed that the                                  MY conceived the research idea, contributed biomarker data and
influence of the TWC on the δ18O of precipitated water appeared                               prepared the manuscript. FW and KS contributed biomarker data.
after 2.8–1.3 ka (Yamamoto and Seki, unpublished data). However,                             KY and TH conducted the field work. KG, HY and PT managed the
the relationship between the fatty acid δD and the strength of the                           drilling project. PT and HYC updated the age model. All authors
TWC on a millennial timescale during the Holocene is not clear.                              discussed the data and improved the manuscript.
    The above considerations imply that the climate of
northern Japan was controlled mainly by changes in the
development of the North Pacific High via changes in the                                      FUNDING
position of the westerly jet and the East Asian summer
monsoon rainfall, while the influence of the TWC was                                          This study was supported by the Japan Society for the Promotion
limited on a millennial timescale.                                                           of Science (25610146, JPMXS05R2900001, and 19H05595 to MY
                                                                                             and 26101002, 21101002 to HY).

CONCLUSION
                                                                                             ACKNOWLEDGMENTS
The GDGT-based MAT, ACL, δ13C and δD of long-chain
n-fatty acids indicated that the climate in northern Japan was                               We also thank Dokon Co. Ltd., Taku Ajioka, Ke Wang, Yoshie Nakai,
cold in the Oldest Dryas period and warm during 9–6 ka. This                                 Eriko Noma, and Keiko Ohnishi for help in the sampling, core
climate change is consistent with the SST in the KOT, but                                    description, and subsampling, and Stefanie Müller for discussion.
inconsistent with changes in the TWC in the Sea of Japan.
The results imply that the climate of northern Japan was
controlled mainly by changes in the development of the                                       SUPPLEMENTARY MATERIAL
North Pacific High via changes in the position of the
westerly jet and the East Asian summer monsoon rainfall,                                     The Supplementary Material for this article can be found online at:
whereas the influence of the TWC was limited on a                                             https://www.frontiersin.org/articles/10.3389/feart.2021.704332/
millennial timescale.                                                                        full#supplementary-material

                                                                                                Using the Sedimentary Record From Lake Kushu, Rebun Island. Quat. Sci. Rev.
REFERENCES                                                                                      215, 272–292. doi:10.1016/j.quascirev.2019.05.017
                                                                                             Chikaraishi, Y., Naraoka, H., and Poulson, S. R. (2004). Hydrogen and Carbon
Bronk Ramsey, B. (2008). Deposition Models for Chronological Records. Quat. Sci.                Isotopic Fractionations of Lipid Biosynthesis Among Terrestrial (C3, C4 and
   Rev. 27 (1–2), 42–60. doi:10.1016/j.quascirev.2007.01.019                                    CAM) and Aquatic Plants. Phytochemistry 65, 1369–1381. doi:10.1016/j.
Bronk Ramsey, C. (2009). Dealing With Outliers and Offsets in Radiocarbon                       phytochem.2004.03.036
   Dating. Radiocarbon 51 (3), 1023–1045. doi:10.1017/s0033822200034093                      Dansgaard, W. (1964). Stable Isotopes in Precipitation. Tellus 16, 436–468. doi:10.
Bronk Ramsey, C. (2021). OxCal 4.4. Available at: http://c14.arch.ox.ac.uk/oxcal                3402/tellusa.v16i4.8993
   (Accessed May 20, 2021).                                                                  De Jonge, C., Hopmans, E. C., Zell, C. I., Kim, J.-H., Schouten, S., and Sinninghe
Bronk Ramsey, C., and Lee, S. (2013). Recent and Planned Developments of the                    Damsté, J. S. (2014). Occurrence and Abundance of 6-Methyl Branched
   Program OxCal. Radiocarbon 55 (2), 720–730. doi:10.1017/s0033822200057878                    Glycerol Dialkyl Glycerol Tetraethers in Soils: Implications for
Bush, R. T., and McInerney, F. A. (2013). Leaf Wax n-Alkane Distributions in and                Palaeoclimate Reconstruction. Geochim. Cosmochim. Acta 141, 97–112.
   Across Modern Plants: Implications for Paleoecology and Chemotaxonomy.                       doi:10.1016/j.gca.2014.06.013
   Geochim. Cosmochim. Acta 117, 161–179. doi:10.1016/j.gca.2013.04.016                      Eglinton, G., and Hamilton, R. J. (1967). Leaf Epicuticular Waxes. Science 156,
Chen, X.-Y., Blockley, S. P. E., Staff, R. A., Xu, Y.-G., and Menzies, M. A. (2021).            1322–1335. doi:10.1126/science.156.3780.1322
   Improved Age Estimates for Holocene Ko-g and Ma-f∼j Tephras in Northern                   Evans, J., Sharkey, T., Berry, J., and Farquhar, G. (1986). Carbon Isotope
   Japan Using Bayesian Statistical Modelling. Quat. Geochronol. [Epub ahead of                 Discrimination Measured Concurrently With Gas Exchange to Investigate
   print].                                                                                      CO2 Diffusion in Leaves of Higher Plants. Funct. Plant Biol. 13, 281–292.
Chen, X.-Y., Blockley, S. P. E., Tarasov, P. E., Xu, Y.-G., McLean, D., Tomlinson, E.           doi:10.1071/pp9860281
   L., et al. (2016). Clarifying the Distal to Proximal Tephrochronology of the              Farquhar, G., and Richards, R. (1984). Isotopic Composition of Plant Carbon
   Millennium (B-Tm) Eruption, Changbaishan Volcano, Northeast China. Quat.                     Correlates With Water-Use Efficiency of Wheat Genotypes. Funct. Plant Biol.
   Geochronol. 33, 61–75. doi:10.1016/j.quageo.2016.02.003                                      11, 539–552. doi:10.1071/pp9840539
Chen, X.-Y., McLean, D., Blockley, S. P. E., Tarasov, P. E., Xu, Y.-G., and Menzies,         Gao, L., Guimond, J., Thomas, E., and Huang, Y. (2015). Major Trends in Leaf Wax
   M. A. (2019). Developing a Holocene Tephrostratigraphy for Northern Japan                    Abundance, δ2H and δ13C Values Along Leaf Venation in Five Species of C3

Frontiers in Earth Science | www.frontiersin.org                                        11                                              June 2021 | Volume 9 | Article 704332
Yamamoto et al. Holocene Biomarker Record From Japan
Plants: Physiological and Geochemical Implications. Org. Geochem. 78, Oppenheimer, C., Wacker, L., Xu, J., Galván, J. D., Stoffel, M., Guillet, S., et al.
144–152. doi:10.1016/j.orggeochem.2014.11.005 (2017). Multi-proxy Dating the ’Millennium Eruption’ of Changbaishan to Late
Hoffmann, B., Kahmen, A., Cernusak, L. A., Arndt, S. K., and Sachse, D. 946 CE. Quat. Sci. Rev. 158, 164–171. doi:10.1016/j.quascirev.2016.12.024
(2013). Abundance and Distribution of Leaf Wax n-Alkanes in Leaves of Patwardhan, A. P., and Thompson, D. H. (1999). Efficient Synthesis of 40- and 48-
Acacia and Eucalyptus Trees Along a Strong Humidity Gradient in membered Tetraether Macrocyclic Bisphosphocholines. Org. Lett. 1, 241–244.
Northern Australia. Org. Geochem. 62, 62–67. doi:10.1016/j.orggeochem. doi:10.1021/ol990567o
2013.07.003 Reimer, P. J., Austin, W. E. N., Bard, E., Bayliss, A., Blackwell, P. G., Bronk Ramsey,
Hopmans, E. C., Schouten, S., Pancost, R. D., van der Meer, M. T. J., and Sinninghe C., et al. (2020). The IntCal20 Northern Hemisphere Radiocarbon Age
Damsté, J. S. (2000). Analysis of Intact Tetraether Lipids in Archaeal Cell Calibration Curve 0–55 CAL kBP). Radiocarbon 62, 725–757.
Material and Sediments by High Performance Liquid Chromatography/ Sakurai, H., Yamamoto, M., Seki, O., Omori, T., and Sato, T. (2021). Cellulose
atmospheric Pressure Chemical Ionization Mass Spectrometry. Rapid Oxygen Isotopes of Sphagnum and Vascular Plants in a Peat Core Reveal
Commun. Mass Spectrom. 14, 585–589. doi:10.1002/(sici)1097- Climate Change in Northern Japan over the Past 2,000 Years. Geochem.
0231(20000415)14:73.0.co;2-n Geophys. Geosyst. [Epub ahead of print].
Huguet, C., Hopmans, E. C., Febo-Ayala, W., Thompson, D. H., Sinninghe Damsté, Schmidt, M., Leipe, C., Becker, F., Goslar, T., Hoelzmann, P., Mingram, J., et al.
J. S., and Schouten, S. (2006). An Improved Method to Determine the Absolute (2019). A Multi-Proxy Palaeolimnological Record of the Last 16,600 Years from
Abundance of Glycerol Dibiphytanyl Glycerol Tetraether Lipids. Org. Geochem. Coastal Lake Kushu in Northern Japan. Palaeogeogr. Palaeoclimatol. Palaeoecol.
37, 1036–1041. doi:10.1016/j.orggeochem.2006.05.008 514, 613–626. doi:10.1016/j.palaeo.2018.11.010
Igarashi, Y. (2013). Holocene Vegetation and Climate on Hokkaido Island, Schouten, S., Hopmans, E. C., Rosell-Melé, A., Pearson, A., Adam, P., Bauersachs,
Northern Japan. Quat. Int. 290-291, 139–150. T., et al. (2013). An Interlaboratory Study of TEX86and BIT Analysis of
Inagaki, M., Yamamoto, M., Igarashi, Y., and Ikehara, K. (2009). Biomarker Sediments, Extracts, and Standard Mixtures. Geochem. Geophys. Geosyst. 14,
Records From Core GH02-1030 Off Tokachi in the Northwestern Pacific 5263–5285. doi:10.1002/2013gc004904
Over the Last 23,000 Years: Environmental Changes during the Last Schouten, S., Hopmans, E. C., and Sinninghe Damsté, J. S. (2012). The Organic
Deglaciation. J. Oceanogr. 65, 847–858. doi:10.1007/s10872-009-0070-4 Geochemistry of Glycerol Dialkyl Glycerol Tetraether Lipids: A Review. Org.
Isono, D., Yamamoto, M., Irino, T., Oba, T., Murayama, M., Nakamura, T., et al. Geochem. 54, 19–61. doi:10.1016/j.orggeochem.2012.09.006
(2009). The 1500-year Climate Oscillation in the Midlatitude North Pacific Schubert, B. A., and Jahren, A. H. (2015). Global Increase in Plant Carbon Isotope
During the Holocene. Geology 37, 591–594. doi:10.1130/g25667a.1 Fractionation Following the Last Glacial Maximum Caused by Increase in
Jouzel, J., Koster, R. D., Suozzo, R. J., and Russell, G. L. (1994). Stable Water Atmospheric pCO2. Geology 43, 435–438. doi:10.1130/g36467.1
Isotope Behavior during the Last Glacial Maximum: A General Circulation Sinninghe Damsté, J. S. (2016). Spatial Heterogeneity of Sources of Branched
Model Analysis. J. Geophys. Res. 99 (D12), 25791–25801. doi:10.1029/ Tetraethers in Shelf Systems: The Geochemistry of Tetraethers in the Berau
94jd01819 River delta (Kalimantan, Indonesia). Geochim. Cosmochim. Acta 186, 13–31.
Kawamura, R., Sugi, M., Kayahara, T., and Sato, N. (1998). Recent Extraordinary Cool doi:10.1016/j.gca.2016.04.033
and Hot Summers in East Asia Simulated by an Ensemble Climate Experiment. Sugimoto, A., Higuchi, K., and Kusakabe, M. (1988). Relationship between δD and
J. Meteorol. Soc. Japan 76, 597–617. doi:10.2151/jmsj1965.76.4_597 δ18O Values of Falling Snow Particles from a Separate Cloud. Tellus 40B,
Keeling, R. F., Graven, H. D., Welp, L. R., Resplandy, L., Bi, J., Piper, S. C., et al. 205–213. doi:10.1111/j.1600-0889.1988.tb00290.x
(2017). Atmospheric Evidence for a Global Secular Increase in Carbon Isotopic Tipple, B. J., and Pagani, M. (2013). Environmental Control on Eastern Broadleaf
Discrimination of Land Photosynthesis. Proc. Natl. Acad. Sci. U.S.A. 114, forest Species’ Leaf Wax Distributions and D/H Ratios. Geochim. Cosmochim.
10361–10366. doi:10.1073/pnas.1619240114 Acta 111, 64–77. doi:10.1016/j.gca.2012.10.042
Koizumi, I., Tada, R., Narita, H., Irino, T., Aramaki, T., Oba, T., et al. (2006). Yamamoto, M., Oba, T., Shimamune, J., and Ueshima, T. (2004). Orbital-Scale
Paleoceanographic History Around the Tsugaru Strait Between the Japan Sea Anti-Phase Variation of Sea Surface Temperature in Mid-Latitude North
and the Northwest Pacific Ocean since 30 cal kyr BP. Palaeogeogr. Pacific Margins During the Last 145,000 Years. Geophys. Res. Lett. 31,
Palaeoclimatol. Palaeoecol. 232, 36–52. doi:10.1016/j.palaeo.2005.09.003 L16311. doi:10.1029/2004gl020138
Leipe, C., Müller, S., Hille, K., Kato, H., Kobe, F., Schmidt, M., et al. (2018). Yamamoto, M. (2009). Response of Mid-Latitude North Pacific Surface
Vegetation Change and Human Impacts on Rebun Island (Northwest Pacific) Temperatures to Orbital Forcing and Linkage to the East Asian Summer
over the Last 6000 Years. Quat. Sci. Rev. 193, 129–144. doi:10.1016/j.quascirev. Monsoon and Tropical Ocean-Atmosphere Interactions. J. Quat. Sci. 24,
2018.06.011 836–847. doi:10.1002/jqs.1255
Li, X., Sugimoto, A., and Ueta, A. (2017). Spatial and Temporal Variations of Stable Yamamoto, M., Suemune, R., and Oba, T. (2005). Equatorward Shift of the
Isotopes in Precipitation in Midlatitude Coastal Regions. Hydrol. Process. 31, Subarctic Boundary in the Northwestern Pacific During the Last
3029–3044. doi:10.1002/hyp.11222 Deglaciation. Geophys. Res. Lett. 32, L05609. doi:10.1029/2004gl021903
Minoshima, K., Kawahata, H., and Ikehara, K. (2007). Changes in Biological
Production in the Mixed Water Region (MWR) of the Northwestern North Conflict of Interest: The authors declare that the research was conducted in the
Pacific during the Last 27 Kyr. Palaeogeogr. Palaeoclimatol. Palaeoecol. 254, absence of any commercial or financial relationships that could be construed as a
430–447. doi:10.1016/j.palaeo.2007.06.022 potential conflict of interest.
Müller, S., Schmidt, M., Kossler, A., Leipe, C., Irino, T., Yamamoto, M., et al.
(2016). Palaeobotanical Records From Rebun Island and Their Potential for Copyright © 2021 Yamamoto, Wang, Irino, Suzuki, Yamada, Haraguchi, Gotanda,
Improving the Chronological Control and Understanding Human- Yonenobu, Chen and Tarasov. This is an open-access article distributed under the
Environment Interactions in the Hokkaido Region, Japan. The Holocene 26, terms of the Creative Commons Attribution License (CC BY). The use, distribution
1646–1660. doi:10.1177/0959683616641738 or reproduction in other forums is permitted, provided the original author(s) and the
Nitta, T. (1987). Convective Activities in the Tropical Western Pacific and Their copyright owner(s) are credited and that the original publication in this journal is
Impact on the Northern Hemisphere Summer Circulation. J. Meteorol. Soc. cited, in accordance with accepted academic practice. No use, distribution or
Japan 65, 373–390. doi:10.2151/jmsj1965.65.3_373 reproduction is permitted which does not comply with these terms.
Frontiers in Earth Science | www.frontiersin.org 12 June 2021 | Volume 9 | Article 704332You can also read