Dynamics of inhaled corticosteroid use are associated with asthma attacks
←
→
Page content transcription
If your browser does not render page correctly, please read the page content below
www.nature.com/scientificreports
OPEN Dynamics of inhaled corticosteroid
use are associated with asthma
attacks
Joy Lee1,2*, Jacqueline Huvanandana3, Juliet M. Foster3, Helen K. Reddel3,
Michael J. Abramson1,2, Cindy Thamrin3,4 & Mark Hew1,2,4
Inhaled corticosteroids (ICS) suppress eosinophilic airway inflammation in asthma, but patients may
not adhere to prescribed use. Mean adherence—averaging total doses taken over prescribed—fails
to capture many aspects of adherence. Patients with difficult-to-treat asthma underwent electronic
monitoring of ICS, with data collected over 50 days. These were used to calculate entropy (H) a
measure of irregular inhaler use over this period, defined in terms of transitional probabilities between
different levels of adherence, further partitioned into increasing (Hinc) or decreasing (Hdec) adherence.
Mean adherence, time between actuations (Gapmax), and cumulative time- and dose-based variability
(area-under-the-curve) were measured. Associations between adherence metrics and 6-month
asthma status and attacks were assessed. Only H and Hdec were associated with poor baseline status
and 6-month outcomes: H and Hdec correlated negatively with baseline quality of life (H:Spearman
rS = − 0·330, p = 0·019, Hdec:rS = − 0·385, p = 0·006) and symptom control (H:rS = − 0·288, p = 0·041, Hdec:
rS = − 0·351, p = 0·012). H was associated with subsequent asthma attacks requiring hospitalisation
(Wilcoxon Z-statistic = − 2.34, p = 0·019), and Hdec with subsequent asthma attacks of other severities.
Significant associations were maintained in multivariable analyses, except when adjusted for blood
eosinophils. Entropy analysis may provide insight into adherence behavior, and guide assessment and
improvement of adherence in uncontrolled asthma.
Abbreviations
ACT Asthma control test
AQLQ Asthma quality of life questionnaire
AUC Area under the curve
EMD Electronic monitoring device
FEV1 Forced expiratory volume in one second
FeNO Fraction of exhaled nitric oxide
FVC Forced vital capacity
GP General practitioner
H Entropy
Hdec Decreasing entropy states
Hinc Increasing entropy states
ICS Inhaled corticosteroids
IgE Immunoglobulin E
OCS Oral corticosteroids
PT mean Conventional mean adherence
SABA Short acting bronchodilator
In asthma, regular inhaled corticosteroid (ICS) controller use suppresses eosinophilic airway inflammation and
reduces airway hyperresponsiveness, reducing symptoms and protecting patients from potentially life-threatening
1
Allergy, Asthma and Clinical Immunology, The Alfred Hospital, Alfred Health, 55 Commercial Road, Prahran,
Melbourne, VIC 3183, Australia. 2School of Public Health & Preventive Medicine, Monash University, 553 St Kilda
Road, Melbourne, VIC, Australia. 3The Woolcock Institute of Medical Research and The University of Sydney,
431 Glebe Point Road, Sydney, NSW, Australia. 4These authors contributed equally: Cindy Thamrin and Mark
Hew. *email: joy.lee@alfred.org.au
Scientific Reports | (2021) 11:14715 | https://doi.org/10.1038/s41598-021-94219-z 1
Vol.:(0123456789)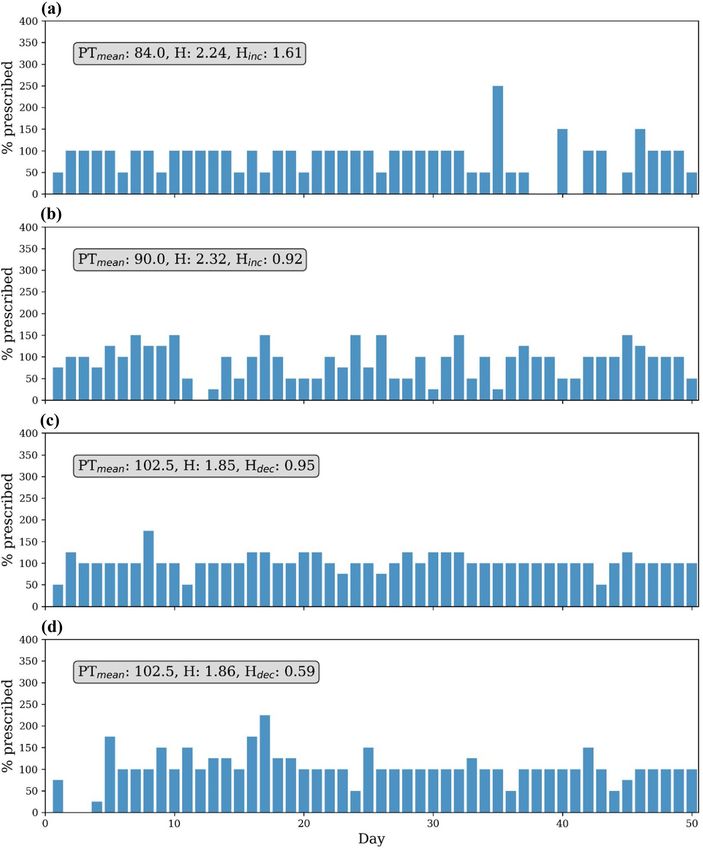
www.nature.com/scientificreports/
Figure 1. Assessment protocol timeline, visits and clinical measures. EMD electronic monitoring device, ACT
asthma control test, AQLQ asthma quality of life. (Microsoft Powerpoint, version 2101, https://office.live.com/
start/powerpoint.aspx).
attacks1,2. Asthma that remains uncontrolled despite the use of high-dose ICS-based controller is regarded as
‘difficult-to-treat’, and presents a complex clinical challenge3.
Medication adherence describes the extent to which patients use medication as prescribed4,5. In difficult-
to-treat asthma, patients frequently deviate from prescribed u se6,7. This can be tracked objectively by attaching
electronic monitoring devices (EMDs) to a patient’s inhaler, recording the date and time of each a ctuation8. In
future, electronic monitors may be routinely integrated into inhalers during m anufacture9.
Clarifying the interplay between poor adherence and adverse outcomes could help improve adherence and
enhance patient health. So far, work has focused on time-averaged metrics, typically mean adherence (total doses
taken/total doses prescribed) and it has been difficult to demonstrate a relationship between asthma outcomes
and mean adherence10,11. This averaged metric fails to capture potentially important variations in medication-
taking behaviour, e.g. a mean adherence rate of 50% cannot distinguish between one patient consistently taking
half the prescribed dose daily and another taking the full prescribed dose, but for only half the required period.
Other metrics do take into account either the interval between doses, or the time above a minimum dose
threshold, and some have shown a relationship to attack rates in airways d iseases10,12. However, these strategies
still only represent summative time-averaged metrics, and do not describe day-to-day deviations from regular
prescribed usage.
We designed adherence metrics to capture via EMD the extent to which patients with difficult-to-treat asthma
deviate from regular controller usage, by measuring the entropy—irregularity, or disorder—with which daily
medication doses are taken. The concept of entropy is derived from information theory where it is used to quan-
tify the ‘information’ in a process. Entropy has been previously applied to respiratory symptoms13, breathing pat-
terns, and lung f unction14. We examined whether these entropy measures of adherence related to specific patient
characteristics or predicted subsequent asthma-related clinical outcomes. For comparison, we also measured
conventional mean adherence, time- and dose-based variability (using additional metrics reflecting missed days
and incomplete doses respectively), and the duration of gaps in which patients completely forwent medication.
We hypothesised that the degree of irregularity of ICS controller usage may be more relevant in difficult-
to-treat asthma, and better predict poor outcomes. Highly disordered medication-taking behaviour may place
patients at higher clinical risk and may be associated with poorer outcomes.
Methods
Study participants. Our tertiary centre receives referrals of adults with difficult-to-treat asthma from spe-
cialists in secondary care17. Patients underwent multidisciplinary assessment according to a pre-specified proto-
col over three visits over six months—previously reported in detail18–22—to confirm asthma diagnosis, address
comorbidities, and optimise treatment (Fig. 1).
Inhaler technique was reviewed and optimised.
Electronic devices. A compatible EMD (Adherium, Auckland, New Zealand) was fitted to the patient’s
ICS-containing controller inhaler at visit one (day 0) and EMD-collected ICS data were uploaded at visit two
Scientific Reports | (2021) 11:14715 | https://doi.org/10.1038/s41598-021-94219-z 2
Vol:.(1234567890)
www.nature.com/scientificreports/
(approximately day 60, Fig. 1). Outcomes were assessed at visit 3 (~ 180 days). EMDs were available for budeso-
nide/formoterol (Turbuhaler and Rapihaler) and fluticasone proprionate/salmeterol (metered dose inhaler and
Accuhaler). To allow uninterrupted monitoring, participants were instructed how to move the EMD if they were
to change their inhaler. Audiovisual reminders were not activated during the study period but participants could
access 7-day EMD data on their devices.
Clinical outcomes. Evaluation included the Asthma Control T
est23 and Asthma Quality of Life
Questionnaire24 (with permission) at baseline (visit one) and 6 months (visit three) (Fig. 1). Patients were asked
to recall the number of attacks in the 6 months prior to visit one, and again, in the 6-month period prior to visit
three. Attacks were then confirmed by medical and prescription records where possible. Attacks were also cat-
egorised by severity, defined by worsening asthma symptoms requiring: a visit to the general practitioner (least
severe); a course (or an increased dose) of oral corticosteroids (OCS; more severe); or hospitalisation (most
severe). It was also noted if hospitalization required intensive care admission. Frequency of short acting bron-
chodilator use over the past four weeks prior to visit one were self-reported and recorded in terms of days and
nights per week, as well as number of puffs per day and night.
Patients who completed three visits between August 2015 and February 2018 were eligible for study inclusion.
All study protocols and data analysis were approved by the Alfred Health Ethics Committee (285/15) and the
Monash University Human Research Ethics Committee (MUHREC). As data were collected as part of routine
clinical care and audit, the requirement for signed informed consent was waived by the Alfred Health Ethics
Committee. All methods were carried out in accordance with relevant guidelines and regulations as governed
by the Australian Health Practitioner Regulation Agency (AHPRA).
Adherence metrics. Metrics were quantified using Python (Python Software Foundation, version 3·6). For
standardisation, the first 50 days of available data were extracted for each patient (Fig. 1); this excluded any
days with missing data (defined as days when inhaler was not attached—logged by the device as distinct to zero
adherence). As the EMD was returned at visit two, adherence data were not available to day 180. Last observa-
tion carried forward was not performed to minimise the risk of introducing bias into the adherence metrics,
particularly entropy.
Entropy (H), a measure of disorder, was adapted to the adherence data to reflect the various ways in which
the patients changed their ICS-taking behavior from day to day. In information theory, a ‘Markov chain’ can be
used to describe the sequence of occurrences of certain ‘states’ and the probabilities of transitioning from one
state to another given the previous state (e.g. the appearance of specific sequences of letters in a message). H is
then used to quantify the complexity of the information, in terms of the transitional probabilities between states,
for all possible states observed. Here, we classified adherence into different levels, which are analogous to the
different states of a Markov chain, similar to an approach previously applied to respiratory symptoms13. Given
an adherence time series x, where x is the dose taken/prescribed dose expressed as a percentage, we obtained a
state-based series by mapping each element of x i to the state space S = {1,2,3,4,5,6,7} as follows:
State, si Dose range
1 xi = 0%
2 0www.nature.com/scientificreports/
Figure 2. Calculation of entropy. Panel (a) shows a perfectly-adherent time series (green) in the background
comprising 100% of prescribed puffs for 100% of the time, and an example patient time series (blue) overlaid
atop the perfectly-adherent series, with instances of under- and over-adherence, both mapped to the state-based
series. Panel (b) displays the corresponding transitional probability matrix, while panel (c) allows us to visualise
the same matrix (and the “disorder”)
in a 3-dimensional graph. The entropy of the transitional probability
matrix is then calculated as N−1i,j=0 Pi,j (−ln(Pi,j )). (Python Software Foundation, version 3·6 http://www.python.
org).
sum of every day when medication was taken. Thus, perfect time adherence corresponded to a straight line with
an area under the curve normalised to 100%. The time-based AUC (T-AUC) for an individual patient was taken
as the difference between their time adherence curve and the perfect curve, expressed as a percentage deviation
from 100%. In this way, the T-AUC described how consistently the patient took any medication over time. The
use of the cumulative sum meant that earlier and/or larger gaps have greater effects on the T-AUC. Similarly,
the dose-based area AUC (D-AUC) described the cumulative deviation from the patient’s total prescribed dose
over the same 50-day period. We also multiplied the time-based deviation and the dose-based adherence for
each day, to construct a composite curve. The Prod-AUC was then calculated as the cumulative deviation from
the product of the perfect time x dose curves. This metric thus reflects adherence behavior in terms of both time
and doses taken over the given time period.
The Gapmax metric described the maximum length of gaps between days when medication was last taken,
regardless of number of puffs within a day, during the 50-day period.
Statistical analysis. Relationships between adherence metrics and clinical characteristics (at baseline) and
asthma outcomes (at/over six months) were examined using Spearman rank correlation (rs) for continuous
variables, and Wilcoxon rank sum or Kruskal–Wallis tests for comparisons between 2 groups or > 2 groups,
respectively. Multivariable regression was performed to confirm if any significant associations between adher-
ence metrics and clinical characteristics and asthma outcomes identified from univariate analyses were still
independent predictors after adjusting for the potential confounders of age, sex, baseline eosinophils and base-
line lung function. Adjustment for baseline asthma questionnaire scores (AQLQ and ACT) was undertaken
where the respective asthma questionnaire score was the outcome.
Scientific Reports | (2021) 11:14715 | https://doi.org/10.1038/s41598-021-94219-z 4
Vol:.(1234567890)www.nature.com/scientificreports/
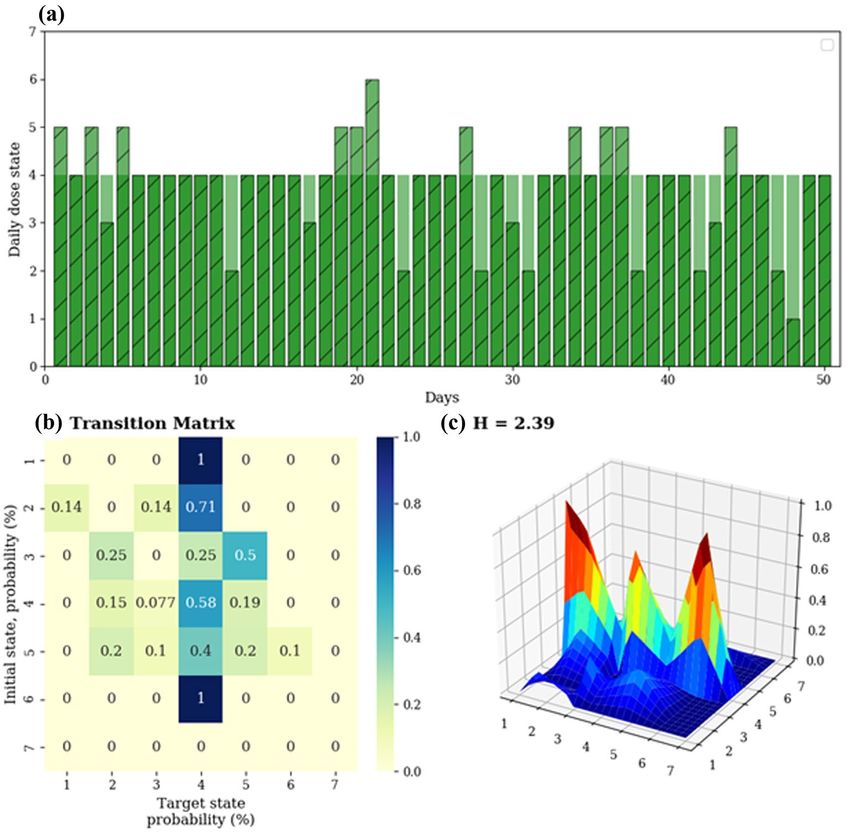
Figure 3. Sample adherence time series from 4 different patients over the study period. All patients had ‘good
adherence’ as defined by mean adherence PTmean (note not capped at 100% for the purpose of demonstrating
variability), however with different increasing and decreasing entropy ( Hinc and Hdec) measures, which better
reflect the variability in patient inhaler adherence behaviour. Panel (a) demonstrates a patient who took their
inhaled controller on average 84% of prescribed doses with calculated entropy 2.24 and increasing entropy
1.61. Panel (b) demonstrates a second patient who took their controller 90% of prescribed doses, with
calculated entropy of 2.32 and increasing entropy of 0.92. Panel (c) demonstrates a third patient who took their
controller 102.5% of prescribe doses, with calculated entropy of 1.85 and decreasing entropy of 0.95. Panel (d)
demonstrates a fourth patient who took their controller 102.5% of prescribed doses, with calculated entropy of
1.86 and decreasing entropy of 0.59. (Python Software Foundation, version 3·6 http://www.python.org).
Statistical analysis was undertaken in R version 3·325. Descriptive statistics are presented as proportions for
categorical variables, means and standard deviations for normally distributed continuous variables, or medians
and interquartile ranges otherwise.
Scientific Reports | (2021) 11:14715 | https://doi.org/10.1038/s41598-021-94219-z 5
Vol.:(0123456789)www.nature.com/scientificreports/
Figure 4. Consort diagram demonstrating flow of participants through the study. EMD electronic monitoring
device. †Due to EMD detachment. (Microsoft Powerpoint, version 2101, https://office.live.com/start/power
point.aspx).
Results
Participants. Systematic assessment was undertaken by 108 patients. Forty (37%) did not receive a moni-
toring device: four (3.7%) from physician choice, two (1.9%) declined, two (1.9%) did not have asthma (and
were diagnosed with vocal cord dysfunction), and 32 (29%) had inhalers with no compatible EMDs available in
Australia. Among 68 patients who underwent inhaler monitoring, 11 (16.2%) devices had less than 50 days of
data due to device detachment, and 4 (5.9%) devices malfunctioned (Fig. 4). These patients were excluded from
the analysis. Of the 11 devices with missing data, the mean number of days monitored was 37, (SD 69, range
3–220 days).
Data were analysed from 53 patients (Table 1).
Adherence metrics and baseline clinical characteristics. Summary statistics of adherence metrics
calculated for the first 50 days in all patients are reported in supplemental Table S1. No adherence metric was
related to age, sex or baseline lung function on correlation testing (Supplemental Table S2). PTmean,cap correlated
with baseline asthma quality of life as measured by AQLQ (Spearman correlation, r S = 0·284, p = 0·046). Large
gaps in inhaler use (Gapmax) and lower T-AUC were associated with a greater likelihood of previous intensive
care or hospitalisation for an asthma attack in the six-month period prior to visit one (Wilcoxon rank sum test),
Gapmax: Z = − 2.068, p = 0·039 and Z = − 2.08, p = 0·037 respectively, T-AUC: Z = − 2.065, p = 0·039 and Z = − 2.042,
p = 0·041 respectively).
Regarding entropy, higher H correlated negatively with baseline AQLQ and ACT scores (rS = − 0·330, p = 0·019
and rS = − 0·288, p = 0·041 respectively). Higher Hdec similarly correlated negatively with baseline AQLQ and
ACT (rS = -0·385, p = 0·006 and rS = − 0·351, p = 0·012 respectively), and was further associated with higher SABA
reliever use in terms of puffs and days per week ( rS = 0·318, p = 0·02 and rS = 0·286, p = 0·04 respectively).
The relationships between entropy measures (H and H dec) and baseline ACT and reliever use remained sig-
nificant following multivariable regression models adjusting for age, sex, baseline eosinophil count and baseline
FEV, while all other measures did not (Table 2).
Adherence metrics and subsequent outcomes at six months. Among all adherence metrics, only
measures of entropy, measured in the first 50 days, were associated with asthma outcomes at six months (Supple-
mental Table S3). Higher H was associated with more asthma attacks requiring hospitalisation over six months
Scientific Reports | (2021) 11:14715 | https://doi.org/10.1038/s41598-021-94219-z 6
Vol:.(1234567890)www.nature.com/scientificreports/
Total n = 53
Demographics
Age years, mean (range, SD) 51 (19–77, 15)
Gender Female, n (%) 29 (55)
Body mass index kg/m2, mean (SD) 32 (8)
Smoking status
Never 33 (62.3)
Ex-smoker 17 (32.1)
Current smoker 2 (3.8)
Asthma medications, n(%)
Short acting muscarinic antagonist 4 (7.5)
Long acting beta agonist 1 (1.9%)
Inhaled corticosteroid 20 (37.7%)
Inhaled corticosteroid/long acting beta agonist combination 52 (98.1%)
Leukotriene receptor antagonist 10 (18.9%)
Long acting muscarinic antagonist 19 (35.8%)
Oral corticosteroids 10 (18.9%)
Theophylline 2 (3.8%)
Omalizumab (anti-IgE monoclonal antibody) 2 (3.8%)
Total number asthma medications, mean, range (SD) 2.3, 1–6 (1.2)
Total daily ICS dose mcg, mean, range (SD) 969, 200–2000 (475)
Asthma severity
Pre-bronchodilator FEV1% predicted, mean (SD) 64 (21)
FEV1/FVC ratio 61 (16)
ACT score at visit one, median (IQR) (23) 11 (9–16·5)
AQLQ score at visit one, mean (SD) (24) 4 (1·2)
On high dose inhaled corticosteroids*, n(%) 44 (83)
Asthma attack rate
Baseline attack number in the six months prior to visit one (mean, SD)
Requiring oral corticosteroids 2.5 (2)
Requiring GP visit 2.4 (3.7)
Requiring ED presentation 0.8 (1.3)
Requiring hospital admission 0.4 (1)
Attack rate in the six months prior to visit three (mean, SD)
Requiring oral corticosteroids 1.7 (2.9)
Requiring GP visit 2 (5.8)
Requiring ED presentation 0.4 (1)
Requiring hospital admission 0.3 (0.8)
Asthma phenotype
FeNO result ppb, mean (range, SD) 35 (5–137, 32)
IgE kU/L, mean (range, SD) 528 (4–4304, 913)
Atopic (positive skin prick test or serum specific IgE to commonly tested aeroallergens), n(%) 37 (70)
Blood eosinophils × 109/L, mean (range, SD) 0·37 (0–1·18, 0·31)
Table 1. Baseline patient characteristics. FEV1:Forced expiratory volume in one second, FVC forced vital
capacity, ACTAsthma Control Test (scores range from 5 (poor asthma control) to 25 (complete asthma
control), scores > 19 indicate well controlled asthma), AQLQ asthma quality of life questionnaire (out of 7,
high score indicating better quality of life). FeNO fraction of expired nitric oxide, IgE immunoglobulin E, GP
General practitioner, ED emergency department. *Fluticasone propionate equivalent ≥ 500mcg daily.
prior to visit three (Z = − 2.34, p = 0·019, Fig. 5a).Higher Hdec was associated with more asthma attacks over the
six months prior to visit three, requiring a visit to a general practitioner (Z = − 2.43, p = 0·015), oral corticoster-
oids (Z = − 2.508, p = 0·012), or hospitalisation (Z = − 2.07, p = 0·038, Fig. 5b–d). (All comparisons performed by
Wilcoxon Rank Sums Test).
For regression analysis, it was only possible to adjust for one confounder at a time, due to the amount
of patient data available at 6 months. Relationships between H and asthma attacks requiring hospitalisation
remained significant regardless of adjustment for age, sex and baseline F EV1 (Table 3). Similarly, relationships
between Hdec and attacks requiring oral corticosteroids or general practitioner visits also remained significant
with these adjustments (Table 3) and also when adjusted for baseline number of attacks in the six months prior
Scientific Reports | (2021) 11:14715 | https://doi.org/10.1038/s41598-021-94219-z 7
Vol.:(0123456789)www.nature.com/scientificreports/
Baseline measures (adjusted for age, sex, peripheral blood eosinophils and FEV1)
Adherence metric Baseline measure Coefficient [SE] p value
Mean adherence ( PTmean,cap) AQLQ 0·19 [0.20] 0·36
ACT − 0·49 [0·17] 0·008
Entropy (H)
AQLQ − 0·29 [0·15] 0·065
ACT − 0·51 [0·21] 0·026
Decreasing Entropy (Hdec) AQLQ − 0·35 [0·19] 0·068
Reliever use, puffs per week 0·60 [0·28] 0·04
Table 2. Multivariable analysis relating adherence metrics to baseline clinical characteristics. Adherence
metrics and baseline measures reported here are those which showed significant associations in univariate
analyses. AQLQ Asthma quality of life questionnaire, ACTasthma control test.
Figure 5. Entropy metrics (over day 0–50) predict asthma outcomes (over days 0–180). Panel (a): Entropy (H)
and attacks requiring hospitalisation. Panels (b–d): Decreasing entropy ( Hdec) and attacks requiring general
practitioner (GP) visit, oral corticosteroids or hospitalisation respectively. The boxes depict the 25th, 50th, and
75th percentiles while the whiskers depict the minimum and maximum values in the data. The individual data
points are also shown as dots. (R version 3·3 https://www.R-project.org/).
to visit one requiring oral corticosteroids (0.92, SE 0.38, p = 0.017), GP visit (1.06, SE 0.45, p = 0.018) or hospi-
talization (1.39, SE 0.68 p = 0.041). (Spearman coefficients reported).
However, after adjustment for baseline eosinophil count, the relationships between H or Hdec and attacks at
six months were no longer significant. Further examination showed that H (but not Hdec) was correlated with
baseline eosinophil count ( rS = 0·352, p = 0·045) suggesting collinearity between baseline eosinophils and H.
Scientific Reports | (2021) 11:14715 | https://doi.org/10.1038/s41598-021-94219-z 8
Vol:.(1234567890)www.nature.com/scientificreports/
Six-month outcomes (adjusted for age, sex, peripheral blood eosinophils and FEV1)
Coefficient [SE] (p value) when adjusted for
Outcome measure at
Adherence metric 6 months Age Sex Blood Eosinophils FEV1
Attacks requiring 1·35 [0·68] 1·34 [0·68] 2·37 [1·50] 1·4 [0·69]
Entropy (H)
hospitalisation (p = 0·046) (p = 0·047) (p = 0·113) (p = 0·044)
Attacks requiring 0·98 [0·49] 0·98 [0·43] 0·91 [0·48] 1·03 [0·43]
GP visit (p = 0·045) (p = 0·021) (p = 0·059) (p = 0·017)
Decreasing Entropy Attacks requiring oral 0·83 [0·39] 0·91 [0·38] 0·50 [0·46] 0·99 [0·40]
(Hdec) corticosteroids (p = 0·034) (p = 0·017) (p = 0·284) (p = 0·014)
Attacks requiring 1·11 [0·60] 1·07 [0·59] 0·82 [0·69] 1·10 [0·58]
hospitalisation (p = 0·064) (p = 0·068) (p = 0·231) (p = 0·058)
Table 3. Multivariable analysis relating adherence metrics to 6 month outcomes. GP general practitioner.
Adherence metrics and outcome measures reported here are those which showed significant associations in
univariate analyses.
Discussion
With increasing emphasis on inhaler adherence monitoring in airways diseases, particularly in the era of biologic
therapies for severe asthma, there is a pressing need to identify the optimal metrics with which to measure inhaled
controller adherence7,26,27. We showed that disordered controller use in difficult-to-treat asthma—as reflected
by entropy analysis—reflected poor baseline asthma control and were associated with subsequent attacks of any
severity. This could potentially be mediated through unchecked eosinophilic inflammation.
Entropy measures have previously been used to describe respiratory symptoms and breathing patterns, with
higher entropy associated with adverse outcomes13,28. We designed entropy measures (H, Hdec and Hinc) to meas-
ure the irregularity of day-to-day dose-taking behaviour, analogous to the original use of H in information theory
to quantify the complexity in strings of t ext29. We used it to describe the diversity in patterns in observed transi-
tions in adherence, choosing to also examine irregularity or diversity in increases and decreases in adherence, as
they may be clinically relevant. In considering all (or a subset in the case of H dec and Hinc) of the elements in the
transitional probability matrix, our method of calculating H differs from that of Usemann et al., where entropy
was calculated from rows of elements and then averaged13. Nevertheless, H calculated using our method was
highly correlated with their method when applied to this dataset (r = 0·912, p < 0·001, data available on request).
To accommodate the original study design, we chose a period of 50 days to maximise participants with
sufficient data. This proof-of-concept study justifies validation in larger cohorts and the development of more
dynamic measures of entropy, similar to our previous work on peak flows to predict a ttacks30.
Entropy metrics, specifically in relation to decreasing states ( Hdec) over a 50-day period, related to worse
asthma control and increased short-acting reliever use at baseline. Notably, greater H dec also predicted subse-
quent risk of attacks of any severity, whether requiring general practitioner visit, increase in oral steroids, or
hospitalisation (the latter also predicted by H). That H dec, rather than Hinc, has these relationships suggests that
irregular drops in adherence may have more clinical impact than over-adherence. These relationships were no
longer significant when adjusting for baseline peripheral eosinophil levels. The correlation between H (though
not Hdec) and peripheral eosinophils suggests that higher baseline eosinophil counts may represent previous poor
adherence. We hypothesise that the same pattern of behaviour may then have continued during the period of
monitoring, with unchecked eosinophilic inflammation subsequently leading to asthma attacks. Previous studies
have demonstrated that peripheral eosinophils are an independent predictor for asthma a ttacks31. Within this
small study, baseline blood eosinophils did not predict asthma attacks at 6 months, nor was FeNO related to any
adherence measures (supplemental data).
While non-adherence can be intentional due to issues such as mistrust, lack of medication understanding,
fixed beliefs and cost, unintentional disordered medication use may also indicate a corresponding degree of
chaos in patients’ lives. In asthma, poor family routines accompanied diminished inhaler adherence in children32.
In post-myocardial infarct patients, ‘life-chaos’—a highly variable daily routine with an inability to plan and
anticipate the future, paralleled poor adherence to cardiac medication15. Similar life-chaos among patients with
HIV was associated with increased health care use and missed clinic a ppointments16. We speculate that the
extent of entropy in controller use in difficult-to-treat asthma may also reflect overall life-chaos. Measurement of
entropy in inhaled controller use could be used in the clinic setting to target patients particularly with high H dec
for adherence interventions. Such patients may have otherwise been missed if conventional averaged adherence
measures were used (Fig. 3). Entropy measures may also prompt the clinician to review the wider social situation
of the patient for other indicators of ‘life chaos’.
As anticipated, conventional mean adherence (PTmean,cap) in our study (following adjustment for potential
confounders) was not related to baseline asthma status, nor predicted longitudinal outcomes.
Similarly, neither variability in dosage nor timing metric was associated with clinically important outcomes
(Supplemental tables S2 and S3). In a previous analysis of a clinical trial in moderate asthma, the use of AUC-
based metrics did relate to asthma-related quality of life and lung function by peak flow measurement10. Note
that our AUC metrics were based upon, but were not directly comparable to previously-published m ethods10,
which accounted for technique/device errors using a specialised INCA device. Furthermore, our study cohort
included consecutive patients drawn from clinical practice.
Scientific Reports | (2021) 11:14715 | https://doi.org/10.1038/s41598-021-94219-z 9
Vol.:(0123456789)www.nature.com/scientificreports/
Our patient population had significant disease with poorly controlled symptoms and high exacerbation
rates, despite having previously been assessed by respiratory specialists. We have previously demonstrated that
this population still has high non-adherence rates despite specialist intervention. Our results are likely to be
representative of difficult-to-treat asthma patients encountered in the ‘real world’, but may not represent less
severe patients. The association of entropy with other behaviour that can affect adherence such as mistrust of
medication, financial barriers, and not attending a pharmacy access to refill prescriptions would be worth pur-
suing with future research.
Limitations
Given the complexity of difficult-to-treat asthma, poor disease control may relate to a wide range of disease
and patient factors, e.g. biological severity, corticosteroid insensitivity, multimorbidity, poor self-management
skills—all addressed in our clinic’s systematic protocol33–35. Notwithstanding the presence of such confounding
issues, a significant effect of disordered controller use on risk of asthma attack remained detectable. However,
it is possible our single-center study had insufficient statistical power from a reduction in data available due to
device incompatibility device malfunction, missing data, small sample size and short duration of data collection,
to detect weaker associations. We also relied on patient recollection for asthma attack history which could be
inaccurate, although these data were verified when available in medical records. We explored a range of metrics,
baseline characteristics, and asthma outcomes, so increasing the likelihood of a chance finding. However, the
consistent pattern of results and their persistence following adjustment for confounding both support a true
result. We only collected adherence data between visit one and two of our study (most consistently for 50 days),
and analysed outcomes at day 180 (visit three). It is possible that adherence would have improved beyond 50 days,
however we wished to analyse the impact of the patient’s initial adherence behaviour on future asthma outcomes.
It is likely other aspects of adherence behaviour would add to the predictive power of entropy measures; larger
validation datasets would enable further exploration as well as control for other possible confounders in the same
model. Future studies could also explore the impact of patient socioeconomic status or device polypharmacy on
entropy of inhaled controller use as well as examine aspects of ‘life chaos’ more qualitatively.
Conclusions
We showed higher irregularity assessed by entropy in controller use of patients with difficult-to-treat asthma,
with effects that appear mediated through eosinophilic inflammation, and were associated with an increased
risk of future attacks. Entropy may reflect the ‘life chaos’ experienced by people with difficult-to-treat asthma, a
possible target for appropriate intervention. Entropy analysis could guide future approaches to improve adher-
ence and enhance patient health, potentially applicable to other domains of respiratory or other chronic disease.
Received: 18 September 2020; Accepted: 30 June 2021
References
1. Barnes, P. J. Efficacy of inhaled corticosteroids in asthma. J. Allergy Clin. Immunol. 102, 531–538. https://doi.org/10.1016/S0091-
6749(98)70268-4 (1998).
2. Demarche, S. F. et al. Effectiveness of inhaled corticosteroids in real life on clinical outcomes, sputum cells and systemic inflamma-
tion in asthmatics: A retrospective cohort study in a secondary care centre. BMJ Open 7, e018186. https://doi.org/10.1136/bmjop
en-2017-018186 (2017).
3. GINA. Diagnosis and management of difficult-to-treat and severe asthma in adolescent and adult patients. (2019). Available online
at https://ginasthma.org/wp-content/uploads/2018/11/GINA-SA-FINAL-wms.pdf.
4. Vrijens, B. et al. What we mean when we talk about adherence in respiratory medicine. J. Allergy Clin. Immunol. Pract. 4, 802–812.
https://doi.org/10.1016/j.jaip.2016.05.019 (2016).
5. Kini, V. & Ho, P. M. Interventions to improve medication adherence. JAMA 320, 2461. https://doi.org/10.1001/jama.2018.19271
(2018).
6. Gamble, J., Stevenson, M., McClean, E. & Heaney, L. G. The prevalence of nonadherence in difficult asthma. Am. J. Respir. Crit.
Care Med. 180, 817–822. https://doi.org/10.1164/rccm.200902-0166oc (2009).
7. Lee, J. et al. Non-adherence in the era of severe asthma biologics and thermoplasty. Eur. Respir. J. 2, 2 (2018).
8. Foster, J. M. et al. The reliability and patient acceptability of the SmartTrack device: A new electronic monitor and reminder device
for metered dose inhalers. J. Asthma 49, 657–662. https://doi.org/10.3109/02770903.2012.684253 (2012).
9. Hew, M. & Reddel, H. K. Integrated adherence monitoring for inhaler medications. JAMA 321, 1045–1046. https://doi.org/10.
1001/jama.2019.1289 (2019).
10. Sulaiman, I. et al. A method to calculate adherence to inhaled therapy that reflects the changes in clinical features of asthma. Ann.
Am. Thorac. Soc. 13, 1894–1903. https://doi.org/10.1513/annalsats.201603-222oc (2016).
11. Foster, J. M. et al. Inhaler reminders improve adherence with controller treatment in primary care patients with asthma. J. Allergy
Clin. Immunol. 134, 1260-1268.e1263. https://doi.org/10.1016/j.jaci.2014.05.041 (2014).
12. Greene, G. et al. A novel statistical method for assessing effective adherence to medication and calculating optimal drug dosages.
PLoS ONE 13, e0195663–e0195663. https://doi.org/10.1371/journal.pone.0195663 (2018).
13. Usemann, J. et al. Dynamics of respiratory symptoms during infancy and associations with wheezing at school age. ERJ Open Res.
4, 00037–02018. https://doi.org/10.1183/23120541.00037-2018 (2018).
14. Bravi, A., Longtin, A. & Seely, A. J. E. Review and classification of variability analysis techniques with clinical applications. Biomed.
Eng. Online 10, 90. https://doi.org/10.1186/1475-925X-10-90 (2011).
15. Zullig Leah, L. et al. Association between perceived life chaos and medication adherence in a postmyocardial infarction popula-
tion. Circ. Cardiovasc. Qual. Outcomes 6, 619–625. https://doi.org/10.1161/CIRCOUTCOMES.113.000435 (2013).
16. Wong, M. D., Sarkisian, C. A., Davis, C., Kinsler, J. & Cunningham, W. E. The association between life chaos, health care use, and
health status among HIV-infected persons. J. Gen. Intern. Med. 22, 1286–1291. https://d oi.o
rg/1 0.1 007/s 11606-0 07-0 265-6 (2007).
17. Radhakrishna, N. et al. Profile of difficult to treat asthma patients referred for systematic assessment. Respir. Med. 117, 166–173.
https://doi.org/10.1016/j.rmed.2016.06.012 (2016).
Scientific Reports | (2021) 11:14715 | https://doi.org/10.1038/s41598-021-94219-z 10
Vol:.(1234567890)www.nature.com/scientificreports/
18. Denton, E. et al. Systematic assessment for difficult and severe asthma improves outcomes and halves oral corticosteroid burden
independent of monoclonal biologic use. J. Allergy Clin. Immunol. https://doi.org/10.1016/j.jaip.2019.12.037 (2020).
19. Denton, E. et al. Factors associated with dysfunctional breathing in patients with difficult to treat asthma. J. Allergy Clin. Immunol.
Pract. 7, 1471–1476. https://doi.org/10.1016/j.jaip.2018.11.037 (2018).
20. Lee, J. et al. Paradoxical vocal fold motion in difficult asthma is associated with dysfunctional breathing and preserved lung func-
tion. J. Allergy Clin. Immunol. Pract. 8, 2256–2262. https://doi.org/10.1016/j.jaip.2020.02.037 (2020).
21. Tay, T. R. et al. A structured approach to specialist-referred difficult asthma patients improves control of comorbidities and enhances
asthma outcomes. J. Allergy Clin. Immunol. Pract. https://doi.org/10.1016/j.jaip.2016.12.030 (2017).
22. Denton, E. et al. Severe asthma global evaluation (SAGE): An electronic platform for severe asthma. J. Allergy Clin. Immunol.
Pract. 7, 1440–1449. https://doi.org/10.1016/j.jaip.2019.02.042 (2019).
23. Nathan, R. A. et al. Development of the asthma control test☆A survey for assessing asthma control. J. Allergy Clin. Immunol. 113,
59–65. https://doi.org/10.1016/j.jaci.2003.09.008 (2004).
24. Juniper, E. F. et al. Evaluation of impairment of health related quality of life in asthma: Development of a questionnaire for use in
clinical trials. Thorax 47, 76–83. https://doi.org/10.1136/thx.47.2.76 (1992).
25. The R Project for Statistical Computing (2017).
26. Costello, R. W. & Cushen, B. Looking back to go forward: adherence to inhaled therapy before biologic therapy in severe asthma.
Eur. Respir. J. 55, 2000954. https://doi.org/10.1183/13993003.00954-2020 (2020).
27. Ancona, G. et al. Adherence to corticosteroids and clinical outcomes in mepolizumab therapy for severe asthma. Eur. Respir. J. 55,
1902259. https://doi.org/10.1183/13993003.02259-2019 (2020).
28. Engoren, M. Approximate entropy of respiratory rate and tidal volume during weaning from mechanical ventilation. Crit. Care
Med. 26, 2 (1998).
29. Shannon, C. E. A mathematical theory of communication. Bell Syst. Tech. J. 27, 379–423. https://d oi.o
rg/1 0.1 002/j.1 538-7 305.1 948.
tb01338.x (1948).
30. Thamrin, C. et al. Predicting future risk of asthma exacerbations using individual conditional probabilities. J. Allergy Clin. Immunol.
https://doi.org/10.1016/j.jaci.2011.01.018 (2011).
31. Zeiger, R. S. et al. High blood eosinophil count is a risk factor for future asthma exacerbations in adult persistent asthma. J. Allergy
Clin. Immunol. Pract. 2, 741–750. https://doi.org/10.1016/j.jaip.2014.06.005 (2014).
32. Fiese, B. H., Wamboldt, F. S. & Anbar, R. D. Family asthma management routines: Connections to medical adherence and quality
of life. J. Pediatr. 146, 171–176. https://doi.org/10.1016/j.jpeds.2004.08.083 (2005).
33. Hew, M. et al. Relative corticosteroid insensitivity of peripheral blood mononuclear cells in severe asthma. Am. J. Respir. Crit. Care
Med. 174, 134–141. https://doi.org/10.1164/rccm.200512-1930OC (2006).
34. Hew, M. & Heaney, L. G. In Severe Asthma [ERS Monograph] (eds Chung, K. F. et al.) 30–48 (European Respiratory Society, 2019).
35. Hew, M. et al. Systematic assessment of difficult-to-treat asthma: Principles and Perspectives. J. Allergy Clin. Immunol. Pract. 8,
2222–2233. https://doi.org/10.1016/j.jaip.2020.02.036 (2020).
Acknowledgements
We gratefully acknowledge the assistance of Fiona Hore-Lacy for patient coordination, and the Alfred difficult
asthma clinic nursing staff (Anna Mackay, Anita Hazard, Eddie Weber) for patient education.
Author contributions
The study was conceived by J.L., M.H., J.F. and C.T. Clinical data was collected by J.L. and M.H. Data, statistical
analysis and entropy calculations were performed by J.H. and C.T. Data interpretation was performed by all
authors. Figures were prepared by J.L., J.H. and C.T. Following input by all authors, the first draft was written by
M.H., J.L. and C.T. All authors participated in editing and discussion. Study supervision was by M.H. and C.T.
Competing interests
MJA holds investigator-initiated grants for unrelated research from Pfizer and Boehringer-Ingelheim. He has
undertaken an unrelated consultancy for and received assistance with conference attendance from Sanofi. He
has also received a speaker’s fee from GSK. HKR or her institute has received fees for providing independent
medical advice on advisory boards for AstraZeneca, GlaxoSmithKline, Boehringer Ingelheim, GlaxoSmithKline,
Novartis and Sanofi/Genzyme, for providing independent medical education at symposia funded by AstraZeneca,
Boehringer Ingelheim, GlaxoSmithKline, Mundipharma, Novartis and Teva, and research grants from AstraZen-
eca, GlaxoSmithKline and Novartis, all unrelated to this research. MH has received grants-in-aid, speaker fees,
and fees for serving on the advisory boards of GlaxoSmithKline, AstraZeneca, Novartis, Teva, Sanofi, and Seqirus,
all unrelated to the current manuscript, all paid to his institutional employer Alfred Health. JL has received fees
for providing unrelated independent medical advice for GlaxoSmithKline and has provided speaker fees for
medical education purposes from Boehringer Ingelheim, GlaxoSmithKline and AstraZeneca. HR reports grants
and personal fees from AstraZeneca, grants and personal fees from GlaxoSmithKline, personal fees from Merck,
grants and personal fees from Novartis, personal fees from Teva, personal fees from Boehringer Ingelheim,
personal fees from Sanofi Genzyme, outside the submitted work. CT is a NHMRC Career Development Fellow
(Level 1). JL received support through an Australian Government Research Training Program Scholarship. Both
funding sources had no role in study design, collection, analysis, interpretation of data, writing of the report of
decision to submit this manuscript for publication. JH and JF have no competing interests to disclose.
Additional information
Supplementary Information The online version contains supplementary material available at https://doi.org/
10.1038/s41598-021-94219-z.
Correspondence and requests for materials should be addressed to J.L.
Reprints and permissions information is available at www.nature.com/reprints.
Publisher’s note Springer Nature remains neutral with regard to jurisdictional claims in published maps and
institutional affiliations.
Scientific Reports | (2021) 11:14715 | https://doi.org/10.1038/s41598-021-94219-z 11
Vol.:(0123456789)www.nature.com/scientificreports/
Open Access This article is licensed under a Creative Commons Attribution 4.0 International
License, which permits use, sharing, adaptation, distribution and reproduction in any medium or
format, as long as you give appropriate credit to the original author(s) and the source, provide a link to the
Creative Commons licence, and indicate if changes were made. The images or other third party material in this
article are included in the article’s Creative Commons licence, unless indicated otherwise in a credit line to the
material. If material is not included in the article’s Creative Commons licence and your intended use is not
permitted by statutory regulation or exceeds the permitted use, you will need to obtain permission directly from
the copyright holder. To view a copy of this licence, visit http://creativecommons.org/licenses/by/4.0/.
© The Author(s) 2021
Scientific Reports | (2021) 11:14715 | https://doi.org/10.1038/s41598-021-94219-z 12
Vol:.(1234567890)You can also read