Effectiveness of Face Coverings in Mitigating the COVID-19 Pandemic in the United States - MDPI
←
→
Page content transcription
If your browser does not render page correctly, please read the page content below
International Journal of
               Environmental Research
               and Public Health

Article
Effectiveness of Face Coverings in Mitigating the COVID-19
Pandemic in the United States
Olukayode James Ayodeji                   and Seshadri Ramkumar *

                                          Department of Environmental Toxicology, The Institute of Environmental and Human Health,
                                          Texas Tech University, Lubbock, TX 79416, USA; James.Ayodeji@ttu.edu
                                          * Correspondence: s.ramkumar@ttu.edu; Tel.: +1-806-834-4336

                                          Abstract: The COVID-19 pandemic has been one of the biggest public health challenges of the 21st
                                          century. Many prevalent measures have been taken to prevent its spread and protect the public.
                                          However, the use of face coverings as an effective preventive measure remains contentious. The
                                          goal of the current study is to evaluate the effectiveness of face coverings as a protective measure.
                                          We examined the effectiveness of face coverings between 1 April and 31 December 2020. This was
                                          accomplished by analyzing trends of daily new COVID-19 cases, cumulative confirmed cases, and
                                          cases per 100,000 people in different U.S. states, including the District of Columbia. The results
                                          indicated a sharp change in trends after face covering mandates. For the 32 states with face covering
                                          mandates, 63% and 66% exhibited a downward trend in confirmed cases within 21 and 28 days of
                                          implementation, respectively. We estimated that face covering mandates in the 32 states prevented
                                          approximately 78,571 and 109,703 cases within 21- and 28-day periods post face covering mandate,
                                          respectively. A statistically significant (p = 0.001) negative correlation (−0.54) was observed between
                                the rate of cases and days since the adoption of a face covering mandate. We concluded that the use

                                          of face coverings can provide necessary protection if they are properly used.
Citation: Ayodeji, O.J.; Ramkumar, S.
Effectiveness of Face Coverings in        Keywords: COVID-19; face covering; pandemic; SARS-CoV-2; state-wide mandate
Mitigating the COVID-19 Pandemic
in the United States. Int. J. Environ.
Res. Public Health 2021, 18, 3666.
https://doi.org/10.3390/ijerph
                                          1. Introduction
18073666
                                                The COVID-19 outbreak has spread to 224 countries and territories, infecting about
Academic Editor: Giuseppe Zoccai          95 million people around the globe and resulting in over 2 million confirmed deaths [1]. The
                                          United States has the highest number of cases and positive case rate with over 27.2 million
Received: 7 March 2021                    cumulative cases at 8218.9 reported cases per 100,000 people, as of 9 February 2021 [2,3].
Accepted: 29 March 2021                   As of the same date, the pandemic has caused over 467,312 fatalities in the United States [3].
Published: 1 April 2021                   As new evidence becomes available, knowledge of the spread of the virus continues to
                                          evolve. Current evidence suggests that it is mainly transmitted through ejected respiratory
Publisher’s Note: MDPI stays neutral      droplets (>5 µm), smaller aerosols (
Int. J. Environ. Res. Public Health 2021, 18, 3666 2 of 11
was one of the major CDC recommendations for reopening the United States after the
COVID-19 pandemic lockdown [12].
Because SARS-CoV-2 is highly contagious, COVID-19 is an inherently social phe-
nomenon, and limiting social contact is effective in containing it [8]. For this reason, most
mitigating measures emphasized physical distancing such as lockdowns, quarantine, re-
quired minimum distance, isolation, stay-at-home orders, and shelter-in-place. At the
onset of the COVID-19 outbreak, all states in the U.S., including the District of Columbia,
made emergency declarations and 42 states issued mandatory stay-at-home orders between
1–31 March 2020 [13]. Similarly, most states prohibited or restricted non-essential services
(46 states) including bar closures (all states) and dine-in services (49 states) [14]. The U.S.
Centers for Disease Control and Prevention suggested maintaining at least 2 m (6 foot) from
others to reduce the risk of infection from ejected and infected droplets [11]. Even before
the enactment of these public measures for COVID-19, media and authorities encouraged
people to voluntarily practice physical distancing behaviors to reduce the transmission of
the virus [8].
Although physical distancing has been mostly accepted and practiced, the use of face
coverings has not been fully embraced and it remains a highly debated issue [15–17]. The
controversy about the use of face coverings during the COVID-19 pandemic originated
from ideological differences, perception of risk, uncertainty, and lack of understanding of
its effectiveness [15,18–20]. The prevailing view presupposes the variation in experimental
results [19,21] and limited available evidence so far on how community use of face cover-
ings would affect the spread of COVID-19 [22]. Moreover, debate also occurred among the
research communities [19], political entities, and decision-makers [15]. The implementation
of face covering measures varies greatly from one state to another [23] and there is an
increasing divide between those who wear and who do not wear masks [15].
As SARS-CoV-2 is a novel virus, its mechanism of transmission and consequent in-
tervention is unprecedented. Suitable methods to model the transmission and assess
the effectiveness of intervention measures for the pandemic have not yet been fully de-
veloped [20], and available frameworks for its containment require scientific validation.
Attempts have been made towards understanding the effectiveness of face coverings
against the spread of COVID-19. However, analysis is often carried out using mathematical
and empirical modeling approaches [18,22,24,25], simulation experiments [26,27], and
participatory surveys [19,27,28]. To our best knowledge, no report has documented the
effectiveness of face coverings using comprehensive data from almost all states in the U.S.
and actual COVID-19 infection cases data between 1 April to 31 December 2020, in a single
study. In the current study, actual confirmed cases, a longer timeframe, and up to 46 states
were included in the analysis. We examined the effectiveness of face coverings as a mitigat-
ing measure in the U.S. during the COVID-19 pandemic. This objective was accomplished
by analyzing the trends of daily new COVID-19 cases, cumulative confirmed cases, and
infection cases per 100,000 people in different states including the District of Columbia.
2. Results and Discussion
2.1. Distinctive Change in Trend after Face Covering Mandate
A distinctive change in trend was observed in the number of daily new cases and
total confirmed cases in most states after state-wide face covering (FC) mandates were
enacted (Supplementary Figure S1). Depending on the state, this change coincides with
and occurs a few days after FC was mandated. The effectiveness of FC use on daily new
cases and cumulative confirmed cases was assessed by computing the difference between
reported and projected numbers. This assessment was justified by the high coefficient of
determination values (R2 ranged from 0.9774 to 0.9987) obtained for regression equations
and by limiting the projection to 28 days post FC mandate. The prediction with regression
equation indicated a reduction in daily and cumulative number of cases in 63% and 66% of
the states, 21 and 28 days post FC mandate, respectively (Table 1). For instance, after the
FC mandate in Alabama on 16 July 2020, it was estimated that 5804 cases were preventedInt. J. Environ. Res. Public Health 2021, 18, 3666 3 of 11
within 21 days and the number almost doubled in another 7 days (Figure 1). After 21 and
28 days, the three largest differences were observed in New York (111,417 and 160,956
respectively), Iowa (49,750 and 69,448 respectively), and Massachusetts (23,816 and 35,104
respectively) (Table 1).
Table 1. States with face covering mandates and estimates from the projection of the number of cases prevented by 21 and
28 days after face covering mandates were enacted.
Effective R2 21 Days 28 Days
SN States Total Cases * Linear Range (Date)
Date Value PD PD
i Alabama 399,150 16 July 0.9973 9 July–18 July 5804 10,763
ii Arkansas 251,746 20 July 0.9985 7 July–24 July 762 1921
iii California 2,621,277 18 June 0.9819 12 June–24 June −74,276 −114,937
iv Colorado 358,947 17 July 0.9977 5 July–21 July 189 1293
v Connecticut 205,994 20 April 0.9936 12 April–24 April 5972 9135
vi Delaware 64,475 28 April 0.9887 14 April–29 April 862 1669
vii DC 31,457 22 July 0.9948 13 July–28 July 136 265
viii Illinois 1,024,039 1 May 0.9979 24 April–7 May 6532 14,770
ix Indiana 558,560 27 July 0.9973 21 July–1 August −1828 −2624
x Iowa 295,353 17 November 0.9900 3 November–16 November 49,750 69,448
xi Kansas 242,322 3 July 0.9954 27 June–8 July 708 932
xii Louisiana 341,431 11 July 0.9946 5 July–17 July 14,834 23,393
xiii Maryland 306,674 31 July 0.9981 23 July–4 August 6241 8725
xiv Massachusetts 417,829 1 May 0.9958 17 April–1 May 23,816 35,104
xv Michigan 562,553 5 October 0.9903 26 September–11 October −29,743 −64,892
xvi Minnesota 434,413 25 July 0.9955 18 July–31 July 1017 609
xvii Mississippi 239,082 30 September 0.9973 20 September–6 October −5019 −6405
xviii Montana 86,102 15 July 0.9953 7 July–18 July −31 −140
xix Nevada 246,309 24 June 0.9774 10 June–23 June −16,158 −20,197
xx New Jersey 579,182 8 July 0.9987 21 June–5 July 488 660
xxi New Mexico 154,954 6 May 0.9969 26 April–8 May 611 671
xxii New York 1,127,777 17 April 0.9971 3 April–18 April 111,417 160,956
xxiii North Carolina 614,355 26 June 0.9965 17 June–30 June −9978 −13981
xxiv North Dakota 94,716 14 November 0.9953 4 November–17 November 13,966 21413
xxv Ohio 770,977 23 July 0.9974 9 July–22 July 9491 11,818
xxvi Oregon 124,476 1 July 0.9980 19 June–1 July −877 −1080
xxvii Pennsylvania 713,310 1 July 0.9966 22 June–7 July −4589 −5775
xxviii Texas 1,938,551 3 July 0.9930 26 June–9 July −35,026 −41,723
xxix Utah 303,723 9 November 0.9941 4 November–13 November −1898 1385
xxx Washington 271,595 26 June 0.9954 21 June–2 July −2417 −2749
xxxi Wisconsin 548,134 1 August 0.9985 20 July–2 August 3603 4212
xxxii Wyoming 46,719 9 December 0.9944 23 November–8 December 4212 5064
Keys: * = Total number of cases documented by respective states as of 11 January 2021; PD = projected difference indicating estimated
number of cases prevented by FC order by 21- or 28-day period; negative values (−) = increase in number of cases. Number of states with a
reduced number of daily cases after 21 days post FC order = 20. Percentage of states where FC order reduced number of daily cases 21 days
post FC order = 63%. Number of states with a reduced number of daily cases 28 days post FC order = 21. Percentage of states where FC
order reduced the number of daily cases 28 days post FC order = 66%.
It is important to understand the 1st-order processes for the COVID-19 pandemic,
which includes the transmission route of the virus, intervention measures, and the interac-
tions that exist between the above two factors [20]. In the current study, the key feature
in the curves is a change in case trends after state-wide FC mandates (Supplementary
Figure S1). This distinctive change represents a dynamic equilibrium that was attained
between transmission and intervention after few days. Second-order factors that are likely
to impact the COVID-19 infection trend to include an incubation period [29], which is the
time from exposure to the time when symptoms are developed in a typical symptomatic
situation. The incubation period of SARS-CoV-2 is estimated to be 5 days [29]. Therefore,
in the study, we excluded data from the 7-day period post FC mandate, including the date
of the mandate.Int. J. Environ. Res. Public Health 2021, 18, 3666 4 of 11
Int. J. Environ. Res. Public Health 2021, 18, x FOR PEER REVIEW 4 of 12
Figure1.1. Cumulative
Figure Cumulative number of of COVID-19
COVID-19casescasesininAlabama
Alabamastate
statebetween
between1616
June–19
June–19 August.
August.
Linear regression equation (R22 = 0.9973) was used to estimate the number of cases prevented by 21
Linear regression equation (R = 0.9973) was used to estimate the number of cases prevented by
days
21 days(5804)
(5804)and 2828
and days (10,763),
days (10,763),after the
after face
the covering
face covering(FC)
(FC)mandate.
mandate.The
Theslope (d(d
slope
−1)−indicates
1 ) indicates
daily rate of change in confirmed cases.
daily rate of change in confirmed cases.
AIt noticeable
is important to understand
change was observed the 1st-order
within a processes
few days for afterthe
theCOVID-19
implementationpandemic, of
which includes the transmission route of the virus, intervention
the FC measures in Connecticut, Delaware, Iowa, Louisiana, Maryland, Massachusetts, measures, and the inter-
actions
New that exist
Mexico, Newbetween the above
York, North Dakota, twoOhio,
factors [20]. In the
Wisconsin, and current
Wyoming study, the key feature
(Supplementary
in the curves
Figure is a change
S1). It appeared in the
that caseeffectiveness
trends after state-wide
of state-wide FCmandates
mandatesof (Supplementary
FCs in public was Fig-
ure S1). This
observed distinctive
within a few days change
in therepresents
majority of a dynamic
the states. equilibrium that was
Similar analysis attained
indicated be-
that
FCtween transmissionfactor
is a determinant and intervention
in changing the aftertrend
few ofdays. Second-order
infection cases duringfactors that are likely
a pandemic [10].
to impact the COVID-19
Community-wide wearing infection
of FCs trend
in publicto include an incubation
is effective in preventing period [29], whichtrans-
interhuman is the
time from exposure to the time when symptoms are developed
mission [15,22,30], especially where significant distance between individuals cannot be in a typical symptomatic
situation.In
achieved. The incubation
states with FCperiod
mandatesof SARS-CoV-2
included in is the estimated to be 5itdays
current study, [29]. Therefore,
was estimated that
atinleast
the study,
78,571wecasesexcluded data fromwithin
were prevented the 7-day period
21 days post
after theFC mandate,
mandate and including the date
at least 109,703
within
of the 28 days.
mandate.
Differences
A noticeableinchangetrend wasare still evident
observed in the
within a few results (Table
days after the1 implementation
and Supplementary of the
Figure S1) among
FC measures all the statesDelaware,
in Connecticut, that have FC Iowa,mandates.
Louisiana, TheMaryland,
differencesMassachusetts,
may be attributed New
toMexico,
behavior New York, North Dakota, Ohio, Wisconsin, and Wyoming (Supplementary For
and policy implementation that varies from one state or county, to another. Fig-
instance,
ure S1). comfort,
It appeared socio-economic factors, costofofstate-wide
that the effectiveness compliance, perception
mandates of of
FCs risk,
in incentives,
public was
and social within
observed connectivity havein
a few days been
the documented
majority of the tostates.
impactSimilar
mitigation compliance
analysis indicated[31–33].
that FC
Similarly, implementation
is a determinant factor in policies
changing vary
thefromtrendcounty to county.
of infection casesFor example,
during counties[10].
a pandemic in
Colorado, Kansas, and
Community-wide Ohio may
wearing elect
of FCs intopublic
opt out is of statewide
effective FC orders ifinterhuman
in preventing they meet certain trans-
benchmarks for declining
mission [15,22,30], caseloads,
especially where aresignificant
deemed todistance
be at lowbetween
risk for transmission,
individuals cannot or meet be
other public health criteria [23]. These may in part explain why
achieved. In states with FC mandates included in the current study, it was estimated 34% and 37% of the states
that
with FC 78,571
at least mandates
casesdowerenot prevented
exhibit a reduction
within 21in caseafter
days trends
the by 28 andand
mandate 21 days
at leastafter the
109,703
mandate, respectively.
within 28 days.
Differences in trend are still evident in the results (Table 1 and Supplementary Figure
2.2. Confirmed Infection Cases Rate
S1) among all the states that have FC mandates. The differences may be attributed to be-
Case
havior andrates for implementation
policy states with and that withoutvariesFCfrommandates
one state were compared
or county, during the
to another. For
two exponential increases in confirmed cases. Here, confirmed
instance, comfort, socio-economic factors, cost of compliance, perception of risk, case rates were used for
incen-
comparison to normalize
tives, and social connectivity the have
differences in population
been documented size. Seven
to impact out of compliance
mitigation 10 states (70%) [31–
with the lowest case rates by the end of the summer exponential
33]. Similarly, implementation policies vary from county to county. For example, countiesincrease in cases have FC
mandates
in Colorado,while all states
Kansas, and(100%)
Ohiowithmaythe lowest
elect case
to opt out rates by the endFC
of statewide of the fall exponential
orders if they meet
increase have FC mandates (Table 2). On the other hand, 7 out of 10 states (70%) with
certain benchmarks for declining caseloads, are deemed to be at low risk for transmission,
the highest case rates by the end of summer did not have FC mandates. Eight out of 10
or meet other public health criteria [23]. These may in part explain why 34% and 37% of
states with the highest number of case rates by the end of the fall exponential increase did
the states with FC mandates do not exhibit a reduction in case trends by 28 and 21 days
not have effective FC mandates during the period. For instance, South Dakota, Nebraska,
after the mandate, respectively.
Tennessee, and Idaho did not have FC mandates while North Dakota (14 November), IowaInt. J. Environ. Res. Public Health 2021, 18, 3666 5 of 11
(14 November), Utah (9 November), and Wyoming (9 December) only recently mandated
FC requirements (Table 3).
Table 2. Lowest summer and fall rates of confirmed COVID-19 infection cases.
Summer 2020 Fall 2020
M. by M. by
SN States R-LDS M. Date SN States R-LDF M. Date
9/22 12/21
1 Oregon 742.4 Y 1 July 1 Oregon 2460 Y 1 July
2 Wyoming 866.7 N 9 December 2 Washington 2976.2 Y 26 June
3 Alaska 950 N 3 Virginia 3684.4 Y 14 December
4 Montana 1019.9 Y 15 July 4 D of Columbia 3788.9 Y 22 July
5 Washington 1092.5 Y 26 June 5 West Virginia 4092.1 Y 14 December
6 Colorado 1147 Y 17 July 6 Maryland 4224.5 Y 31 July
7 Pennsylvania 1184.6 Y 1 July 7 Pennsylvania 4402.4 Y 1 July
8 Ohio 1247.7 Y 23 July 8 New York 4480 Y 17 April
9 Michigan 1305.3 N 5 October 9 North Carolina 4611.4 Y June
10 New Mexico 1325.3 Y 6 May 10 Connecticut 4694.6 Y 20 April
Keys: M = mandate, Y = yes, N = no, R-LDS = infection cases per 100,000 people on last day of summer 2020; R-LDF = infection cases per
100,000 people on last day of fall 2020. Most states with lowest case rates have earliest FC mandates.
Table 3. Highest summer and fall rates of confirmed COVID-19 infection cases.
Summer 2020 Fall 2020
M by M by
SN States R-LDS M. Date SN States R-LDF M. Date
9/22 12/21
1 Louisiana 3511.7 Y 11 July 1 North Dakota 11,869.5 Y 14 November *
2 Mississippi 3177.7 N 30 September 2 South Dakota 10747 N
3 Florida 3165 N 3 Iowa 8498.3 Y 14 November *
4 Georgia 3050.3 N 4 Wisconsin 8490.5 Y 1 August
5 Alabama 2989.6 Y 16 July 5 Nebraska 8121.5 N
6 Arizona 2951.7 N 6 Utah 7884.8 Y 9 November *
7 South Carolina 2734.4 N 7 Tennessee 7754.6 N
8 Tennessee 2711.1 N 8 Idaho 7323.6 N
9 Iowa 2576.8 N 17 November 9 Wyoming 7277.3 Y 9 December *
10 Arkansas 2550.9 Y 20 July 10 Montana 7234.8 Y 15 July
Keys: M = mandate, Y = yes, N = no, R-LDS = infection cases per 100,000 people on last day of summer 2020; R-LDF = infection cases per
100,000 people on last day of fall 2020, * = only few days/weeks of FC mandate in 2020.
Physical distancing and hand sanitizing help to prevent contact transmission of SARS-
CoV-2 but not airborne transmission [20]. The use of FCs in combination with physical
distancing provides maximum protection against both contact and airborne exposures [10].
It was reported that public use of FCs greatly reduced COVID-19 growth rates in U.S. states
that enacted FC mandates [22]. The results observed in the current study also suggested that
state-wide FC requirements provided an additional layer of mitigation to offer maximum
protection against the virus. During the periods (summer and fall), lower case rates were
noticeable in most states with FC mandates while higher rates were observed in most
states without the mandate (Tables 2 and 3). These lower case rates may be associated
with compliance with mandates. Since COVID-19 is an inherently social phenomenon [8],
it requires communal response [22]. By relying on what [34] was described as priming
reasoning and encouragement by media, authorities, and peers, many people in the U.S.
and around the globe voluntarily followed FC recommendations whether mandated or
not. However, the results of lower case rates and trends in states where FC is mandated are
evidence-based [20,22].Int. J. Environ. Res. Public Health 2021, 18, 3666 6 of 11
2.3. Change in Trends of Confirmed Infection Rate
It is important to determine whether the use of FCs had any impact during summer
(20 June–22 September) and fall (22 September–21 December) when there was a sharp
increase in the number of cases. We assessed the effects of FCs on infection cases per
100,000 people by comparing the slopes (rate of change in cases per day) of the linear
regression during the summer and fall increase in daily new cases. Slopes for the entire
data period (1 April–31 December) were also computed. A relationship between infection
cases per 100,000 people (y-axis) and time (x-axis) was established. Here, since normalized
cases per 100,000 people data were used for analysis, 46 states were included in the analysis.
Thirty-five states with FC requirements and eleven states without the requirements were
included in this analysis excluding states with a lower cumulative number of confirmed
cases (HI, ME, NH, RI, and VT). Results are presented in Supplementary Table S2. Steep
slopes denote increasing trends while smaller slopes indicate slowing trends. That is, the
higher the slope, the higher the case rate and vice versa. The differences in trends between
states with and without FC mandates were distinguishable.
2.3.1. Summer Exponential Increase in Confirmed Cases (20 June–22 September)
The linear regression equation slope ranged from 3.039 to 31.396. The 10 states
with lower slopes were Connecticut (3.0394), New York (3.4079), New Jersey (4.2512),
Massachusetts (4.6683), Pennsylvania (5.9357), Oregon (6.5497), Wyoming (6.7687), Colorado
(6.774), Michigan (6.9972), and the District of Columbia (8.2233). Eight of these states (80%)
with the lower slopes had FC mandates by 22 September 2020. The remaining two states
(Michigan and Wyoming) later mandated FC by October 5 and December 9, respectively.
The 10 states with higher slopes were Florida (31.396), Mississippi (28.606), Louisiana
(28.59), Georgia (28.567), Alabama (27.364), Tennessee (25.286), Nevada (24.331), South
Carolina (24.303), Arizona (23.349), and Texas (23.242). Six of these states (60%) did not
have FC mandates by 22 September 2020.
2.3.2. Fall Exponential Increase in Confirmed Cases (22 September–21 December)
Slopes ranged from 17.668 to 122.19. The 10 states with lower slopes were the District
of Columbia (17.668), Oregon (19.036), Washington (20.046), Virginia (20.928), New York
(21.314), Maryland (24.415), California (24.569), Florida (25.567), Georgia (25.815), and South
Carolina (26.54). Seven of these states (70%) had a FC mandate by 21 December 2020. The
10 states with higher slopes were North Dakota (122.19), South Dakota (108.2), Wisconsin
(81.488), Wyoming (81.135), Montana (76.922), Iowa (75.765), Nebraska (74.254), Utah
(68.465), Minnesota (68.138), and Indiana (61.306). Two (South Dakota and Nebraska) of the
10 states did not have a FC mandate by 21 December 2020. North Dakota, Wyoming, Iowa,
and Utah mandated FCs by 14 November, 9 December, 17 November, and 9 November,
respectively. Essentially, six of these states (60%) did not have a FC requirement for most of
the period.
The exponential periods observed in the current study coincided with summer vaca-
tions, onset of fall, thanksgiving holiday, and transitioning from summer to fall, among
others. It was demonstrated that SARS-CoV-2 can persist significantly longer at lower
temperatures than generally thought possible and remain infectious [35]. Increased human
activities and drop in ambient temperature during these periods may have resulted in the
observed exponential increase in the number of COVID-19 cases.
2.3.3. Entire Data Period (1 April–31 December)
Slopes ranged from 8.15 to 43.635. The 10 states with lower slopes were Oregon
(8.15), Washington (9.47), New York (9.58), the District of Columbia (11.31), Connecticut
(11.89), Massachusetts (12.11), Pennsylvania (12.19), West Virginia (12.551), Virginia (12.623),
and New Jersey (13.29). All these 10 states (100%) had a state-wide FC mandate by 31
December 2020. The 10 states with higher slopes were North Dakota (43.64), South Dakota
(37.55), Iowa (30.10), Wisconsin (30.09), Nebraska (27.34), Utah (26.91), Tennessee (26.34),Int. J. Environ. Res. Public Health 2021, 18, 3666 7 of 11
Idaho (26.12), Montana (24.95), and Arkansas (24.56). Four of these states (South Dakota,
Nebraska, Tennessee, and Idaho) did not have a FC mandate by 31 December 2020. North
Dakota (14 November), Iowa (17 November), and Utah (19 November) mandated FCs in
the late fall. Essentially, 8 out of these 10 states (80%) did not have a FC mandate for most
of the period (Supplementary Table S2).
There is a need for personal protective equipment that can effectively intervene in the
chain of infection and block transmission [21]. The effects of face masks on flow resistance,
aerosol filtration, and prevention of smear infection have been highlighted [21,36]. Review
of data from 172 studies from around the globe indicated that with proper face coverings
the risk of infection is only about 3.1% [15]. From a fluid physics point of view, flow
resistance of face masks can effectively prevent transmission of SARS-CoV-2 through
exhaled air [21] by asymptomatic, symptomatic, and presymptomatic individuals. The
inhalation of virus-containing droplets can be prevented by using a tight-fitting FC with
high filtration efficiency. In the current study, we observed that case rates were lower in
states with FC mandates.
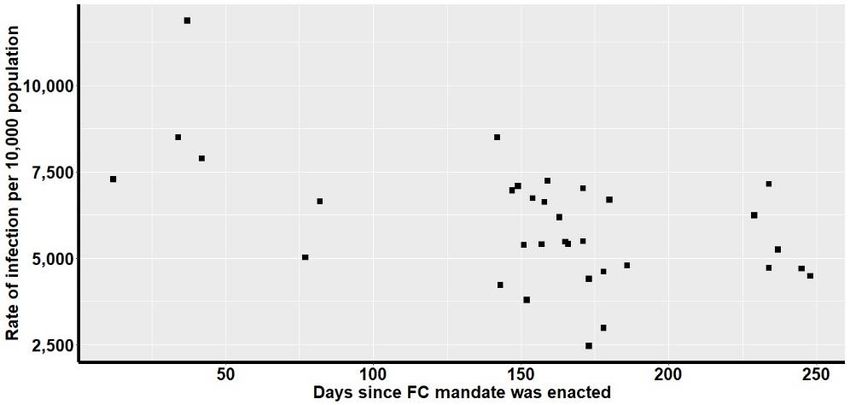
2.4. Correlation between Confirmed Cases and Number of Days Since Mandate
Since wearing FCs has been linked to a reduction of risk of contracting SARS-CoV-2,
it is crucial to examine how infection cases change from the time that FCs are adopted.
To determine if the FC order date affects the COVID-19 case trends in 32 states with FC
mandates, the correlation between infection cases per 100,000 people (y-axis) and the
number of days since FC mandate (x-axis) was computed. Scatter plot representation is
given in Figure 2. Results of statistical analysis revealed a negative correlation (−0.54)
between the two variables. Analysis also indicated statistical significance (t = −3.5674,
df = 31, p-value = 0.001195, 95% confidence interval = −0.7448446, −0.2407747) indicating
Int. J. Environ. Res. Public Health 2021,that
18, xthe
FORcorrelation
PEER REVIEW 8 of 12
is not equal to 0. That is, the longer the time since passing FC mandates,
the lower the rate of infection cases.
Figure 2.
Figure 2. Scatter
Scatterplot
plotof
ofcorrelation
correlationbetween
betweenthethe
number of days
number since
of days the the
since FC mandate was passed
FC mandate was passed
and the rate of COVID-19 infection cases by the end of Fall 2020 (21 December).
and the rate of COVID-19 infection cases by the end of Fall 2020 (21 December).
3. Materials
3. Materials and
and Methods
Methods
3.1.
3.1. Data Collection
Collection
Data on confirmed
confirmedCOVID-19
COVID-19casescaseswere
wereobtained
obtained from
from thethe
Department
Departmentof Public
of Public
Health of each
Health each state
state (Supplementary
(SupplementaryTable TableS1)S1)designated
designated byby thethe
American
AmericanNational
National
Standards Institute’s
Standards Institute’s[ANSI/USPS]
[ANSI/USPS] alphabetical
alphabeticalcodes as AL,
codes AK,AK,
as AL, AZ,AZ,
AR,AR,
CA,CA,
CO, CO,
CT, CT,
DE, DC, FL, GA, ID, IL, IN, IA, KS, KY, LA, MD, MA, MI, MN, MS,
DE, DC, FL, GA, ID, IL, IN, IA, KS, KY, LA, MD, MA, MI, MN, MS, MO, MT, NE, MO, MT, NE, NV, NJ, NV,
NM, NY, NC, ND, OH, OK, OR, PA, SC, SD, TN, TX, UT, WA,
NJ, NM, NY, NC, ND, OH, OK, OR, PA, SC, SD, TN, TX, UT, WA, WI, and WY. WI, and WY. Data on theData
rate of cases per 100,000 people for each state were collected from the Centers
on the rate of cases per 100,000 people for each state were collected from the Centers for Disease
Control
for and
Disease Control Prevention
and Prevention(https://covid.cdc.gov/covid-data-tracker/#trends_to-
(https://covid.cdc.gov/covid-data-tracker/#trends_
talandratecases, accessed
totalandratecases, accessed on 9 February 2021). All2021).
on 9 February data were
All collected
data were between 10 December
collected between 10
2020–20 January 2021. States with fewer cumulative number of confirmed
December 2020–20 January 2021. States with fewer cumulative number of confirmed infection cases
(HI, ME, NH, RI, and VT) and those that most recently mandated face coverings (VA and
WV) were excluded from the analysis due to data variation resulting from continuous
updates of recent daily cases. Face covering (FC) mandated states are defined as states
that enacted FC mandates requiring its citizens to wear FC in public places (Supplemen-
tary Table S1).Int. J. Environ. Res. Public Health 2021, 18, 3666 8 of 11
infection cases (HI, ME, NH, RI, and VT) and those that most recently mandated face
coverings (VA and WV) were excluded from the analysis due to data variation resulting
from continuous updates of recent daily cases. Face covering (FC) mandated states are
defined as states that enacted FC mandates requiring its citizens to wear FC in public places
(Supplementary Table S1).
3.2. Data Analysis
Statistical analysis was performed with R (v 3.5.1) programming language and Mi-
crosoft Excel 2010 for Windows. R (v 3.5.1) was used to perform Pearson correlation
analysis and generate a scatter plot. Excel for Windows was used to compute regression
analysis, generate charts, and construct tables. p-value was predetermined atInt. J. Environ. Res. Public Health 2021, 18, 3666 9 of 11
3.4. Correlation between the Rate of Cases and Days Since Mandate
To determine whether the date that the FC mandate was enacted impacted the COVID-
19 cases, Pearson correlation analysis was performed between the number of days since
the date FC was mandated (x-axis) vs. the number of cases per 100,000 people (y-axis). The
statistical significance of the correlation was tested at p < 0.05.
4. Conclusions
Different mitigating measures to slow the spread of SARS-CoV-2 such as lockdowns,
quarantine, required minimum distance, isolation, stay-at-home orders, and shelter-in-
place have been taken with little or no debate about their effectiveness, resulting in utmost
compliance. However, the use of face coverings is a highly debated measure, so its
implementation varied greatly from one location to another. Physical distance rules can
usually be achieved during lockdown, quarantine, shelter-in-place, and isolation. But what
happens after the end of lockdown with the re-opening of businesses and gathering of
people in public places? Additional effective protection is crucial to lower or stabilize
infection rates.
In the current study, we analyzed COVID-19 confirmed cases from 1 April to 31
December 2020 for U.S. states with and without face covering mandates. To understand the
effectiveness of face coverings during the pandemic, we analyzed the daily new infection
cases, cumulative confirmed cases, and infection rate per 100,000 people for up to 46 states
in the U.S. Collected data indicated an exponential increase in the number of cases during
the summer and fall of 2020. Reduction in cases was, however, observed in many states
that enacted a face covering mandate. The distinctive change emerged within days of
passing the face covering mandate (Supplementary Figure S1). The outcome of our research
illustrated that face coverings made an impact by reducing confirmed cases after mandates
(Tables 2 and 3).
To evaluate the effectiveness of face coverings beyond the 28 days included in the
projection, the correlation between infection cases per 100,000 people and the number of
days since the implementation of the mandate, was assessed. A statistically significant
(p = 0.001) negative correlation (−0.54) was observed. The results highlighted the potential
of community-wide wearing of face coverings in reducing the COVID-19 cases. All face
coverings can offer fundamental protection if they are used properly and have sufficient
flow resistance [21]. It is essential to note that if not properly worn, users will touch the
face more frequently to adjust the fit of the mask which can increase the likelihood of
smear infection. It is also important to emphasize that face coverings should not only
cover the mouth but also create a physical transmission barrier over both the mouth and
nose. Particularly, the communal use of face coverings in conjunction with other mitigating
measures provides maximum protection against transmission.
Supplementary Materials: Our definition of face coverings is based on CDC’s guideline (https:
//www.cdc.gov/coronavirus/2019-ncov/prevent-getting-sick/about-face-coverings.html, accessed
on 1 February 2021). Other supplementary information are presented in Supplementary Figure S1
and Supplementary Tables S1 and S2 (available online at https://www.mdpi.com/article/10.3390/
ijerph18073666/s1).
Author Contributions: O.J.A.: Design, data curation, statistical analysis, methodology, statistical
software, writing (original draft, review, and editing); S.R.: conceptualization, investigation, resources,
and funding, supervision, visualization, review, and editing. All authors have read and agreed to the
published version of the manuscript.
Funding: Financial support was provided by the Cotton Incorporated (Contract#: 18-497).
Data Availability Statement: Sources of all data are provided in Supplementary Table S1.
Acknowledgments: Seshadri Ramkumar gratefully acknowledges Cotton Incorporated for support-
ing the research on Health and Medical Protection Markets for Cotton, of which this work forms
a part.Int. J. Environ. Res. Public Health 2021, 18, 3666 10 of 11
Conflicts of Interest: The authors declare that they have no conflict of interest.
References
1. World Health Organization. Coronavirus Disease (COVID-19) Pandemic. Available online: https://www.who.int/emergencies/
diseases/novel-coronavirus-2019 (accessed on 21 January 2021).
2. Centers for Disease Control and Prevention. CDC COVID Data Tracker. Available online: https://covid.cdc.gov/covid-data-
tracker/#global-counts-rates (accessed on 9 February 2021).
3. John Hopkins University. COVID-19 Dashboard by the Center for Systems Science and Engineering (CSSE) at Johns Hopkins
University (JHU). Available online: https://coronavirus.jhu.edu/map.html (accessed on 9 February 2021).
4. World Health Organization. Coronavirus Disease (COVID-19): How Is It Transmitted? Available online: https://www.who.int/
news-room/q-a-detail/coronavirus-disease-covid-19-how-is-it-transmitted (accessed on 9 December 2020).
5. Rab, S.; Javaid, M.; Haleem, A.; Vaishya, R. Face masks are new normal after COVID-19 pandemic. Diabetes Metab. Syndr. Clin.
Res. Rev. 2020, 14, 1617–1619. [CrossRef] [PubMed]
6. Rothe, C.; Schunk, M.; Sothmann, P.; Bretzel, G.; Froeschl, G.; Wallrauch, C.; Zimmer, T.; Thiel, V.; Janke, C.; Guggemos, W.; et al.
Transmission of 2019-nCoV Infection from an Asymptomatic Contact in Germany. N. Engl. J. Med. 2020, 382, 970–971. [CrossRef]
7. Pan, X.; Chen, D.; Xia, Y.; Wu, X.; Li, T.; Ou, X.; Zhou, L.; Liu, J. Asymptomatic cases in a family cluster with SARS-CoV-2 infection.
Lancet Infect. Dis. 2020, 20, 410–411. [CrossRef]
8. Marroquín, B.; Vine, V.; Morgan, R. Mental health during the COVID-19 pandemic: Effects of stay-at-home policies, social
distancing behavior, and social resources. Psychiatry Res. 2020, 293, 113419. [CrossRef]
9. Fernández, D.; Giné-Vázquez, I.; Liu, I.; Yucel, R.; Ruscone, M.N.; Morena, M.; García, V.G.; Haro, J.M.; Pan, W.; Tyrovolas, S. Are
environmental pollution and biodiversity levels associated to the spread and mortality of COVID-19? A four-month global analysis.
Environ. Pollut. 2021, 271, 116326.
10. Zhang, R.; Li, Y.; Zhang, A.L.; Wang, Y.; Molina, M.J. Identifying airborne transmission as the dominant route for the spread of
COVID-19. Proc. Natl. Acad. Sci. USA 2020, 117, 14857–14863. [CrossRef]
11. Centers for Disease Control and Prevention. Coronavirus Disease 2019 (COVID-19)—After You Travel Internationally. Available
online: https://www.cdc.gov/coronavirus/2019-ncov/travelers/after-travel-precautions.html (accessed on 9 December 2020).
12. Centers for Disease Control and Prevention. Guidance for Cleaning and Disinfecting. Available online: https://www.cdc.gov/
coronavirus/2019-ncov/community/pdf/reopening_america_guidance.pdf (accessed on 9 December 2020).
13. Moreland, A.; Herlihy, C.; Tynan, M.A.; Sunshine, G.; Mccord, R.F.; Hilton, C.; Poovey, J.; Werner, A.K.; Jones, C.D.; Fulmer,
E.B.; et al. Timing of State and Territorial COVID-19 Stay-at-Home Orders and Changes in Population Movement—United States,
March 1–May 31, 2020. MMWR. Morb. Mortal. Wkly. Rep. 2020, 69, 1198–1203. [CrossRef]
14. KFF. State COVID-19 Data and Policy Actions. Available online: https://www.kff.org/report-section/state-covid-19-data-and-
policy-actions-policy-actions/#socialdistancing (accessed on 21 January 2021).
15. Scerri, M.; Grech, V. To wear or not to wear? Adherence to face mask use during the COVID-19 and Spanish influenza pandemics.
Early Hum. Dev. 2020, 105253. [CrossRef]
16. Feng, S.; Shen, C.; Xia, N.; Song, W.; Fan, M.; Cowling, B.J. Rational use of face masks in the COVID-19 pandemic. Lancet Respir.
Med. 2020, 8, 434–436. [CrossRef]
17. Robinson, J.F.; Anda, I.R.; Moore, F.J.; Gregson, F.K.A.; Reid, J.P.; Husain, L.; Sear, R.P.; Royall, C.P. How effective are face
coverings in reducing transmission of COVID-19? arXiv 2020, arXiv:2012.01314.
18. Eikenberry, S.E.; Mancuso, M.; Iboi, E.; Phan, T.; Eikenberry, K.; Kuang, Y.; Kostelich, E.; Gumel, A.B. To mask or not to mask:
Modeling the potential for face mask use by the general public to curtail the COVID-19 pandemic. Infect. Dis. Model. 2020, 5,
293–308. [CrossRef]
19. Iversen, B.G.; Vestrheim, D.F.; Flottorp, S.; Denison, E.; Oxman, A.D. COVID-19 (2020) Should Individuals in the Community without
Respiratory Symptoms Wear Facemasks to Reduce the Spread of COVID-19? Norwegian Institute of Public Health: Oslo, Norway, 2020.
20. Li, Y.; Zhang, R.; Zhao, J.; Molina, M.J. Understanding transmission and intervention for the COVID-19 pandemic in the United
States. Sci. Total Environ. 2020, 748, 141560. [CrossRef] [PubMed]
21. Kähler, C.J.; Hain, R. Fundamental protective mechanisms of face masks against droplet infections. J. Aerosol Sci. 2020, 148,
105617. [CrossRef]
22. Lyu, W.; Wehby, G.L. Community Use of Face Masks and COVID-19: Evidence from a Natural Experiment of State Mandates in
the US. Health Aff. 2020, 39, 1419–1425. [CrossRef]
23. AARP. State-by-State Guide to Face Mask Requirements. Available online: https://www.aarp.org/health/healthy-living/info-20
20/states-mask-mandates-coronavirus.html (accessed on 22 January 2021).
24. Kucharski, A.J.; Russell, T.W.; Diamond, C.; Liu, Y.; Edmunds, J.; Funk, S.; Eggo, R.M.; Sun, F.; Jit, M.; Munday, J.D.; et al. Early
dynamics of transmission and control of COVID-19: A mathematical modelling study. Lancet Infect. Dis. 2020, 20, 553–558.
[CrossRef]
25. Stutt, R.O.J.H.; Retkute, R.; Bradley, M.; Gilligan, C.A.; Colvin, J. A modelling framework to assess the likely effectiveness of
facemasks in combination with ‘lock-down’ in managing the COVID-19 pandemic. Proc. R. Soc. A Math. Phys. Eng. Sci. 2020, 476,
20200376. [CrossRef]Int. J. Environ. Res. Public Health 2021, 18, 3666 11 of 11
26. Aydin, O.; Emon, B.; Cheng, S.; Hong, L.; Chamorro, L.P.; Saif, M.T.A. Performance of fabrics for home-made masks against the
spread of COVID-19 through droplets: A quantitative mechanistic study. Extrem. Mech. Lett. 2020, 40, 100924. [CrossRef]
27. Rader, B.; White, L.F.; Burns, M.R.; Chen, J.; Brilliant, J.; Cohen, J.; Shaman, J.; Brilliant, L.; Kraemer, M.U.G.; Hawkins, J.B.; et al.
Mask-Wearing and Control of SARS-CoV-2 Transmission in the USA: A Cross-Sectional Study; The Lancet Digital Health: London, UK,
2021; ISSN 2589-7500.
28. Sickbert-Bennett, E.E.; Samet, J.M.; Clapp, P.W.; Chen, H.; Berntsen, J.; Zeman, K.L.; Tong, H.; Weber, D.J.; Bennett, W.D. Filtration
Efficiency of Hospital Face Mask Alternatives Available for Use During the COVID-19 Pandemic. JAMA Intern. Med. 2020,
180, 1607. [CrossRef]
29. Lauer, S.A.; Grantz, K.H.; Bi, Q.; Jones, F.K.; Zheng, Q.; Meredith, H.R.; Azman, A.S.; Reich, N.G.; Lessler, J. The Incubation
Period of Coronavirus Disease 2019 (COVID-19) From Publicly Reported Confirmed Cases: Estimation and Application. Ann.
Intern. Med. 2020, 172, 577–582. [CrossRef]
30. Cheng, V.C.; Wong, S.; Chuang, V.W.; So, S.Y.; Chen, J.H.; Sridhar, S.; To, K.K.; Chan, J.F.; Hung, I.F.; Ho, P.; et al. The role of
community-wide wearing of face mask for control of coronavirus disease 2019 (COVID-19) epidemic due to SARS-CoV-2. J. Infect.
2020, 81, 107–114. [CrossRef] [PubMed]
31. Chande, A.; Lee, S.; Harris, M.; Nguyen, Q.; Beckett, S.J.; Hilley, T.; Andris, C.; Weitz, J.S. Real-time, interactive website for
US-county-level COVID-19 event risk assessment. Nat. Hum. Behav. 2020, 4, 1313–1319. [CrossRef] [PubMed]
32. Charoenwong, B.; Kwan, A.; Pursiainen, V. Social connections with COVID-19–affected areas increase compliance with mobility
restrictions. Sci. Adv. 2020, 6, eabc3054. [CrossRef] [PubMed]
33. Bodas, M.; Peleg, K. Self-Isolation Compliance in the COVID-19 Era Influenced by Compensation: Findings from a Recent Survey
in Israel. Health Aff. 2020, 39, 936–941. [CrossRef] [PubMed]
34. Capraro, V.; Barcelo, H. Priming reasoning increases intentions to wear a face covering to slow down COVID-19 transmission.
PsyArXiv Prepr. 2020. [CrossRef]
35. Riddell, S.; Goldie, S.; Hill, A.; Eagles, D.; Drew, T.W. The effect of temperature on persistence of SARS-CoV-2 on common
surfaces. Virol. J. 2020, 17, 1–7. [CrossRef]
36. Howard, J.; Huang, A.; Li, Z.; Tufekci, Z.; Zdimal, V.; Van Der Westhuizen, H.-M.; Von Delft, A.; Price, A.; Fridman, L.; Tang,
L.-H.; et al. An evidence review of face masks against COVID-19. Proc. Natl. Acad. Sci. USA 2021, 118. [CrossRef]You can also read