Secular Trend in the Physical Fitness of Xinjiang Children and Adolescents between 1985 and 2014 - MDPI
←
→
Page content transcription
If your browser does not render page correctly, please read the page content below
International Journal of
           Environmental Research
           and Public Health

Article
Secular Trend in the Physical Fitness of Xinjiang
Children and Adolescents between 1985 and 2014
Cunjian Bi 1 , Feng Zhang 1, *, Yang Gu 2 , Yi Song 3 and Xiaodi Cai 2
 1    School of Physical Education and Health, East China Normal University, Shanghai 200241, China;
      cjbi1985@126.com
 2    Institute of Physical Education, Xinjiang Normal University, Wulumuqi 830054, China;
      xiangguyang09@sina.com (Y.G.); clxx0991@163.com (X.C.)
 3    Institute of Child and Adolescent Health, School of Public Health, Peking University, Beijing 100191, China;
      songyi@bjmu.edu.cn
 *    Correspondence: fzhang1988@126.com; Tel.: +86-19921276727

 Received: 20 February 2020; Accepted: 24 March 2020; Published: 25 March 2020

 Abstract: We assessed trends in physical fitness by age group and nutrition status among children and
 adolescents in Xinjiang during 1985–2014. The data of 49,357 participants aged 7–18 were extracted in
 1985, 1995, 2005, and 2014. Growth and nutritional status were defined using World Health Organization
 definitions. A physical fitness indicator (PFI) was calculated as the sum of six components measured in
 every survey. The relationship between body mass index (BMI) and PFI was investigated using nonlinear
 regression. Taking 1985 as a reference, PFI increased to 2 in 1995 and then fell sharply to −2.8 in 2005 and
 −3.8 in 2014. The prevalence of normal weight increased from 87.5% in 1985 to 89.4% in 1995 and then
 decreased to 75.2%, consistent with the change in PFI. The relationship between BMI and PFI showed an
 inverted U-shaped curve. The largest increment occurred in boys aged 13–15 and girls aged 16–18 during
 1985–1995; the largest decline occurred in boys and girls aged 10–12 during 1995–2005. Our research
 provides a reference for local governments providing nutrition subsidies and projects in southern Xinjiang,
 indicating that greater attention is needed for children aged 7–12.

 Keywords: physical fitness; nutrition status; Xinjiang; children and adolescents; physical fitness
 indicator; body mass index; growth status

1. Introduction
     Physical fitness can be considered the ability of the body systems to work effectively and efficiently,
allowing our bodies to be healthy and to perform the activities of daily living with ease [1]. As a
type of physical fitness, health-related physical fitness is a multi-component construct that includes
cardiorespiratory endurance (aerobic power), musculoskeletal fitness, flexibility, balance, and speed of
movement. According to the 2018 Physical Activity Guidelines Advisory Committee Scientific Report,
physical fitness may serve as an intermediate variable along the pathway between physical activity and
health outcomes and is associated with reduced all-cause mortality, cardiovascular disease mortality,
and the risk of non-communicable diseases [2]. In addition to physical activity and weight status,
physical fitness has been used as an appropriate public health outcome for children and adolescents [3].
Furthermore, fitness in childhood is considered an important indicator of current [4] and future [5]
health, independent of physical activity [6].
     As a physiologic characteristic, physical fitness is affected by both genetic and environmental
factors. The available literature suggested that physical inactivity, increased sedentary time,
and emerging obesity contributed to poor physical fitness [7]. Evidence also indicates that childhood
cardiorespiratory fitness levels are declining in the United States [8], Canada [3,9], Sub-Saharan

Int. J. Environ. Res. Public Health 2020, 17, 2195; doi:10.3390/ijerph17072195        www.mdpi.com/journal/ijerph
Int. J. Environ. Res. Public Health 2020, 17, 2195                                                   2 of 14

Africa [10], and worldwide [11]. Dong et al. recently reported that, since 1985, physical fitness among
Chinese children and adolescents aged 7–18 (including respiratory function, strength, explosive power,
and cardiorespiratory endurance) reached a peak in 1995 and then declined. Those authors also
concluded that children and adolescents with both stunting and thin status and those with overweight
and obese status had worse physical fitness than those with normal weight; however, age-specific
physical fitness levels were lacking [12]. Our team also conducted cross-sectional research and found
that physical fitness among children and adolescents aged 7–18 in Xinjiang was improved with normal
weight status [13]. It has also been reported that physical fitness levels among children in Xinjiang
declined during 2000–2005 [14]. However, secular trends in physical fitness among children and
adolescents in Xinjiang remain unclear.
     The Xinjiang Uygur Autonomous Region is an economically underdeveloped region located in
northwest China, 2768 km from Beijing, China’s capital. Xinjiang covers an area of 1.66 million square
kilometers and has 24.86 million inhabitants. Xinjiang is a multi-ethnic province comprising 46 ethnic
groups, with Uyghur as the main population [15]. Ethnic groups such as Uyghurs, Kazaks, and Mongolians
differ in many respects from the Han ethnic group in terms of religion, culture, diet, physical fitness,
and lifestyle [16–19].
     Owing to genetic and environmental differences from Han ethnicity, the Chinese national average
physical fitness level may not represent the true physical fitness level among children and adolescents
in Xinjiang. In the present study, we aimed to describe age and sex differences in physical fitness levels
among young people in Xinjiang during 1985–2014 using data from four successive national surveys.
We sought to assess future interventions designed to improve fitness levels at the population level and
to increase our understanding of the relationships between fitness and health.

2. Materials and Methods

2.1. Participants
     Data for the current study were drawn from the Chinese National Survey on Students’ Constitution
and Health (CNSSCH), which is a nationwide survey that has been conducted every 5 years since
1985 by six government departments of China, including the Ministry of Education, the General
Administration of Sport of China, and the National Health Commission of the People’s Republic of
China, among others. In each survey, a thorough medical examination is conducted before taking
measurements to exclude physical deformities or mental diseases. Participants in the CNSSCH include
children and adolescents aged 7–18 across all 31 provinces of China. Considering socio-economic
development level and geographic location, representative cities were selected from every province.
Then, multistage stratified cluster sampling is used to select schools that have been relatively stable
since 1985 and classes. The CNSSCH has been approved by the Medical Research Ethics Committee of
Peking University Health Science Center (IRB00001052-18002). Written informed consent was obtained
before the survey and all participants’ names were digitally coded to protect personal information.
     In the present study, the data of a total 49,357 children and adolescents in Xinjiang were extracted
from the CNSSCH in 1985 (n = 14,548), 1995 (n = 7198), 2005 (n = 10,255), and 2014 (n = 17,356).

2.2. Procedure and Measurement
     All research technicians in this study, recruited from among middle and high school physical
education (PE) teachers, were trained using a standardized testing manual illustrating all test guidelines,
procedures, and protocols. Measurement of all items followed a standardized procedure and was
performed by trained technicians, according to CNSSCH guidelines [20]. All tests were completed in
one day via an assembly line to decrease testing error.
     Portable stadiometers were used to measure the height (cm) to the nearest 0.1 cm, and standardized
scales were used to measure weight (kg) to the nearest 0.1 kg, with participants wearing light clothing and
no shoes. Body mass index (BMI; kg/m2 ) was calculated as weight (kg) divided by height (m) squared.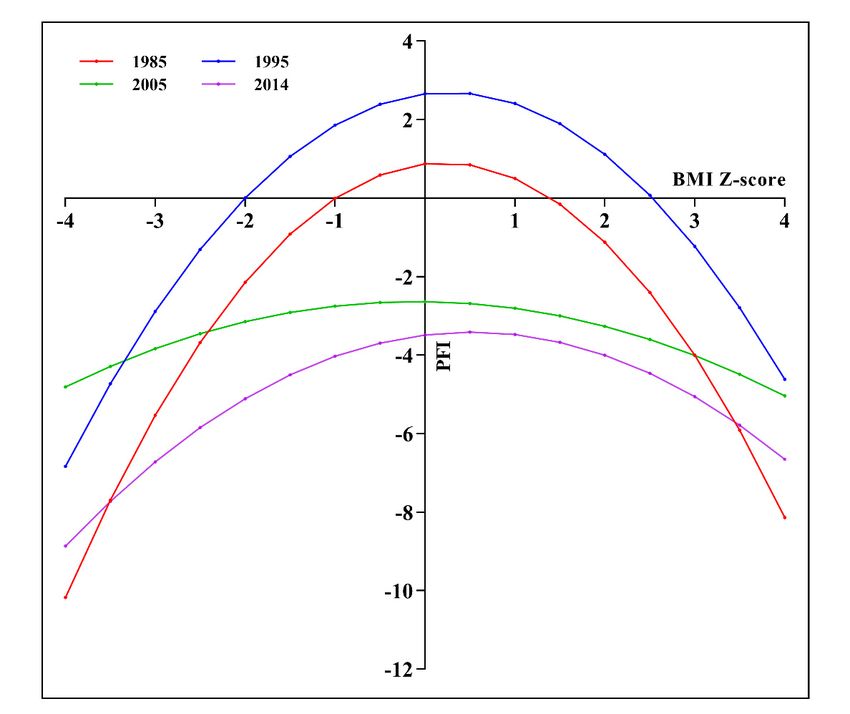
Int. J. Environ. Res. Public Health 2020, 17, 2195                                                 3 of 14

     Six items were measured to assess physical fitness, including forced vital capacity (FVC), standing
long jump, sit-and-reach, body muscle strength, 50-m dash, and endurance running. FVC was
measured to reflect respiratory function using a rotary spirometer in 1985; a needle spirometer and
electronic spirometer were added in 1995. Although different spirometry methods have been used
owing to the updating of instruments, the principles underlying the methods and instruments are
the same. Body muscle strength includes lower limb strength and upper body strength. We used
a standing long jump to assess lower limb strength and oblique body pull-ups for boys aged 7–12,
pull-ups for boys aged 13–18, and 1-min sit-ups for all girls aged 7–18, to assess upper body muscle
strength. The cardiopulmonary function was assessed with long-distance running (eight 50-m shuttle
runs for participants aged 7–12, 1000-m endurance running for boys aged 13–18, and 800-m endurance
running for girls aged 13–18). The 50-m dash was used to assess speed of movement.

2.3. Growth and Nutritional Status and Physical Fitness Indicator (PFI)
     BMI-for-age Z-scores and height-for-age Z-scores were calculated by the sex and age group, with
reference to the 2007 World Health Organization BMI standards. Stunting was defined as height-for-age
Z-score < −2 to represent growth status. Nutritional status was classified as underweight (< −2 for
BMI Z-score), normal (≥ −2 and ≤ 1 for BMI Z-score and ≥ −2 for height Z-score), overweight (> 1 and
≤ 2 for BMI Z-score), or obese (> 2 for BMI Z-score).
     To overcome difficulties during comparisons caused by the different units and sexes, sex-specific
and age-specific standardized values for each core item were calculated using the 1985 survey year
dataset as the reference population. The PFI was then obtained by combining Z-scores of the six core
items, to assess physical fitness at both individual and population levels [12,21]. It should be noted
that Z-scores for the 50-m dash and endurance run were reversed because lower times reflect better
performance in these two tests.

2.4. Statistical Analyses
      Missing data or extreme values for height, weight, and physical fitness items were excluded on the
basis of the logical check boundary provided by the CNSSCH association [20]. Demographic information
and values for the six core items of physical fitness were summarized as means and standard deviations.
The trends in PFI and the six core items of physical fitness with different ages and growth and nutrition
statuses were evaluated between 1985 and 2014. After the Kolmogorov–Smirnov test of normality,
the comparisons of the PFI of 1985, 1995, 2005, 2014 were conducted by nonparametric Kruskal–Wallis
test for the four age groups within each sex, followed by pairwise comparison. The relationship
between BMI and PFI for the survey was investigated using a nonlinear regression model, as follows:
PFI = aBMI2 + bBMI + c; where a, b, c are constants. PFI was used as the dependent variable,
and BMI was considered the independent variable. The level of statistical significance was set at
0.05. All analyses were conducted using IBM SPSS version 23.0 (IBM Corp., Armonk, NY, USA) and
GraphPad Prism 8.0.2(GraphPad Software, Inc., CA, USA).

3. Results
     The data of a total of 49,357 children and adolescents in Xinjiang, aged 7–18, for 1985, 1995,
2005, and 2014, were extracted from the CNSSCH for the current study. Table 1 shows that the
proportions of the study population by sex and age groups were consistent across the four survey years.
Continuous increases in average height, weight, and BMI were observed from 1985 to 2014. In terms of
nutritional status, the prevalence of stunting and underweight declined from 10.3% and 1.7% to 6.5%
and 0.4%, respectively. At the same time, the prevalence of overweight and obesity increased by 92.5%
and 98.7% in 2014, as compared with 1985. The prevalence of normal weight increased from 87.5% in
1985 to 89.4% in 1995 and then decreased to 75.2%, lower than the prevalence in 1985.
     Comprising the six core physical fitness items, the PFI increased to 2 in 1995 and then fell sharply
to −2.8 in 2005 and continued to decrease to −3.8 in 2014, taking the 1985 dataset as reference. In terms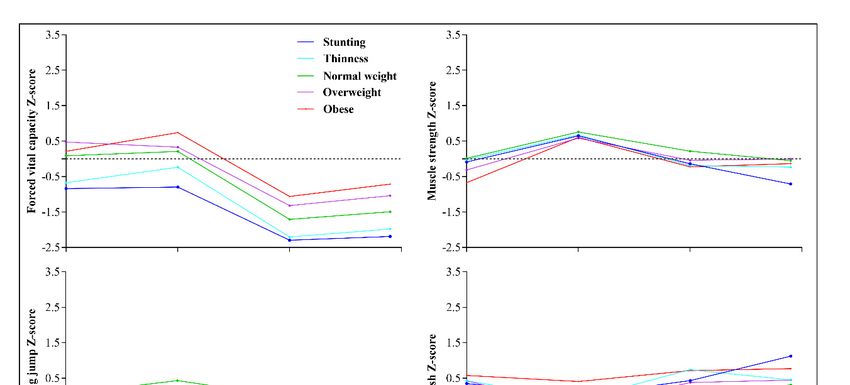
Int. J. Environ. Res. Public Health 2020, 17, 2195                                                                               4 of 14

of specific items, the trend in FVC, standing long jump, sit-and-reach, 50-m dash, and body muscle
strength were consistent with the PFI except for FVC and pull-ups in boys aged 13–18, which increased
from 2005 to 2014 but remained worse than in 1985. The performance of endurance running remained
relatively stable during 1985–1995 but was worse in 2005 and 2014 (Table 2).

      Table 1. Sample distribution and nutrition status among children and adolescents aged 7–18 in Xinjiang,
      1985 to 2014.

                Category                      1985                1995                  2005                      2014
             Sample size                     14,548               7198                  10,255                   17,356
                 Sex
              Boys (%)                     7261(49.9)          3600(50.0)             5138(50.1)               8671(50.0)
              Girls (%)                    7287(50.1)          3598(50.0)             5117(49.9)               8685(50.0)
          Age groups (years)
              7-9yr (%)                    3628(24.9)          1800(25.0)             2441(23.8)               4378(25.2)
             10-12yr (%)                   3637(25.0)          1800(25.0)             2625(25.6)               4263(24.6)
             13-15yr (%)                   3650(25.1)          1798(25.0)             2603(25.4)               4306(24.8)
             16-18yr (%)                   3633(25.0)          1800(25.0)             2586(25.2)               4409(25.4)
          Nutritional status
           Height (cm, SD)               146.19(16.82)       148.35(16.69)         149.91(16.94)              149.17(17.12)
           Weight (kg, SD)               37.22(12.88)         38.99(13.03)         41.88(14.50)               43.27(14.80)
           BMI (kg/m2 , SD)               16.76(2.56)          17.10(2.63)          18.01(3.20)                18.79(3.20)
            Stunting (%)                  1504(10.3)            456(6.3)             503(4.9)                   1136(6.5)
           Underweight (%)                 250(1.7)             121(1.7)             115(1.1)                    78(0.4)
          Normal weight (%)               12731(87.5)          6438(89.4)           8436(82.3)                 13051(75.2)
           Overweight (%)                  114(0.8)             177(2.5)             673(6.6)                  1835(10.6)
              Obese (%)                     12(0.1)              28(0.4)             564(5.5)                   1343(7.7)
                                              Abbreviation: SD, standard deviation.

      Table 2. Six core items of physical fitness among children and adolescents aged 7–18 in Xinjiang, from
      1985 to 2014.

                      Physical Fitness Status                    1985            1995              2005              2014
                Physical fitness indicator (SD)                     0            2(3.7)         −2.8(4.1)          −3.8(4.8)
                Forced vital capacity (ml, SD)                2350.6(918.4)   2450.7(944.1)    1797(816.5)       1868.3(866.7)
                Standing long jump (cm, SD)                    163.2(33.1)     170.5(34.1)     163.5(35.6)        155(39.9)
                   Sit-and-reach (cm, SD)                       9.2(5.5)        9.7(5.5)         8.7(6.2)          7.3(6.1)
                        50 m dash (s)                            9.7(1.3)       9.3(1.3)         9.7(1.4)           9.9(1.6)
                    Body muscle strength
         Number of oblique body pull-ups (boys aged
                                                               18.0(11.8)      29.4(14.7)        22.3(17.2)       21.2(14.1)
                           7–12, SD)
          Number of pull-ups (boys aged 13–18, SD)              5.3(4.6)        6.2(4.3)          2.9(3.7)         4.8(4.3)
         Number of 1-min sit-ups (girls aged 7–18, SD)         20.6(10.3)      28.0(9.8)         22.4(10.5)       19.7(10.8)
                   Endurance running (s)
         8×50 m shuttle run (students aged 7–12, SD)          116.4(11.6)     117.3(12.2)      128.0(14.2)        133.3(17.4)
              1000 m run (boys aged 13–18, SD)                250.6(25.3)     250.5(26.7)      274.8(34.9)        267.1(41.3)
               800 m run (girls aged 13–18, SD)               242.8(24.8)     241.1(24.2)      266.8(33.4)        269.3(37.9)

     Table 3 shows the trend in the PFI of children and adolescents in Xinjiang by age group and sex
during 1985–2014. The PFI of all age groups reached a peak in 1995, followed in descending order
by 1985, 2005, and 2014, except for the PFI in boys aged 13–15 and 16–18 in 2014, which was slightly
increased. From 1985 to 1995, the largest increment occurred in boys aged 13–15 (by 2.8) and girls aged
16–18 (by 2.5). From 1995 to 2005, the largest decline occurred in adolescents aged 10–12, by −5.5 in
boys and by −5.3 in girls. The trend seemed better for adolescents aged 13–18 than for children aged
7–12. All changes among the different age groups and years were significant (P < 0.001).
     Figures 1 and 2 shows the trends in the six core items of physical fitness among children and
adolescents in Xinjiang aged 7–18, from 1985 to 2014. The components of fitness increased over time from
1985 to 1995 in all age groups (age 7–18) except for sit-and-reach and endurance running, which remained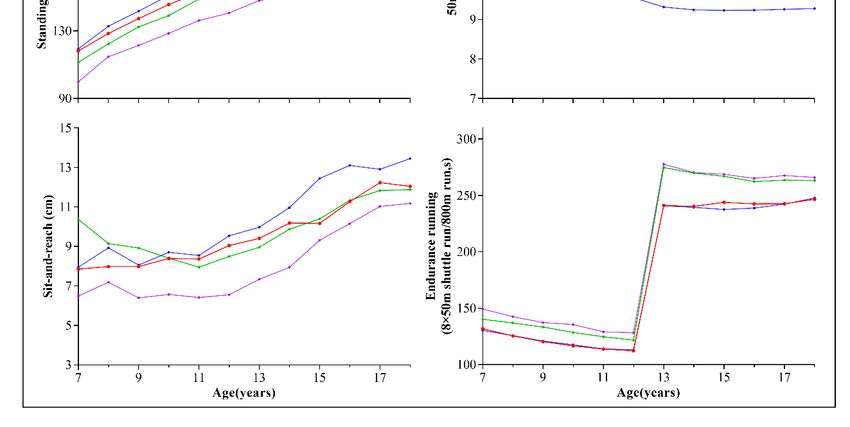
Int. J. Environ. Res. Public Health 2020, 17, 2195                                                                                  5 of 14

relatively stable. However, during 1995–2005, performance declined for all age groups, especially for FVC.
Although most elements of physical fitness declined from 2005 to 2014, it should be noted that we observed
an increment in FVC among adolescents aged 13–18 and muscle strength in boys aged 13–18.
      Int. J. Environ. Res. Public Health 2020, 17, x                                                                          5 of 14
      Table 3. Physical fitness indicators of children and adolescents in Xinjiang for different age groups,
           Table 3. Physical fitness indicators of children and adolescents in Xinjiang for different age groups,
      1985 to 2014.
            1985 to 2014.
                            1985        1995           2005             2014
                           1985          1995             2005              2014
        Age
         Age(yr)
             (yr)             Mean        Mean(SD)         Mean            Mean        H H                                   PP
                       N N Mean  (SD) NN Mean      N N     Mean (SD) N N     Mean (SD)
                               (SD)        (SD)            (SD)             (SD)
          Boys
           Boys
          7-9yr      1817          0          900         1.7(3.6)     1212      −2.9(4.4) 2192        −5.0(4.2)     1872.74 <0.001
           7-9yr
         10-12yr       1817
                     1819          00        900
                                              900       1.7(3.6)
                                                          2.3(4.2)   1212
                                                                       1316   −2.9(4.4)       2153 −5.0(4.2)
                                                                                 −3.2(5.0) 2192                      1502.82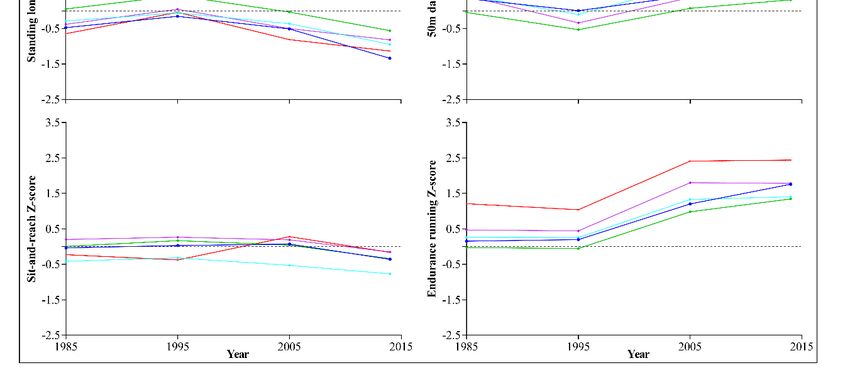
Int. J.Int.
        Environ.    Res.Res.
            J. Environ.  Public Health
                             Public        2020,17,
                                         2020,
                                    Health       17,2195
                                                     x                                                      6 of 146 of 14

       Figure 2. Trends in the six core items of physical fitness among girls aged 7–18 in Xinjiang, from
       1985Figure 2. Trends in the six core items of physical fitness among girls aged 7–18 in Xinjiang, from 1985
            to 2014.
            to 2014.
         Figure 3 shows the trend in PFI among children and adolescents in Xinjiang, according to different
nutritional  Figure     1 and
                  status,      2 shows
                            from     1985 the  trendsCompared
                                           to 2014.   in the six core
                                                                  withitems of the
                                                                         1985,  physical
                                                                                   PFI offitness among children
                                                                                            all children           and
                                                                                                         and adolescents
        adolescents in Xinjiang aged 7–18, from 1985 to 2014. The components of fitness increased over time
reached its peak in 1995 and then experienced a sharp decline in 2005, followed by a slight decline in
        from 1985 to 1995 in all age groups (age 7–18) except for sit-and-reach and endurance running, which
2014. The PFI of children and adolescents with normal weight in all years was higher than in those
        remained relatively stable. However, during 1995–2005, performance declined for all age groups,
with     stunting,
 Int. J.especially
         Environ.      underweight,
                  Res.for
                       Public
                          FVC.Health 2020,overweight,
                                Although  17,most
                                             x          and obesity.                                             7 of 14
                                                   elements of physical fitness declined from 2005 to 2014, it should
      be noted that we observed an increment in FVC among adolescents aged 13–18 and muscle strength
      in boys aged 13–18.
           Figure 3 shows the trend in PFI among children and adolescents in Xinjiang, according to
      different nutritional status, from 1985 to 2014. Compared with 1985, the PFI of all children and
      adolescents reached its peak in 1995 and then experienced a sharp decline in 2005, followed by a
      slight decline in 2014. The PFI of children and adolescents with normal weight in all years was higher
      than in those with stunting, underweight, overweight, and obesity.

       Figure 3. Trend in the physical fitness indicator (PFI) of children and adolescents in Xinjiang,
       Figure 3. Trend in the physical fitness indicator (PFI) of children and adolescents in Xinjiang, according
       according to nutritional status, 1985 toto 2014.
       to nutritional status, 1985 to 2014.

     Trends in the six core items of physical fitness among children and adolescents in Xinjiang
during 1985-2014, according to nutritional status, are shown in Figures 4 and 5. Overall, except for
FVC and sit-and-reach, students with normal weight status had the best results, whereas those with
obesity showed the lowest results for each measure of physical fitness during 1985–2014. Among the
six core items, FVC and endurance running showed the greatest changes during 1995–2005, especially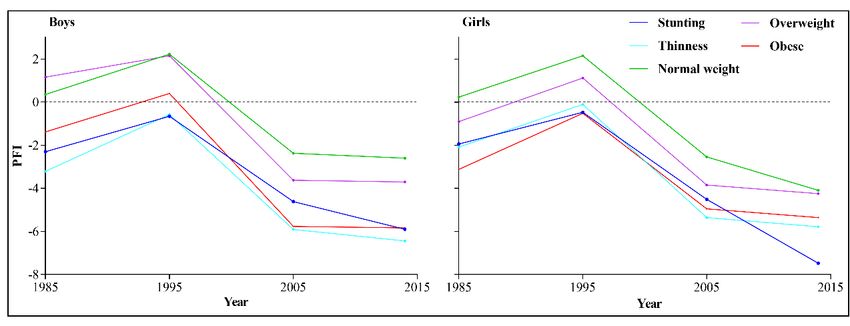
Int. J.Figure
        Environ.3.Res. Publicin
                    Trend     Health
                                the 2020, 17, 2195
                                     physical   fitness indicator (PFI) of children and adolescents in Xinjiang, 7 of 14
     according to nutritional status, 1985 toto 2014.

       Trends in the six core items of physical fitness among children and adolescents in Xinjiang during
      Trends in the six core items of physical fitness among children and adolescents in Xinjiang
 1985-2014, according to nutritional status, are shown in Figures 4 and 5. Overall, except for FVC and
during 1985-2014, according to nutritional status, are shown in Figures 4 and 5. Overall, except for
 sit-and-reach, students with normal weight status had the best results, whereas those with obesity
FVC and sit-and-reach, students with normal weight status had the best results, whereas those with
 showed the lowest results for each measure of physical fitness during 1985–2014. Among the six
obesity showed the lowest results for each measure of physical fitness during 1985–2014. Among the
 core items, FVC and endurance running showed the greatest changes during 1995–2005, especially
six core items, FVC and endurance running showed the greatest changes during 1995–2005, especially
 endurance running for the group with obesity. Students with obese status had the highest FVC and
endurance running for the group with obesity. Students with obese status had the highest FVC and
 sit-and-reach results, whereas students with stunting had the lowest FVC and those with underweight
sit-and-reach results, whereas students with stunting had the lowest FVC and those with
 had the lowest sit-and-reach results.
underweight had the lowest sit-and-reach results.

              4. Trends
      Figure 4.
     Figure      Trendsininthe sixsix
                             the   core items
                                      core     of physical
                                            items          fitnessfitness
                                                    of physical    amongamong
                                                                          boys in boys
                                                                                  Xinjiang with different
                                                                                        in Xinjiang  withnutritional
                                                                                                          different
      status, 1985  to 2014.
     nutritional status, 1985 to 2014.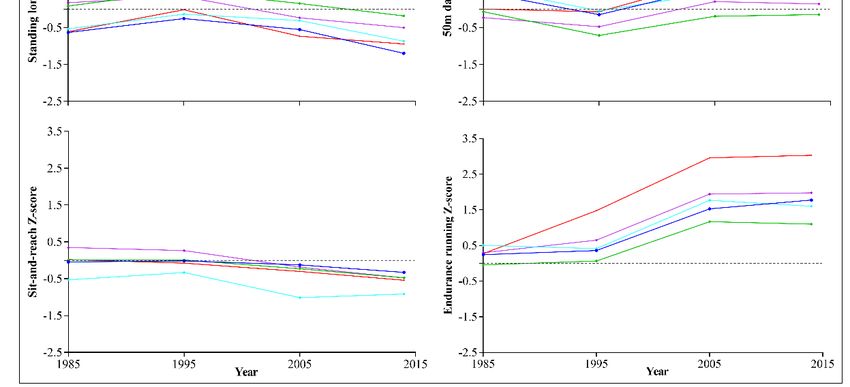
Int.Int.  J. Environ.
      J. Environ.  Res.Res. Public
                        Public     Health
                               Health       17,17,
                                          2020,
                                      2020,     x 2195                                                                 8 of
                                                                                                                    8 of 14 14

                   Trends in
        Figure5.5.Trends
      Figure               in the
                              thesix
                                  sixcore
                                      coreitems of physical
                                             items          fitness
                                                   of physical      among
                                                                 fitness   girls ingirls
                                                                         among      Xinjiang with different
                                                                                         in Xinjiang        nutritional
                                                                                                     with different
        status, 1985  to 2014.
      nutritional status, 1985 to 2014.

     We Wealso
            alsoestimated
                  estimatedthe
                             therelationship
                                  relationshipbetween
                                                betweenBMIBMIZ-score
                                                                 Z-scoreandandPFIPFIZ-score
                                                                                      Z-scoreforforchildren
                                                                                                     childrenand
                                                                                                               and
  adolescents  aged  7–18 in Xinjiang from 1985  to 2014 and  revealed   inverted  U-shaped   curves.
adolescents aged 7–18 in Xinjiang from 1985 to 2014 and revealed inverted U-shaped curves. This         This result
  indicates
result      that higher
       indicates        or lower
                 that higher      BMI had
                              or lower  BMIa had
                                             negative effect on
                                                  a negative     the PFI
                                                              effect      of children
                                                                     on the           and adolescents
                                                                              PFI of children            (Figure 6).
                                                                                              and adolescents
(Figure 6).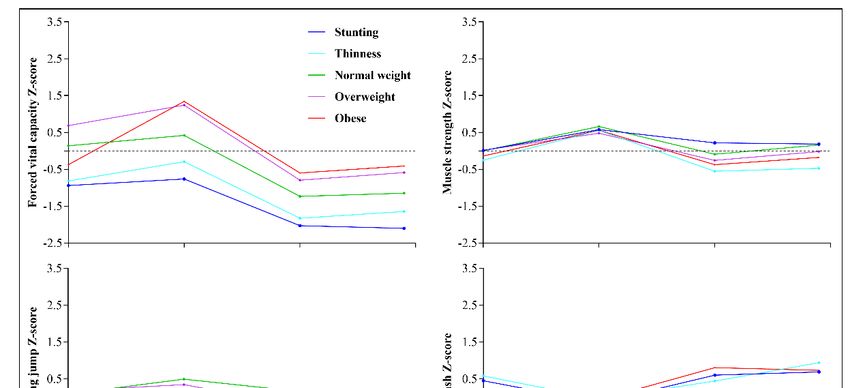
Int.
Int. J.J. Environ.
Environ. Res.
Res.Public
PublicHealth
Health2020,
2020,17,
17,x2195 99 of
of 14
14
Figure 6. Relationship between body mass index (BMI) Z-score and PFI Z-score for children and
Figure 6. Relationship between body mass index (BMI) Z-score and PFI Z-score for children and
adolescents in Xinjiang, 1985 to 2014.
adolescents in Xinjiang, 1985 to 2014.
4. Discussion
4. Discussion
We assessed secular trends in the PFI of children and adolescents aged 7–18 in Xinjiang from
1985 We assessed
to 2014 secular
using the data trends
of 49,357inindividuals
the PFI of children
extractedand fromadolescents
four roundsaged of the7–18 in Xinjiang
CNSSCH. from
The current
1985 to 2014
study’s using
findings the data
suggest thatofthe
49,357
PFI individuals
of this groupextracted
of childrenfrom and four rounds ofreached
adolescents the CNSSCH.its peak Thein
current
1995, withstudy’s findings
the largest suggest in
increment that theaged
boys PFI 13–15
of thisandgroup ofaged
girls children
16–18.andWeadolescents
also observed reached
a sharpits
peak in 1995,
decline with in
(by 290%) thethelargest
PFI ofincrement in boys
these children andaged 13–15 andingirls
adolescents 2014aged 16–18. Wewith
as compared also1995,
observed
with
athe
sharp decline
largest (by 290%)
decline occurringin theinPFI
bothof boys
these andchildren
girlsand
aged adolescents in 2014 aswith
10–12. Consistent compared
the trendwithin1995,
PFI,
with
duringthe1985–2014,
largest decline occurring inofboth
the prevalence normalboysweight
and girls aged
also 10–12.
peaked in Consistent
1995. Childrenwith and
the trend in PFI,
adolescents
during
with both 1985–2014, the prevalence
overnutrition of normal
and undernutrition hadweight
pooreralso peaked
physical in 1995.
fitness thanChildren
those with and adolescents
normal weight
with both overnutrition and undernutrition had poorer physical fitness
and height. The inverted U-shaped curves obtained for the relationship between BMI Z-score and PFI than those with normal
weight
Z-scoreand height.that
indicated ThePFI inverted U-shaped
can improve with curves
normal obtained
weightfor the relationship between BMI Z-score
status.
and PFIOurZ-score
study’sindicated
findings that PFI can
suggest that,improve
from 1985 with to normal
2014, the weight
PFI ofstatus.
children and adolescents aged
7–12Our study’s showed
in Xinjiang findingsasuggest
greater that,
declinefromthan1985 to 2014,
in those agedthe13–18.
PFI of Thischildren
might and
be adolescents
explained by aged
the
7–12 in Xinjiang
inclusion of PE inshowed a greater
both senior high decline than in those
school entrance aged 13–18.
examinations This might
(students be explained
participate by and
at age 15) the
inclusion of PE inexaminations
college entrance both senior high school entrance
(students participate examinations
at age 18); (students
however, participate
primary school at ageentrance
15) and
college entrance
examinations wereexaminations
not included(students
(students participate
participate at age age12).
18);This
however, primary
also reveals the school entrance
shortcomings of
examinations
China’s PE classeswere and
not included
exam-oriented(students participate at
PE curriculum. age 12). the
Recently, ThisChinese
also reveals
healthythePE shortcomings
curriculum
of China’s
model PE classes
[22,23], developedand exam-oriented
by Professor Ji was PE curriculum.
introduced,Recently,
aiming tothe Chinese
improve healthyphysical
students’ PE curriculum
fitness
model [22,23],
by helping developed
students by Professor
to enjoy Ji was introduced,
PE and engage in at least one aiming
sport toasimprove
a hobby. students’ physical
At present, this fitness
model
by
hashelping students throughout
been promoted to enjoy PE the andcountry
engage in andat aleast
largeone sport as
number of aChinese
hobby. PE
At present,
teachers thishavemodel
been
has been
trained inpromoted throughout
the use of the the country
model [24–26]. and a large
More effective number
teaching modelsof Chinese
must bePE teachers to
developed, have been
promote
trained
physicalin the use
fitness of the model
in Chinese students. [24–26]. More effective teaching models must be developed, to
promote physical fitness in Chinese students.Int. J. Environ. Res. Public Health 2020, 17, 2195 10 of 14
The present study showed that both malnutrition and overnutrition have adverse effects on
physical fitness, which is consistent with previous studies [27,28]. The prevalence of stunting and
underweight in 1985 was 10.3% and 1.7%, respectively, and the prevalence of overweight and obesity
combined was 0.9%; the former was likely the cause of the decline in physical fitness. Whereas, in 2014,
the prevalence of stunting and underweight declined to 6.5% and 0.4%, respectively, and the prevalence
of overweight and obesity combined increased to 18.3%, and the latter may have driven the decline in
physical fitness. Widespread obesity, which is caused by increased physical inactivity and sedentary
time, has become a public health issue all over the world, including in China [29–31]. Improving physical
fitness is undoubtedly the best choice for increasing physical activity and reducing sedentary time
among children and adolescents in Xinjiang [32,33].
Given the low rates of participation in physical activity globally, the decline in physical fitness
in the current study is partly affected by physical inactivity in children and adolescents, which has
profound implications [34]. Strong evidence demonstrates that higher levels of physical activity are
associated with multiple beneficial health outcomes, including cardiorespiratory and muscular fitness,
bone health, and the maintenance of healthy weight in children and adolescents [35]. The 2018 Physical
Activity Guidelines Advisory Committee Scientific Report overwhelmingly demonstrates that physical
activity is a “best buy” for public health [2]. The World Health Organization has issued the global
health recommendation that children and adolescents should engage in moderate to vigorous physical
activity for at least 60 min a day [36]. Unfortunately, only 30% of Chinese children and adolescents
meet this recommendation for daily physical activity [37]. As an underdeveloped province in China,
the sports facilities in schools and communities of Xinjiang are relatively lacking [38]. According to
the results of the fifth national survey of sports venues in China during 2004 [39], two-thirds of
primary schools in Xinjiang lacked regular sports venues, especially in rural areas. In addition, parents’
education level is low, and the holding rate of health literacy was only 2.1% for Xinjiang residents in
2010, which is much lower than the national average [40]. Sedentary behavior has been associated with
a wide range of negative health indicators, including obesity, poor cardiometabolic health, and poor
psychosocial health [41]. Studies of Chinese adolescent populations have shown a rising trend in
sedentary behavior [42] and that 37% of Chinese school-aged children do not adhere to the daily
screen-viewing recommendations of 2 h or less [43]. Thirty years of economic development in China
have brought about a behavioral shift from traditionally active lifestyles to more industrialized and
sedentary lifestyles. According to the Internet development report of Xinjiang Uygur Autonomous
Region in 2016, Internet penetration reached 54.9%, which is higher than the national average [44].
Therefore, current efforts should focus on effectively improving physical activity and reducing sedentary
behavior as well as improving nutritional status. Improving physical fitness among children and
adolescents requires joint efforts by schools, families, and communities [34]. In addition to the home,
school is another place where students spend most of their time; thus, school may be a priority target
for improving exercise and promoting physical fitness among students [45].
With a heavy schoolwork burden and college entrance examination pressure, the sedentary time
has increased rapidly in recent years, which may be the cause of physical decline among Chinese
children and adolescents, especially during 1995–2005. This continuous decline in physical fitness
among children and adolescents has attracted the attention of the Chinese government, which has
established many policies to promote physical health, such as the “Healthy China 2030” program [46],
seeking to make time for more PE classes and the practice of an hour of exercise per day [47] as well as
increasing investment in school sports facilities. The gross domestic product of Xinjiang was ranked
fifth lowest in China in 2014, and the urbanization rate was 46.07%, which is also a relatively low
level [48]. The published literature suggests that attention should be focused on undernutrition rather
than overnutrition to promote physical fitness in less-developed regions of China [49,50], whereas in
developed regions, issues of overnutrition should be on the agenda. Therefore, to improve the physical
fitness levels of children and adolescents in Xinjiang, specific policies should be set according to the
actual nutritional and socio-economic development status. Nutrition subsidies and nutrition projectsInt. J. Environ. Res. Public Health 2020, 17, 2195 11 of 14
should be carried out in southern Xinjiang and rural areas, where undernutrition remains a serious
problem [51]. In contrast, consumption should be limited by raising taxes on energy- and sugar-rich
foods and drinks in provincial capital cities and urban areas, where the prevalence of overweight and
obesity are higher [52]. In addition, actions should be taken to develop a healthy lifestyle and regular
sleep habits and to promote physical fitness.
An advantage of having fitness measures from the four surveys is the consistency among
measurement protocols. However, there are some limitations to the current study. First, we only
evaluated the impact of nutritional status on physical fitness, whereas other factors, such as diet,
physical exercise, and family environment were not included; these may be important factors affecting
physical fitness among children and adolescents in Xinjiang. Second, a standardized and accepted
method is lacking for assessing physical fitness at present. The PFI was assessed using the combination
of performance results for FVC, standing long jump, sit-and-reach, body muscle strength, 50-m dash,
and endurance running in the present study. The physical fitness level of children and adolescents in
Xinjiang may not be comprehensive and accurately evaluated using PFI; however, this indicator can
still represent physical fitness levels to some extent12 .
5. Conclusions
This study provides an update regarding the physical fitness of children and adolescents in
Xinjiang, China. The results demonstrate that physical fitness levels reached their peak in 1995, followed
by continuous declines in 2005 and 2014. The lack of progress in physical fitness suggests that efforts
to improve fitness and behaviors of healthy, active living among children and adolescents in Xinjiang
have been insufficient; thus, ongoing enhanced efforts are required. Students with overnutrition and
children age 7–12 require special attention. Effective new teaching models are also needed, such as the
Chinese healthy PE curriculum model, rather than focusing solely on PE examinations.
Author Contributions: Conceptualization, C.B.; Data curation, F.Z., Y.S. and X.C.; Formal analysis, C.B., F.Z. and
Y.S.; Funding acquisition, Y.S. and X.C.; Investigation, Y.G., Y.S. and X.C.; Methodology, C.B.; Project administration,
Y.S.; Resources, F.Z., Y.G., Y.S. and X.C.; Software, F.Z.; Supervision, C.B. and Y.G.; Validation, Y.G. and X.C.;
Visualization, X.C.; Writing—original draft, C.B.; Writing—review & editing, F.Z. All authors have read and agreed
to the published version of the manuscript.
Funding: This research received no external funding.
Acknowledgments: We wish to thank all the staff in CNSSCH and the participants and their families who made
this study possible.
Conflicts of Interest: The authors declare no conflict of interest.
References
1. Corbin, C.B. Fitness for Life; Human Kinetics: Champaign, IL, USA, 2014.
2. 2018 Physical Activity Guidelines Advisory Committee. 2018 Physical Activity Guidelines Advisory Committee
Scientific Report; Department of Health and Human Services: Washington, DC, USA, 2018.
3. Colley, R.C.; Clarke, J.; Doyon, C.Y.; Janssen, I.; Lang, J.J.; Timmons, B.W.; Tremblay, M.S. Trends in Physical
Fitness among Canadian Children and Youth; Statistics Canada: Ottawa, ON, Canada, 2019.
4. Ortega, F.B.; Ruiz, J.R.; Castillo, M.J.; Sjostrom, M. Physical fitness in childhood and adolescence: A powerful
marker of health. Int. J. OBES (Lond.) 2008, 32, 1–11. [CrossRef] [PubMed]
5. Ruiz, J.R.; Castro-Pinero, J.; Artero, E.G.; Ortega, F.B.; Sjostrom, M.; Suni, J.; Castillo, M.J. Predictive validity
of health-related fitness in youth: A systematic review. Br. J. Sports Med. 2009, 43, 909–923. [CrossRef]
[PubMed]
6. Ekelund, U.; Anderssen, S.A.; Froberg, K.; Sardinha, L.B.; Andersen, L.B.; Brage, S.; European Youth Heart
Study Group. Independent associations of physical activity and cardiorespiratory fitness with metabolic risk
factors in children: The European youth heart study. Diabetologia 2007, 50, 1832–1840. [CrossRef] [PubMed]Int. J. Environ. Res. Public Health 2020, 17, 2195 12 of 14
7. Zaqout, M.; Vyncke, K.; Moreno, L.A.; De Miguel-Etayo, P.; Lauria, F.; Molnar, D.; Lissner, L.; Hunsberger, M.;
Veidebaum, T.; Tornaritis, M.; et al. Determinant factors of physical fitness in European children. Int. J.
Public Health 2016, 61, 573–582. [CrossRef]
8. Gahche, J.; Fakhouri, T.; Carroll, D.D.; Burt, V.L.; Wang, C.-Y.; Fulton, J.E. Cardiorespiratory fitness levels
among U.S. youth aged 12–15 years: United States, 1999–2004 and 2012. NCHS Data Brief 2014, 153, 1–8.
9. Tremblay, M.S.; Shields, M.; Laviolette, M.; Craig, C.L.; Janssen, I.; Gorber, S.C. Fitness of Canadian children
and youth: Results from the 2007–2009 Canadian Health Measures Survey. Health Rep. 2010, 21, 7–20.
10. Muthuri, S.K.; Wachira, L.J.; Leblanc, A.G.; Francis, C.E.; Sampson, M.; Onywera, V.O.; Tremblay, M.S.
Temporal trends and correlates of physical activity, sedentary behaviour, and physical fitness among
school-aged children in Sub-Saharan Africa: A systematic review. Int. J. Environ. Res. Public Health 2014, 11,
3327–3359. [CrossRef]
11. Tomkinson, G.R.; Leger, L.A.; Olds, T.S.; Cazorla, G. Secular trends in the performance of children and
adolescents (1980–2000): An analysis of 55 studies of the 20m shuttle run test in 11 countries. Sports Med.
2003, 33, 285–300. [CrossRef]
12. Dong, Y.; Lau, P.W.C.; Dong, B.; Zou, Z.; Yang, Y.; Wen, B.; Ma, Y.; Hu, P.; Song, Y.; Ma, J.; et al. Trends in
physical fitness, growth, and nutritional status of Chinese children and adolescents: A retrospective
analysis of 1·5 million students from six successive national surveys between 1985 and 2014. Lancet Child.
Adolesc. Health 2019, 3, 871–880. [CrossRef]
13. Bi, C.; Yang, J.; Sun, J.; Song, Y.; Wu, X.; Zhang, F. Benefits of normal body mass index on physical fitness: A
cross-sectional study among children and adolescents in Xinjiang Uyghur Autonomous Region, China. PLoS
ONE 2019, 14, e0220863. [CrossRef]
14. Yusufu, A.; Wu, J.; Ren, X. Analysis and countermeasures on the dynamic changes of constitution of primary
and middle school students of Han, Uyghur, Mongol and Khalkhas nationalities in Xinjiang. J. Xinjiang Norm.
Univ. (Nat. Sci. Ed.) 2010, 29, 30–36.
15. Baidu Encyclopedia of Xinjiang Uygur Autonomous Region. Available online: https:
//baike.baidu.com/item/%E6%96%B0%E7%96%86/132263?fromtitle=%E6%96%B0%E7%96%86%E7%
BB%B4%E5%90%BE%E5%B0%94%E8%87%AA%E6%B2%BB%E5%8C%BA&fromid=906636&fr=aladdin
(accessed on 20 February 2020).
16. Yan, W. Study on the Status and Cultural Influence of Mongolian Religious Belief in Contemporary Xinjiang.
Master’s Thesis, Northwest University for Nationalities, Lanzhou, China, 2019.
17. Ablikim, R. Marriage customs and development status of ethnic minorities in Xinjiang – taking uygur as an
example. Jiannan Lit. 2012, 177–178.
18. Peng, Q. Unity and diversity of ethnic cultures in Xinjiang. J. Party Sch. Xinjiang Prod. Constr. Corps 2012, 5,
50–57.
19. Huang, Y.F. Festival customs and gender awareness of ethnic minorities in Xinjiang. Mod. Commun. 2011, 11,
77–78.
20. CNSSCH Association. Report on the 2014th National Survey on Students’ Constitution and Health; China College
& University Press: Beijing, China, 2016.
21. Huang, Y.-C.; Malina, R.M. BMI and Health-Related Physical Fitness in Taiwanese Youth 9–18 Years. Med. Sci.
Sports Exerc. 2007, 39, 701–708. [CrossRef]
22. Ji, L. Reflection and Construction of Physical Education and Health Curriculum Model in China. J. Beijing
Sport Univ. 2015, 38, 72–80.
23. Ji, L. A Re-study on the Theoretical and Practical Problems of Healthy Physical Education Curriculum Model
of China. J. Beijing Sport Univ. 2019, 42, 12–22.
24. China News. Available online: https://baijiahao.baidu.com/s?id=1635960815796359263&wfr=spider&for=pc.
(accessed on 20 February 2020).
25. Souhu. Available online: http://www.sohu.com/a/150881726_503742 (accessed on 20 February 2020).
26. Li, D. A Study on the Effectiveness of Chinese Healthy Physical Education Curriculum Model. Master’s
Thesis, Hebei Normal University, Shijiazhuang, China, 2018.
27. Zhang, Y.; Liu, S.; Li, Y.; Li, X.; Ren, P.; Luo, F. The Relationships Between Weight Status and Physical Fitness
Among Chinese Children and Youth. Res. Q. Exerc Sport 2019, 90, 113–122. [CrossRef]Int. J. Environ. Res. Public Health 2020, 17, 2195 13 of 14
28. Ruedl, G.; Greier, N.; Niedermeier, M.; Posch, M.; Prunster, V.; Faulhaber, M.; Burtscher, M. Factors Associated
with Physical Fitness among Overweight and Non-Overweight Austrian Secondary School Students. Int. J.
Environ. Res. Public Health 2019, 16, 4117. [CrossRef]
29. US Preventive Services Task Force. Screening for Obesity in Children and Adolescents: US Preventive
Services Task Force Recommendation Statement. JAMA 2017, 317, 2417–2426. [CrossRef]
30. Global Burden of Disease (GBD) 2015 Obesity Collaborators. Health Effects of Overweight and Obesity in
195 Countries over 25 Years. N. Engl. J. Med. 2017, 377, 13–27. [CrossRef] [PubMed]
31. Lobstein, T.; Jackson-Leach, R.; Moodie, M.L.; Hall, K.D.; Gortmaker, S.L.; Swinburn, B.A.; James, W.P.T.;
Wang, Y.; McPherson, K. Child and adolescent obesity: Part of a bigger picture. Lancet 2015, 385, 2510–2520.
[CrossRef]
32. Zhu, Z.; Tang, Y.; Zhuang, J.; Liu, Y.; Wu, X.; Cai, Y.; Wang, L.; Cao, Z.; Chen, P. Physical activity, screen
viewing time, and overweight/obesity among Chinese children and adolescents: An update from the
2017 physical activity and fitness in China—The youth study. BMC Public Health 2019, 19, 197. [CrossRef]
[PubMed]
33. Sun, Q.; LeBlanc, A.G.; Katzmarzyk, P.T.; Barreira, T.V.; Broyles, S.T.; Chaput, J.-P.; Church, T.S.; Fogelholm, M.;
Harrington, D.M.; Hu, G.; et al. Correlates of Total Sedentary Time and Screen Time in 9–11 Year-Old
Children around the World: The International Study of Childhood Obesity, Lifestyle and the Environment.
PLoS ONE 2015, 10, e0129622. [CrossRef]
34. Li, F.; Chen, P. Addressing the public health concerns of physical inactivity, low levels of fitness, and unhealthy
weight among Chinese school-aged children. J. Sport Health Sci. 2017, 6, 379–380. [CrossRef] [PubMed]
35. Physical Activity Guidelines Advisory Committee. Physical Activity Guidelines Advisory Committee Report,
2008; Department of Health and Human Services: Washington, DC, USA, 2008.
36. WHO. Global Recommendations on Physical Activity for Health; World Health Organization: Geneva, Switzerland,
2010.
37. Fan, X.; Cao, Z.B. Physical activity among Chinese school-aged children: National prevalence estimates
from the 2016 Physical Activity and Fitness in China-The Youth Study. J. Sport Health Sci. 2017, 6, 388–394.
[CrossRef]
38. Wang, X.; Wang, R. Equalization of sports public services in ethnic minority areas. Sports Sci. Technol. Lit.
Bull. 2018, 26, 19–38.
39. Zhao, W.; Zhao, R.; Dong, C. Investigation and analysis on the development of sports venues in northern
Xinjiang. J. Xi’an Univ. Phys. Educ. 2005, 4, 48–51.
40. Maira, H.; Krim, R.; Li, F.; Li, Y. Survey and analysis on health literacy level of some urban and rural residents
in xinjiang in 2008. Bull. Dis. Control Prev. 2013, 28, 12–13.
41. Simon, C.; Wagner, A.; DiVita, C.; Rauscher, E.; Klein-Platat, C.; Arveiler, D.; Schweitzer, B.; Triby, E.
Intervention centred on adolescents’ physical activity and sedentary behaviour (ICAPS): Concept and
6-month results. Int. J. OBES 2004, 28, S96–S103. [CrossRef]
42. Cui, Z.; Hardy, L.L.; Dibley, M.J.; Bauman, A. Temporal trends and recent correlates in sedentary behaviours
in Chinese children. Int. J. Behav. Nutr. Phys. Act. 2011, 8, 93. [CrossRef]
43. Cai, Y.; Zhu, X.; Wu, X. Overweight, obesity, and screen-time viewing among Chinese school-aged children:
National prevalence estimates from the 2016 Physical Activity and Fitness in China-The Youth Study.
J. Sport Health Sci. 2017, 6, 404–409. [CrossRef]
44. Xinjiang Uygur Autonomous Region’s 2018 Statistical Bulletin on National Economic and Social Development.
Available online: http://www.tjcn.org/tjgb/31xj/35841.html (accessed on 20 February 2020).
45. Zhong, W. To explore the development of guangzhou school sports new ideas by improving the physical
fitness of students as a starting point. Phys. Educ. 2018, 38, 27–28.
46. Tan, X.; Zhang, Y.; Shao, H. Healthy China 2030, a breakthrough for improving health. Glob. Health Promot.
2019, 26, 96–99. [CrossRef]
47. Ministry of Education: To Ensure 1 Hour Campus Sports Activities per Day for Primary and Secondary
School Students. Available online: http://www.gov.cn/jrzg/2011-09/15/content_1947847.htm (accessed on
20 February 2020).
48. Ministry of Housing and Urban-Rural Development of the People’s Republic of China. Available online: http://
www.mohurd.gov.cn/ztbd/xyjg60zn/xyjggzdt/200909/t20090.915_195130.html (accessed on 20 February 2020).Int. J. Environ. Res. Public Health 2020, 17, 2195 14 of 14
49. Dong, Y.; Ma, Y.; Dong, B.; Zou, Z.; Hu, P.; Wang, Z.; Yang, Y.; Song, Y.; Ma, J. Geographical variation and
urban-rural disparity of overweight and obesity in Chinese school-aged children between 2010 and 2014:
Two successive national cross-sectional surveys. BMJ Open 2019, 9, e025559. [CrossRef]
50. Dong, Y.; Bennett, K.; Jan, C.; Dong, B.; Zou, Z.; Hu, P.; Wang, Z.; Yang, Z.; Wang, X.; Wen, B.; et al.
Subnational variation of stunting, wasting and malnutrition in Chinese primary-school children between
2010 and 2014: Urban-rural disparity. Public Health Nutr. 2019, 22, 2043–2054. [CrossRef]
51. Yang, Y.; Luo, J.; Memetmin, T.; Shen, J.; Wang, L.; Yan, L. Physical development of rural junior high school
students in Hetian and Kashgar, Xinjiang, 2012–2016. Pract. Prev. Med. 2017, 24, 931–934.
52. Mei, C. Study on Prevalence of Obesity and its Influencing Factors in Physical Examination Population in
Urumqi, Xinjiang. Master’s Thesis, Xinjiang Medical University, Xinjiang, China, 2016.
© 2020 by the authors. Licensee MDPI, Basel, Switzerland. This article is an open access
article distributed under the terms and conditions of the Creative Commons Attribution
(CC BY) license (http://creativecommons.org/licenses/by/4.0/).You can also read