How Schools Affected the COVID-19 Pandemic in Italy: Data Analysis for Lombardy Region, Campania Region, and Emilia Region - MDPI
←
→
Page content transcription
If your browser does not render page correctly, please read the page content below
future internet

Article
How Schools Affected the COVID-19 Pandemic in Italy:
Data Analysis for Lombardy Region, Campania Region,
and Emilia Region
Davide Tosi 1, * and Alessandro Siro Campi 2

                                          1   Department of Theoretical and Applied Sciences (DiSTA), University of Insubria, 21100 Varese, Italy
                                          2   Department of Electronics, Information and Bioengineering (DEIB), Politecnico Milano, 20133 Milano, Italy;
                                              alessandro.campi@polimi.it
                                          *   Correspondence: davide.tosi@uninsubria.it

                                          Abstract: Background: Coronavirus Disease 2019 (COVID-19) is the main discussed topic worldwide
                                          in 2020 and at the beginning of the Italian epidemic, scientists tried to understand the virus diffusion
                                          and the epidemic curve of positive cases with controversial findings and numbers. Objectives: In this
                                          paper, a data analytics study on the diffusion of COVID-19 in Lombardy Region and Campania
                                          Region is developed in order to identify the driver that sparked the second wave in Italy. Methods:
                                          Starting from all the available official data collected about the diffusion of COVID-19, we analyzed
                                          Google mobility data, school data and infection data for two big regions in Italy: Lombardy Region
                                          and Campania Region, which adopted two different approaches in opening and closing schools.
                                          To reinforce our findings, we also extended the analysis to the Emilia Romagna Region. Results:
                                          The paper shows how different policies adopted in school opening/closing may have had an impact

                                   on the COVID-19 spread, while other factors related to citizen mobility did not affect the second
                                          Italian wave. Conclusions: The paper shows that a clear correlation exists between the school
Citation: Tosi, D.; Campi, A.S. How
Schools Affected the COVID-19
                                          contagion and the subsequent temporal overall contagion in a geographical area. Moreover, it is clear
Pandemic in Italy: Data Analysis for      that highly populated provinces have the greatest spread of the virus.
Lombardy Region, Campania Region,
and Emilia Region. Future Internet        Keywords: COVID-19; SARS-CoV-2; data analytics; schools’ impact; Google mobility impact
2021, 13, 109. https://doi.org/
10.3390/fi13050109

Academic Editor: Michael Sheng            1. Introduction
                                               Data analysis [1–3] has proved to be of fundamental importance for studying and
Received: 24 March 2021
                                          predicting the behavior of the pandemic of SARS-CoV2 and COVID-19, in order to intervene
Accepted: 26 April 2021
                                          promptly and stem its spread [4–6]. The school opening has been a hotly debated topic
Published: 27 April 2021
                                          nationwide and worldwide [7–9], with at one side scientists that consider schools safe and
                                          on the other side scientists who consider schools unsafe and unsecured. In our opinion,
Publisher’s Note: MDPI stays neutral
                                          school is not a safe environment by definition, but it must be made safe taking serious
with regard to jurisdictional claims in
                                          actions with rigorous protocols and structural interventions as described in [10,11]. Effects
published maps and institutional affil-
                                          of schools opening and the propagation of COVID-19 are described in other countries,
iations.
                                          such as in [12] where the effects of school openings on hospitalization in USA are modeled,
                                          or in [11] where the authors explain how UK schools are causing COVID-19 spreading and
                                          how to act to reduce their impact.
                                               The data (shown in Table 1) on the growth of infections by age groups from the
Copyright: © 2021 by the authors.
                                          beginning of September to March that are published weekly in the epidemiological reports
Licensee MDPI, Basel, Switzerland.
                                          of the ISS (Istituto Superiore Sanità) [www.iss.it] (accessed on 27 April 2021), indicate that
This article is an open access article
                                          the age group 0–9 have had a growth between 6 and 10 times higher than all other ages.
distributed under the terms and
                                          (Please note that following the ISS indication, under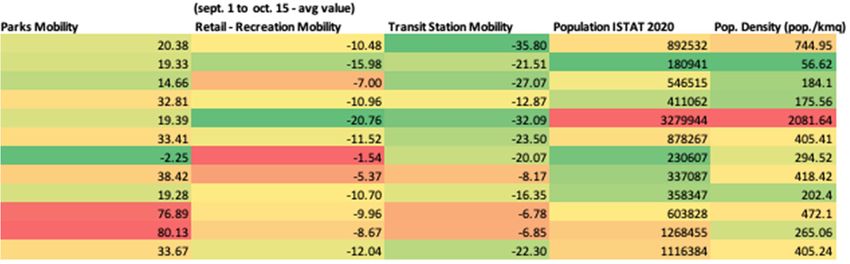
Future Internet 2021, 13, 109                                                                                            2 of 12

                                Table 1. The trend of infections between 29 December 2020 and 10 March 2021.

                                                           Number of Cases         Number of Cases
                                          Age                                                             Percentage Growth
                                                             12/29/2020               3/10/2021
                                          0–9                   78,664                  144,301                 83.44
                                         10–19                  170,048                 277,785                 63.36
                                         20–29                  245,458                 367,308                 49.64
                                         30–39                  251,226                 382,754                 52.35
                                         40–49                  326,571                 494,423                 51.40
                                         50–59                  368,635                 545,225                 47.90
                                         60–69                  229,200                 344,498                 50.30
                                         70–79                  172,071                 255,511                 48.49
                                         80–89                  149,953                 209,503                 39.71

                                     The data show that from 29 December 2020 to 10 March 2021, the infections increased
                                by 83.44% in the age group between 0 and 9 years. Additionally, 63.55% in the 10–19 age
                                range. The school age is therefore the one where the contagion has grown a little more.
                                The third group for growth is the one between 30 and 39 years, with 52.35% and almost all
                                the other age groups are below 50% growth. The older age groups registered the lowest
                                percentage growth: between the ages of 80 and 89, the contagion grew by 39.71% over the
                                period, and over 90 years even less 31.28%. These data disprove the idea that the problem
                                was that of transport, which essentially concerned the high schools (the youngest ones
                                mostly go to school on foot or are accompanied by their parents by private means).
                                     Looking at the data and statements of neighboring countries and with demographic
                                characteristics similar to ours, the situation is already well defined on how much schools
                                are drivers of contagion:
                                •    In France schools and universities have been indicated as the first factor in active
                                     outbreaks [source: Sante Publique France];
                                •    In the UK, primary and secondary school, after careful tracing, was in third place as
                                     number of reports [source: NHS Test and Trace UK];
                                •    In Germany, the school was recently declared to be at high risk in some statements
                                     made by A. Merkel herself in early February 2021;
                                •    Several papers (recently appeared in the Lancet, Nature and Science), albeit with all
                                     the stated limits in the works, show that the closure of schools is the second most
                                     impacting factor, as NPI (Non-Pharmaceutical Interventions), on the reduction of the
                                     contagiousness index Rt [13,14];
                                •    Further preliminary analyses have been carried out on the Piedmonts Region and
                                     national territory by researcher A. Ferretti and a clear relation on the increase of cases
                                     and the school opening is reported [15];
                                •    The Lazio Region was driven to an emergency state due to school contagion im-
                                     pact [16];
                                •    During the 19 March 2021 Press Conference, the Belgium Prime Minister said: “From
                                     contact analyses, we can also see that schools are key places where many infections
                                     happen,” De Croo said. “Children are infected there, take the virus home, possibly
                                     infect their parents, who may infect their colleagues if they are still going to work, and
                                     so the chain continues” [17];
                                •    We also remind you that 75% of the positives in the youth age group under 19
                                     are asymptomatic, therefore, are unaware carriers of the virus within family walls
                                     [source ISS];
                                •    In the week of mid-February 2021 alone, we collected more than 50 newspaper articles
                                     (headings national and local) that highlight outbreaks in Italian schools [18];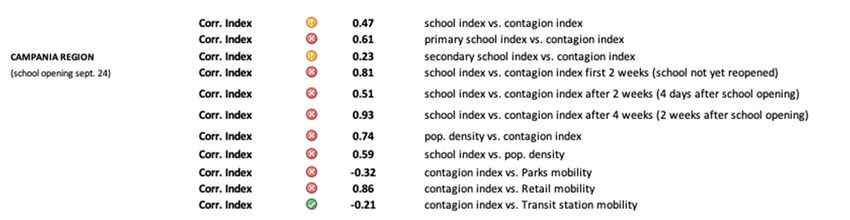
Future Internet 2021, 13, 109                                                                                            3 of 12

                                  •    Recent statements by the ISS (Higher Institute of Health) Director G. Rezza, dated
                                       26 February 2021, highlight the problem of numerous outbreaks in Italian schools.
                                        We believe the distinction between the school environment per se or extended to
                                  include the public transport and the dynamics of entering/leaving the school has no
                                  meaning. At the moment, the main contribution of the school to viral circulation must be
                                  analyzed and quantitatively assessed.
                                        Obviously, it remains of fundamental importance to determine what risks are exposed
                                  to children with school closures, which certainly impacts on mental health, cognitive
                                  development and which are fundamental in developmental age and, consequently, ar-
                                  rive at risk-weighted decisions, as described in [19–21] where the authors highlight the
                                  psychological impact school closures may have on young people.
                                        At the end of August, we presented a predictive model to show how the second wave
                                  in Italy was practically already started. The model estimated a relative peak around the
                                  7/8 of September and then a slight decline in slowdown waiting to see the strong impact,
                                  within two weeks, coming from the schools reopening (on 14 September). If there now we
                                  look back (see Figure 1), we clearly observe that the exponential explosion of the contagion
                                  in Italy started exactly on 28 September, so exactly two weeks after the reopening of the
                                  Italian schools.

                                Figure 1. Observed real curves for new daily cases and deaths in Italy.

                                       Our model was based on the hypothesis that schools are an important driver of
                                  contagion. Furthermore, the major impact is to be considered in the contagion that then
                                  happens at a second layer inside the family context, leading after about two incubation
                                  cycles of the virus. This explains why we used a time lag of 14 days, in our predictive
                                  model. Even if it is not our aim to “blame” children or teachers for these infections and
                                  we watched the school operators doing their utmost in the summer to find solutions to
                                  secure the school environment as much as possible, we cannot be blind and avoid seeing
                                  that the virus finds fertile ground for contagion in closed environments, very populated,
                                  poorly ventilated, as are our school environments which are not among the most modern
                                  in Europe. Therefore, to think that the school is a safe environment, by definition, is wrong
                                  because it has caused and will be the cause of uncontrolled virus spread.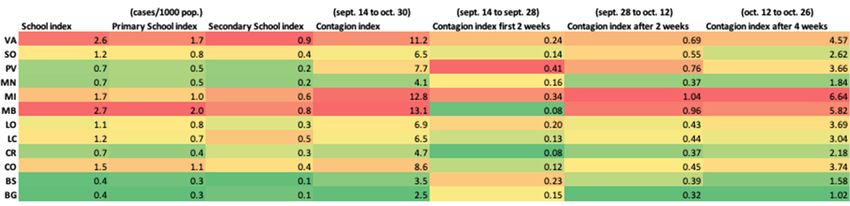
Future Internet 2021, 13, 109                                                                                               4 of 12

                                    In this paper, we want to analyze the few official MIUR (Ministry of Instruction,
                                University and Research) data available on contagion at schools, to understand whether
                                and how much the school may have impacted on the territorial contagion.

                                2. Materials and Methods
                                      In December, the MIUR published an official dataset relating to infections in schools
                                (joining different data collection) for the period 14 September 2020–30 October 2020 [22].
                                The report spoke of approximately 65,000 Italian positive cases identified in the time
                                window 14 September–30 October (we are only talking about primary and lower secondary
                                school, because most of the high schools were in any case remote). The available data
                                count 65,000 cases for the whole Italy, but they are underestimated because not all Italian
                                schools have participated in this tracking activity, and not all schools have released their
                                data to the ministry. It should also be considered that 75% of those under 19 years old are
                                asymptomatic [www.iss.it] (accessed on 27 April 2021), and this large slice of young people
                                is lost in the tracing activity. In total, 65,000 cases out of 360,000 total cases [23,24] detected
                                in the same period is a considerable percentage of 18% of the total. Furthermore, the major
                                impact is to be considered in the contagion that then arose in the second instance within
                                the family walls, leading after about two incubation cycles of the virus, to an uncontrolled
                                growth of the curves (the one that we observed from 28 September 2020 onwards in our
                                predictive model and in Figure 1).
                                      In order to understand the relation between schools and global infection, we consid-
                                ered the data officially released by the MIUR and we carried out a correlation analysis on
                                the Lombardy Region (RL) and Campania Region (RC), two regions that have adopted two
                                different policies of opening and closing schools. RL is characterized by 12 provinces for
                                a total of 10 M inhabitants, while RC has 5 provinces with 5.8 M inhabitants. Moreover,
                                we extended this analysis to a third Italian region: Emilia Romagna Region (REm) that
                                is characterized by 9 provinces and a total population of 4.5 M inhabitants. At the end,
                                the study covered 24 provinces out of 107 Italian provinces, and 20.3 M inhabitants out of
                                60.3 M total Italian inhabitants.
                                      The three regions applied the following opening/closure strategies:
                                •    RL reopened all primary and secondary schools in presence at 14 September 2020
                                     (high level secondary school with 50% attendance and 50% online) [25];
                                •    RC reopened all primary and secondary schools in presence at 24 September 2020
                                     (high level secondary school with 50% attendance and 50% online) and then all levels
                                     were closed in advance starting from the October 16 and until 13 November [26];
                                •    REm reopened all primary and secondary schools in presence at 14 September 2020
                                     (high level secondary school with 50% attendance and 50% online).
                                     Specifically, a twofold correlation study was conducted:
                                1.   between school contagion index (both total and separate for primary and secondary
                                     school, respectively) and an index of global contagion at the provincial level (both
                                     for RL and RC). The correlation study was done with a global contagion index on the
                                     reference period from 14 September 2020 to 30 October 2020 and also considering the
                                     first two weeks after the reopening of schools (from 14 September to 28 September,
                                     where the contagion theoretically should not be detectable, given the latency time
                                     between positivity and the onset of symptoms and related diagnostic screening) then
                                     in the following two weeks (from 28 September to 12 October, when it is likely that
                                     contagion was triggered in schools and then it potentially spreads in the intrafamily
                                     context), and after four weeks of spreading;
                                2.   between contagion index and mobility indexes derived from the COVID-19 Google
                                     Community Mobility Report [27], where mobility data at regional and national level
                                     in different sectors (e.g., mobility near parks and public gardens, pharmacies, at work
                                     level, train stations, residential, etc.) were analyzed.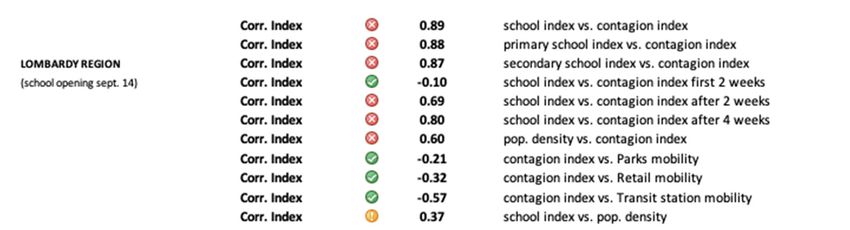
Future Internet 2021, 13, 109                                                                                            5 of 12

                                     We computed the correlation index by using the Pearson correlation index (CI), as:

                                                                                  ∑( x − x )(y − y)
                                                       correl_index (x, y) = q                                              (1)
                                                                                          2            2
                                                                                 ∑( x − x ) ∑(y − y)

                                     F-Test was then conducted on the dataset to determine if there is a significant dif-
                                ference between the means of two groups and to understand the statistical significance
                                of our findings. Linear regression models and the R2 coefficient of determination were
                                also discussed.
                                     Summarizing, all the datasets used in this study are:
                                •    Official Positive Cases at Italian Schools released by MIUR Ministry [22];
                                •    Official Positive Cases in Italy by Department of Civil Protection [24];
                                •    Rt Dataset by University of Insubria [23];
                                •    Mobility Data by Google Community [27].

                                3. Results
                                3.1. Comparing Lombardy, Campania and Emilia Romagna Contagion Indexes
                                      As for the Lombardy Region (RL), the identified cases are 13,967 out of 88,412 total
                                cases (15.8%), in the reference period September 14th–October 30th. In the Campania
                                Region (RC), the cases identified are 4620 about 42,815 total cases (10.8%). It is important to
                                recall that the Lombardy Region and the Campania Region have used in October different
                                school policies, the first leaving primary and secondary schools open in attendance and high
                                secondary schools at 50% in attendance [25], while RC intervening instead with targeted
                                closures: schools opened at September 24 (secondary schools at 50% in attendance), and
                                then all levels were closed in advance starting from the October 16 and until November
                                13 [26].
                                      Let us now focus on the data of the Lombardy Region at the provincial level (see
                                Figure 2 for numerical details for all the RL provinces: VA Varese, SO Sondrio, PV Pavia,
                                MN Mantova, MI Milan, MB Monza and Brianza, LO Lodi, LC Lecco, CR Cremona,
                                CO Como, BS Brescia, and BG Bergamo). If we calculate a “school contagion” index and a
                                “global contagion” index (normalized on the ISTAT2020 population [http://demo.istat.it]
                                (accessed on 27 April 2021), for each province as: cases/1000 inhabitants), it is interesting
                                to note that there is a strong correlation between a high rate of contagion in school and high
                                contagion rate then at the provincial level. This correlation is not found instead by looking
                                at, for example, the population density as another variable. As an example, let us take the
                                case of Varese (VA): VA was one of the Lombardy provinces that was mostly impacted by
                                the second COVID-19 wave. VA has the highest school contagion rate (together with MB)
                                and a very high global contagion rate, as depicted in Figure 2.
                                      Let us now consider what happened in the first two weeks after the school reopening
                                (14 September–28 September) where theoretically the effects of the school were just begin-
                                ning to be visible: it is noted how there is no correlation between the school contagion index
                                and the global contagion index at two weeks (CI = −0.10). If, on the other hand, we look
                                at the correlation between school contagion and the index of contagion two weeks after
                                the reopening of schools, we have a clear correlation with CI = 0.69, which rises further
                                considering the effect after four weeks with CI = 0.80. For the entire reference period the CI
                                rises to CI = 0.89) as clearly depicted in the scatter plot of Figure 3 (the linear regression
                                trend line as the R2 coefficient of determination with a very high value R2 = 0.94). The
                                correlation indices are identical if the school contagion data is separated between primary
                                and secondary school. It is interesting to observe the correlation between the contagion
                                index and the population density (CI = 0.60) but not between the school index and the
                                population density (CI = 0.37). If, on the other hand, we observe the correlation between
                                the contagion index and the mobility indexes, we note that the lower mobility registered
                                with government restrictions and DPCM (Decreto del Presidente del consiglio dei ministri)
                                does not have an interdependence relation with the contagion more or less accentuated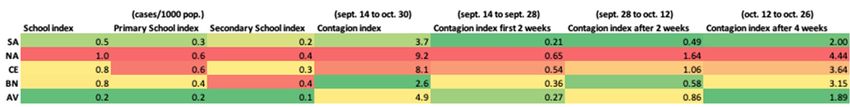
Future Internet 2021, 13, 109                                                                                               6 of 12

                                    in the various provinces of RL, with the exception of transit station mobility that shows a
                                    correlation CI = −0.57.

               Figure
                Figure2.2.Lombardy
                           LombardyRegion
                                    Regiondata
                                           dataset
                                                setfor
                                                    forSchool
                                                        schoolcontagion
                                                               contagionIndex
                                                                         index and
                                                                               and overall
                                                                                   overall contagion.
                                                                                           contagion. Correlation
                                                                                                      Correlation study.
                                                                                                                  study.

                      Figure 3. Lombardy Region scatter plot for school contagion index vs. overall contagion index.

                                         Since the number of datapoints is limited, we tested the statistical significance with
                                    F-Test (α = 0.05) and we obtained the following values: F = 21.20 with a P(F) = 7.94 × 10⁻⁶
                                    and an F critical = 2.82 (gdl = 11), so the null hypothesis is rejected (since F calculated is
                                    greater than the F critical).
                                         As for Campania Region (Figure 4) and its five provinces (SA Salerno, NA Napoli,
                                    CE Caserta, BN Benevento, AV Avellino), schools reopened two weeks later than RL and

               1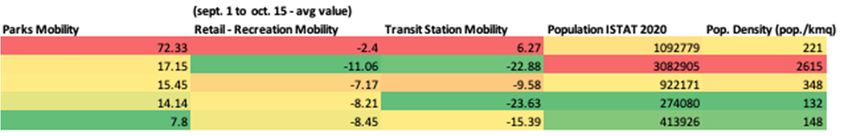
Future Internet 2021, 13, 109 7 of 12
were closed in advance, starting from 16 October and until 13 November. We observed
the following statistical behavior between the contagion variables in the schools and the
subsequent contagion in the regional provinces: in the first few days after the schools
re-opening (28 September to 12 October) the correlation index is equal to CI = 0.51 and
then increased after two more additional weeks to the strong value CI = 0.93 (i.e., showing
the clear impact of schools reopening). The global correlation index is equal to CI = 0.47,
with a behavior that is in line with the one observed for Lombardy Region. There is only a
temporal shift ahead, since RC reopened schools two weeks later than RL. Moreover, also
for RC, a strong correlation exists between the contagion index and the population density
(CI = 0.74). As for mobility data, a strong correlation index is detected only between the
contagion index and the retail and recreation mobility (CI = 0.86), thus suggesting that this
mobility factor may have had an impact to the spread of COVID-19, too.
Figure 4. Campania Region data set for school contagion index and overall contagion. Correlation study.
Figure 4. Campania Region data set for School contagion Index and overall contagion. Correlation study.
Figure 4. Campania Region data set for School contagion Index and overall contagion. Correlation study.
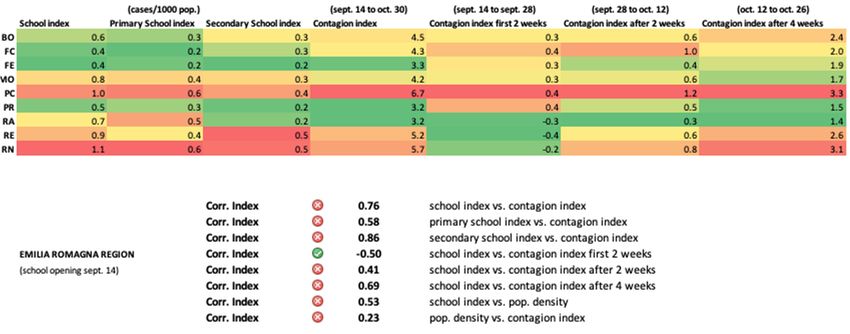
To reinforce our findings, we extended our analysis evaluating also the Emilia Ro-
magna Region and its nine provinces (BO—Bologna, FC—Forlì-Cesena, FE—Ferrara, MO—
Modena, PC—Piacenza, PR—Parma, RA—Ravenna, RE—Reggio Emilia, RN—Rimini). For
this region, the identified cases are 3050 out of 19,670 total cases (15.5%), in the reference
period 14 September–30 October, with a similar % to RL. Moreover, REm followed an
opening/closure strategy such as the one applied to RL. As depicted in Figures 5 and 6,
correlation between the school contagion index and the overall contagion index per each
province increases over time, starting from an inverse correlation at the beginning of school
reopening CI = −0.50 to an index of CI = 0.41 after two weeks, and CI = 0.69 after four
weeks since school reopening. The index for the overall period is CI = 0.76 with the sec-
ondary school impacting more than the primary school (CI = 0.86 vs. CI = 0.58). Hence,
also in this case, the detected behavior is consistent with the one observed in RL and RC.
Since the number of datapoints is limited, we tested the statistical significance with
F-Test (α = 0.05) and we obtained the following values: F = 23.16 with a P(F) = 9.27 × 10⁻⁵
and an F critical = 3.43 (gdl = 8), so the null hypothesis is rejected (since F calculated is
greater than the F critical).
Figure 5. Emilia Romagna Region data set for School contagion Index and overall contagion. CorrelationFuture Internet 2021, 13, 109 8 of 12
Figure 5. Emilia Romagna Region data set for school contagion index and overall contagion. Correlation study.
Figure 5. Emilia Romagna Region data set for School contagion Index and overall contagion. Correlation
study.
2
Figure 6. Emilia Romagna scatter plot for school contagion index vs. overall contagion index.
3.2. Reproduction Number (Rt) and Contagion Curves Evaluation
If we take also a look at the contagion curve (new daily positive cases), see Figure 7,
RC, which was the region that applied the more restrictive policies for schools, was able to
invert the trend of new daily positive cases earlier than the other two regions. Moreover,
it is interesting to observe that also the ascent trend was less steep than for RL and REm,
with the average doubling time (in the number of positive cases) equal to 8 days (3.4 days
for RL and 6 days for REm).
Moreover, we computed the Rt (reproduction number) for all the Italian regions [23].
The Rt estimation was conducted by using the Time-Dependent method by Wallinga and
Teunis [28] with a time aggregation level equal to 10 days, to understand the impact of
schools reopening on the Rt trend. All regional and provincial trends are reported in our
web site: www.covid19-italy.it (accessed on 27 April 2021). The trend is depicted in Figure 8:
it is clear that RC was able to contain the reproduction number to a low peak value Rt = 1.1
while REm and RL have higher peak values of Rt = 1.4 and Rt = 1.5, respectively. Moreover,
RC was the first one to reach the guard value Rt = 1.0 (9 November2020) probably due
to the prompt school closures. In Table 2, we also summarize for all the Italian regions
(categorized by the date of school opening) the dates when the Rt peak is reached and
the associated Rt value. The average Rt value is also reported for the regions that opened
schools at 14 September 2020 and the ones that opened schools later at 24 September
2020. Regions that postponed the schools’ opening had an average Rt lower than the one
registered for regions that opened schools earlier: Rt = 1.27 vs. Rt = 1.46, respectively. The
Campania region that applied the most stringent policies in Italy, by closing all schools
promptly, registered the lowest Rt value among all the Italian regions. Moreover, we can
observe that regions that opened schools earlier had their Rt peaks earlier than regions that
postponed the schools’ reopening: in the first category (14 September), eight regions hadFuture Internet 2021, 13, 109 9 of 12
their Rt peak at 10 October 2020 and five regions at 20 October 2020; in the second category
(24 September), six regions had their Rt peak at 20 October 2020 and only one region at
10 October, thus suggesting that the impact of school reopening is actually detected after
two weeks, as expected.
Figure 7. Daily positive new cases and 7-days avg. trend for the Italian regions: Campania, Emilia and Lombardy in the
time frame 1 September 2020 to 15 November 2020.
Figure 8. Rt trend for the three Italian regions: Campania, Emilia and Lombardy.Future Internet 2021, 13, 109 10 of 12
Table 2. Rt peak values and dates associated to Italian Regions.
14 September 2020 24 September 2020
Rt Peak Date Rt Peak Value Rt Peak Date Rt Peak Value
Emilia 10/10/2020 1.4 Abruzzo 10/10/2020 1.3
Lazio 10/20/2020 1.4 Basilicata 10/20/2020 1.4
Liguria 10/10/2020 1.4 Calabria 10/20/2020 1.4
Lombardia 10/10/2020 1.5 Campania 10/20/2020 1.1
Marche 10/20/2020 1.4 Friuli * 10/20/2020 1.3
Molise 10/10/2020 1.8 Puglia 10/20/2020 1.2
Piemonte 10/20/2020 1.5 Sardegna * 10/20/2020 1.2
Sicilia 10/10/2020 1.3
Toscana 10/10/2020 1.4
Trento 10/20/2020 1.5
Umbria 10/10/2020 1.4
Valle d’Aosta 10/10/2020 1.6
Veneto 10/20/2020 1.4
Avg. 1.46 Avg. 1.27
* Friuli schools opening 16 September 2020. Sardegna schools opening 22 September 2020.
4. Discussion
Our work shows that the schools’ reopening had a clear impact on the overall conta-
gion, since all the three analyzed regions had an increase in the number of cases two weeks
after the schools’ reopening. The time-lag detected for all the analyzed provinces is equal
to 14 days, confirming our hypothesis that two incubation cycles are needed to perceive
the impact of the contagion coming from schools. Moreover, the provinces that have had a
large number of cases in the school environment are the ones that have subsequently had a
higher total number of cases, and as expected, the contagion increased over time. The most
significant example is Varese that with reference to the other provinces of the Lombardy
Region is the one that had the highest incidence in schools’ spreading over time throughout
the entire provincial territory, thus leading to one of the most affected provinces in Italy
during the second COVID-19 wave. Our study also suggests that population density is
another driver of contagion by favoring the virus spread, while the mobility of population
(that was already drastically reduced by the governmental restrictions with respect to the
normal baseline) did not impact the COVID-19 spread.
Promptly acting by closing the schools (as in the case of RC) was able to contain the
COVID-19 spread (i.e., as listed in Table 2, RC was the region with the lowest Rt peak, and
it was able to invert the trend of new daily cases before the other two regions RL and REm,
as depicted in Figure 7).
It is also interesting to observe, as reported in Table 3, that RL had the highest school
contagion index and the highest overall contagion index, while REm had the lowest overall
contagion index despite having the same school index of RC. This can be explained by the
impact the retail and recreation mobility may have had for RC.Future Internet 2021, 13, 109 11 of 12
Table 3. Summary contagion findings.
School Index Contagion Index Rt
(Max-Min-Avg) (Max-Min-Avg) (Peak)
2.7 13.1
Lombardy Region 0.4 2.5 1.5
1.3 7.4
1.0 9.2
Campania Region 0.2 2.6 1.1
0.7 5.9
1.1 6.7
Emilia Region 0.4 3.2 1.4
0.7 4.5
5. Conclusions
There are different elements and different factors that suggest us to conclude that the
school is not a safe environment by definition, but it must be made sure, by taking serious
actions to protect students, teachers, and operators who work and live every day the school
context, such as strict personal hygienic conditions, respect for the rules, serious contact
tracing activities, timely testing and swabs for students, adequate natural and artificial
ventilation of classrooms, etc.
This study may be extended to other Italian regions and to new data, when the MIUR
will officially release new data on the infection detected within the schools.
Author Contributions: Conceptualization, D.T. and A.S.C.; Methodology, D.T. and A.S.C.; Software,
D.T.; Validation, D.T. and A.S.C.; Formal Analysis, D.T.; Investigation, D.T. and A.S.C.; Data Curation,
D.T.; Writing D.T. and A.S.C.; Funding Acquisition, D.T. All authors have read and agreed to the
published version of the manuscript.
Funding: This research is partially funded by the ERC Advanced Grant project 693174 GeCo (Data-
Driven Genomic Computing), 2016–2021.
Institutional Review Board Statement: Not applicable.
Informed Consent Statement: Not applicable.
Data Availability Statement: Contagion Dataset are available in open format at the GitHub of
the Italian Department Civil Protection: https://github.com/pcm-dpc/COVID-19 (accessed on 27
April 2021).
Conflicts of Interest: The authors declare no conflict of interest.
References
1. Tosi, D. Cell Phone Big Data to Compute Mobility Scenarios for Future Smart Cities. Int. J. Data Sci. Anal. 2018, 4, 265–284.
[CrossRef]
2. Tosi, D.; LaRosa, M.; Marzorati, S.; Dondossola, G.; Terruggia, R. Big Data from Cellular Networks: How to Estimate Energy
Demand at real-time. In Proceedings of the IEEE International Conference on Data Science and Advanced Analytics (DSAA
2015), Paris, France, 19–21 October 2015.
3. Lavazza, L.; Morasca, S.; Taibi, D.; Tosi, D. Predicting OSS Trustworthiness on the Basis of Elementary Code Assessment.
In Proceedings of the ACM/IEEE 4th Empirical Software Engineering and Measurement conference (ESEM 2010), Bolzano, Italy,
16–17 September 2010.
4. Tosi, D.; Chiappa, M. Understanding the Geographical Spread of COVID-19 in relation with Goods Regional Routes and
Governmental Decrees: The Lombardy Region Case Study. Int. J. SN Comput. Sci. 2020, 2, 203. [CrossRef] [PubMed]
5. Tosi, D.; Campi, A. How Data Analytics and Big Data can Help Scientists in Managing COVID-19 Diffusion: A Model to Predict
the COVID-19 Diffusion in Italy and Lombardy Region. Int. J. Med. Internet Res. 2020, 22, e21081. [CrossRef] [PubMed]
6. Tosi, D.; Verde, A. Clarification of Misleading Perceptions of COVID-19 Fatality and Testing Rates in Italy: Data Analysis. Int. J.
Med. Internet Res. 2020, 22, e19825. [CrossRef] [PubMed]Future Internet 2021, 13, 109 12 of 12
7. Rennert, L.; McMahan, C.; Kalbaugh, C.A.; Yang, Y.; Lumsden, B.; Dean, D.; Pekarek, L.; Colenda, C.C. Surveillance-based
informative testing for detection and containment of SARS-CoV-2 outbreaks on a public university campus: An observational
and modelling study. Lancet Child Adolesc. Health 2021. [CrossRef]
8. Levinson, M.; Cevik, M.; Lipsitch, M. Reopening Primary Schools during the Pandemic. N. Engl. J. Med. 2020, 383, 981–985.
[CrossRef] [PubMed]
9. Ismail, S.A.; Saliba, V.; Bernal, J.L.; Ramsay, M.E.; Ladhani, S.N. SARS-CoV-2 infection and transmission in educational settings:
A prospective, cross-sectional analysis of infection clusters and outbreaks in England. Lancet Infect. Dis. 2021, 21, 344–353.
[CrossRef]
10. Di Domenico, L.; Pullano, G.; Sabbatini, C.E.; Boëlle, P.; Colizza, V. Modelling safe protocols for reopening schools during the
COVID-19 pandemic in France. Nat. Commun. 2021, 12, 1073. [CrossRef] [PubMed]
11. Panovska-Griffiths, J.; Kerr, C.C.; Stuart, R.M.; di Domenico, L.; Pierre-Yves, B.; Vittoria, C. Determining the optimal strategy for
reopening schools, the impact of test and trace interventions, and the risk of occurrence of a second COVID-19 epidemic wave in
the UK: A modelling study. Lancet Child Adolesc. Health 2020, 4, 817–827. [CrossRef]
12. Bayham, J.; Fenichel, E.P. Impact of school closures for COVID-19 on the US health-care workforce and net mortality: A modelling
study. Lancet Public Health 2020, 5, e271–e278. [CrossRef]
13. Haug, N.; Geyrhofer, L.; Londei, A.; Dervic, E.; Desvars-Larrive, A.; Loreto, V.; Pinior, B.; Thurner, S.; Klimek, P. Ranking the
effectiveness of worldwide COVID-19 government interventions. Nat. Hum. Behav. 2020, 4, 1303–1312. [CrossRef] [PubMed]
14. Brauner, J.M.; Mindermann, S.; Sharma, M.; Johnston, D.; Salvatier, J.; Gavenčiak, T.; Stephenson, A.B.; Leech, G.; Altman, G.;
Mikulik, V.; et al. Inferring the effectiveness of government interventions against COVID-19. Sci. Dic. 2020, 371, eabd9338.
15. Ferretti, A. Schools and COVID19 Cases in Italy. Available online: https://www.ilfattoquotidiano.it/blog/aferretti/ (accessed on
27 April 2021).
16. Schools and Positive Cases in Lazio Region. Available online: https://roma.repubblica.it/cronaca/2021/03/16/news/
scuola_coronavirus_focolai_covid_zona_rossa_roma_lazio-292442424/?ref=fbplrm&fbclid=IwAR1r1yvwvyc57qYug1ZXi5
-ewDCvXpRz7i__tmM9WIP72O3pFDsT9jrog4M (accessed on 27 April 2021).
17. Belgium Prime Minister Press Conference (19/03/2021). Available online: https://www.brusselstimes.com/news/belgium-all-
news/160897/belgium-consultative-committee-alexander-de-croo-frank-vandenbroucke-outdoor-plan-events-amusement-
parks-youth-camps-trains-holiday/ (accessed on 27 April 2021).
18. Press Release COVID19 Cases at Italian Schools. Available online: https://www.facebook.com/prediremegliochecurare (accessed
on 27 April 2021).
19. Kar, S.K.; Yasir Arafat, S.M.; Kabir, R.; Sharma, P.; Saxena, S.K. Coping with Mental Health Challenges During COVID-19. In
Medical Virology: From Pathogenesis to Disease Control; Saxena, S., Ed.; Coronavirus Disease 2019 (COVID-19); Springer: Singapore,
2020. [CrossRef]
20. Pillai, S.; Siddika, N.; Hoque Apu, E.; Kabir, R. COVID-19: Situation of European Countries so Far. Arch. Med. Res. 2020, 51,
723–725. [CrossRef] [PubMed]
21. Vinnakota, D.; Parsa, A.D.; Arafat, S.Y.; Sivasubramanian, M.; Kabir, R. COVID-19 and risk factors of suicidal behaviour in UK:
A content analysis of online newspaper. J. Affect. Disord. Rep. 2021, 4, 100142. [CrossRef]
22. MIUR Dataset of COVID Infection in Italian Schools. Available online: https://drive.google.com/file/d/1bZuV-UmLd40kxBof1
iaPJEJHrlNPUIw3/view (accessed on 27 April 2021).
23. Dashboard National, Regional and Provincial Curves. Available online: www.covid19-italy.it (accessed on 27 April 2021).
24. Official Opendata COVID19 Italy. Department Civil Protection. Available online: https://github.com/pcm-dpc/COVID-19
(accessed on 27 April 2021).
25. Ordinanza Scuole Regione Lombardia. Available online: https://www.regione.lombardia.it/wps/portal/istituzionale/HP/
coronavirus/misure (accessed on 27 April 2021).
26. Ordinanza Scuole Regione Campania. Available online: http://www.regioni.it/newsletter/n-3930/del-16-10-2020
/campaniaordinanza-di-chiusura-scuole-e-universita-fino-al-30-ottobre-21783/ (accessed on 27 April 2021).
27. Covid19 Google Community Mobility Report. Available online: https://www.google.com/covid19/mobility/ (accessed on 27
April 2021).
28. Wallinga, J.; Teunis, P. Different epidemic curves for severe acute respiratory syndrome reveal similar impacts of control measures.
Am. J. Epidemiol. 2004, 160, 509–516. [CrossRef] [PubMed]You can also read