Analysis of comparative filter algorithm effect on an IMU undergoing - vibrations
←
→
Page content transcription
If your browser does not render page correctly, please read the page content below
Analysis of
 comparative filter
 algorithm effect
 on an IMU
 undergoing
 vibrations
Main Subject area: Computer Engineering

Author: Johan Åkerblom Svensson, Joakim Gullberg Carlsson

Supervisor: Andreas Axelsson

JÖNKÖPING 2021 May
This final thesis has been carried out at the School of Engineering at Jönköping University
within Computer Engineering. The authors are responsible for the presented opinions,
conclusions, and results.

Examiner: Rachid Oucheikh

Supervisor: Andreas Axelsson

Scope: 15 hp (first-cycle education)

Date: 2021-07-14

 i
Abstract
An IMU is a sensor with many differing use cases, it makes use of an accelerometer,
gyroscope and sometimes a magnetometer. One of the biggest problems with IMU
sensors is the effect vibrations can have on their data. The reason for this study is to
find a solution to this problem by filtering the data. The tests for this study were
conducted in cooperation with Husqvarna using two of their automowers. The tests
were made by running the automowers across different surfaces and recording the IMU
data. To find filters for the IMU data a comprehensive literature survey was conducted
to find suitable methods to filter out vibrations. The two filters selected for further
testing were the complementary filter and the LMS filter. When the tests had been run
all the data was added to data sheets where it could be analyzed and have the filters
added to the data. From the gathered data the data spikes were clearly visible and were
more than enough to trigger the mower's emergency stop and need to be manually reset.
The vibrations were too irregular to filter using the LMS filter since it requires a known
signal to filter against. Hence only the complementary filter was implemented fully.
With the complementary filter these vibrations can be minimized and brought well
below the level required to trigger an emergency stop. With a high filter weight constant
such as 0.98, the margin of error from vibrations can be brought down to +- 1 degrees
as the lowest and +- 4,6 degrees as highest depending on the surface and automower
under testing. The main advantage with using the complementary filter is that it only
requires one weight constant to adjust the filter intensity making it easy to use. The one
disadvantage is that the higher the weight constant is the more delay there is on the data.

Keywords: IMU, vibration, autonomous driving, complementary filter, accelerometer,
gyroscope

 ii

Table of content
Abstract ..........................................................................................................................ii
Table of content ............................................................................................................iii
1 Introduction ............................................................................................................ 1
 1.1 Problem statement ........................................................................................... 1
 1.2 Purpose and research questions ....................................................................... 3
 1.3 Scope and limitations ...................................................................................... 3
 1.4 Disposition ...................................................................................................... 3
2 Method and implementation .................................................................................. 5
 2.1 Connection between research question and method ....................................... 5
 2.2 Data collection................................................................................................. 5
 2.2.1 Environment ............................................................................................. 6
 2.2.2 Equipment ................................................................................................ 7
 2.2.3 IMU data collected ................................................................................... 8
 2.3 Data analysis ................................................................................................... 9
 2.4 Validity and reliability .................................................................................... 9
 2.5 Considerations ............................................................................................... 10
3 Theoretical framework ......................................................................................... 11
 3.1 IMU ............................................................................................................... 11
 3.1.1 ICM-20689 ............................................................................................. 11
 3.2 Algorithms / Filter ......................................................................................... 11
 3.2.1 Complementary high-pass, low-pass filter ............................................ 12
 3.2.2 Combination of an LMS and a low-pass FIR filter................................ 14
 3.3 Arduino.......................................................................................................... 15
4 Results .................................................................................................................. 16
 4.1 Collected data ................................................................................................ 16
 4.2 Data analysis ................................................................................................. 31
5 Discussion ............................................................................................................ 33
 5.1 Result discussion ........................................................................................... 33

 iii
5.2 Method discussion ......................................................................................... 33
6 Conclusions and further research ......................................................................... 35
 6.1 Conclusions ................................................................................................... 35
 6.1.1 Implications............................................................................................ 36
 6.2 Further research ............................................................................................. 36
7 References ............................................................................................................ 37
8 Appendixes .......................................................................................................... 40

 iv

1 Introduction

With the technological advancement that is made, new sensor components or
alternation of components join the market each year. These components do not always
work flawlessly and will need to be altered for their designated purpose. The main way
to alter components is by calibration and the usage of filters. One of these components
is the Inertial Measurement Unit (IMU). The IMU is a combination of accelerometers,
gyroscopes, and, on some occasions, magnetometers. The accelerometers measure the
accelerations, and the gyroscope measures angular rate. With the help of the
accelerations and angular rate, the IMU can gather the orientation of the IMU. IMUs
are used in several different products, for example, drones, unmanned aerial vehicles,
satellites, and Virtual Reality headsets. A good combination can be made with an IMU
and a GPS, if a GPS signal is unavailable the IMU can take over to keep the current
position. By moving away from the navigational products, some IMU sensors can be
found in several other more common products. The IMU can be found in smartphones
and fitness trackers. In those products the IMU can be used to track body movement.
There are many different versions of IMUs’ and in this paper a IMU called ICM-
20689(TDK Invensense, 2021) will be used for the experiments. The purpose of this
research paper is to locate when and why noises occur and research different kinds of
filters and calibration methods that might reduce the noises and disturbances.

1.1 Problem statement

The company Husqvarna is currently developing a new type of automatic lawnmower
that uses an IMU sensor to keep track of the lawnmower's position, angle, and velocity.
When the IMU collects data, there might be interference in some situations. These
interferences lead to noisy data and possibly larger data spikes. These interferences
need to be located and dealt with for the IMU to be used properly by Husqvarna.
 If the IMU data contains a lot of noise, the IMU could think that it is in a position
which it is not, and this can create errors in products. These problems could for example
be that an automatic lawnmower stops moving and needs to be manually corrected. The
main interference a lawnmower can experience is when it runs across uneven surfaces
and experiences a lot of vibrations. Based on this, the focus of our investigation on the

 1
vibration an IMU experiences while operating.
 When researching how the IMU performs under vibrations, there is a limited
amount of research available and insufficient research about spikes in IMU data. The
vibrations might come from many different sources both internal and external, an
example for internal vibrations might be an engine running and external vibrations
could be the terrain a certain vehicle runs across. Research about the IMU is mostly
about how filters stabilize raw data as done by Capriglione et al. (2021). The
investigation will be on when and where these errors occur and how big the
interferences need to be in order to induce errors in the IMU data. The thesis is built
from the lack of research regarding the vibrations and spikes on IMU.
 One of the most common filters used to reduce noise in all kinds of IMUs is the
Kalman filter (Kalman, 1960). The Kalman filter is very demanding of the processor
and will not always work when using smaller microprocessors. The Kalman filter is
mainly used with larger products. Due to this, this paper will focus on filters that are
less taxing on the hardware and can work on smaller processors. The filters this thesis
will be focusing on is a complementary filter, such as low and high-pass filters (Chen
et al., 2020) and a combination between an adaptive Least Mean Squares (LMS) filter
and a Finite Impulse Response (FIR) filter (Suwandi et al., 2019).
 Another filter often used with IMUs is the particle filter, this filter can be
explained in three steps, A. There is something we want to know, B. We can measure
something related to what we want to know, C we know something about the
relationship between the measurements and what we want to know. In a comparison
between a Kalman filter and a complementary filter, it was shown that both filters
deliver accurate results (Gui et al., 2015). With the Kalman filter being much more
demanding to the processor it led to the decision of excluding the Kalman filter.
 Husqvarna wants a simple but effective filter algorithm that does not take up all
the processing power. This limits the filters available to use and this led to that this
thesis will focus on the complementary low- and high-pass filter and the LMS filter.
 A literature research was conducted on different algorithms that can be
implemented to reduce noise and then test them on an Arduino connected to an IMU
breakout board.

 2
1.2 Purpose and research questions

As mentioned in the problem statements, when an interference occurs within the IMU
it will cause errors in the product using the IMU. The purpose of this research is to
locate and assess the power of these interferences on the IMU, but also to find ways to
minimize the interferences in the IMU during runtime with the help of filters.
 A common issue with the IMU is vibrations. However, it is unknown how strong
these vibrations need to be to cause errors, or which errors the vibrations will cause. An
error is defined as when the mower reaches its angle limit. This leads to the first research
question:

 1. How strong does the vibration need to be to cause errors on the IMU?

Based on the kind of errors found in the first research question, the second question will
aim to find a viable solution. This will be done through investigations of different kinds
of filters and implementing them on the IMU. This leads to the second research
question:

 2. How do filters affect the performance of an IMU during runtime?

To answer the research questions, a study will be conducted in collaboration with
Husqvarna AB.

1.3 Scope and limitations

Since this study is based at Husqvarna AB, one limitation will be that this thesis can
only use the IMU that is in the Husqvarna AB mowers, which is the ICM-20689.
Therefore, this study might not apply to other IMUs’. Experiments will also be
conducted on an ICM-20689 breakout board as well as on an IMU already wired into a
lawnmower. Due to this, the results from this research will hopefully be applicable in
more cases than just lawnmowers. For the first research question, no calibration and no
filters will be used to investigate the raw data and to see if any major spikes take place.
For the second question, one or two filter algorithms will be researched, implemented,
and compared.

1.4 Disposition

Chapter 2 will explain how the collection of data was done and why a specific method
was chosen. In chapter 3, the filters used in this research are explained. The IMU ICM-

 3
20689 is also explained more in detail together with some other relevant information
for the study. Chapter 4 contains the raw data result from the testing, together with the
data acquired from the implementation of the filters. Chapter 5 will analyze the data in-
depth and connect all results. Chapter 6 will draw a conclusion for this study, inform
about implications, and discuss further research.

 4
2 Method and implementation

The main part of this study is the IMU data collected, which is gathered from three
IMU:s. Two IMUs are implemented in two different mowers which experience
vibrations from the mechanical parts of the mower and external vibrations caused by
the environment. The third IMU is a breakout board and can be used more freely for
testing. All of the IMU:s are the ICM-20689 version, meaning they act the same and
there should not be any difference in data collecting. Both the IMU implemented from
Husqvarna and the breakout board are running on factory calibrations.

2.1 Connection between research question and method

To answer the first research question “How strong does the vibration need to be to cause
errors on the IMU?”, the Husqvarna lawnmower was run on different types of terrain.
An error is defined as a signal that gives an angle above the defined max angle of the
specific mowers that are tested, alternatively when the max force goes above 4g in any
direction. The margin of error with differing filter variables was explored as well.
The values recorded were thereafter analyzed to discover how strong vibrations need to
be to cause errors or major data spikes.
 During the tests, the accelerometer’s FSR (Full Scale Range) was set to ±4g.
The second research question “How do filters affect the performance of an IMU during
runtime?”, is answered by analyzing raw data from both the IMU:s in the lawnmowers
and the IMU breakout board. Then the complementary filter was implemented and
tested. The raw data and the filtered will be mapped on a graph to show the performance
difference. Time was also measured to find out the delays the filters cause in the
processor. The IMU data from the lawnmowers were recorded and saved to a file that
could be replayed with our different filter methods added to it.

2.2 Data collection

To analyze the strength of the vibrations, the mower was run across different surfaces.
The raw data readings from the lawnmower testing were recorded and saved into a file.
The mowers ran and collected data over seven different surfaces with a runtime of
around 10 seconds on each surface. A choice was made to test over 10 seconds due to
the fact that an external program that was used could only sample data over 10 seconds
 5
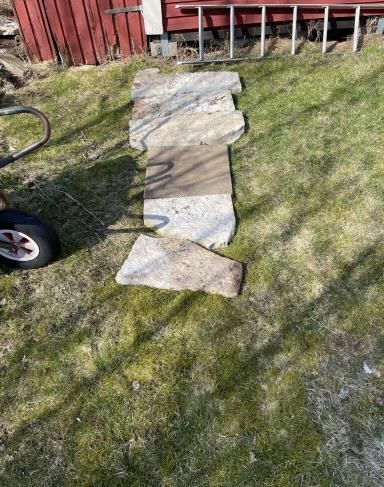
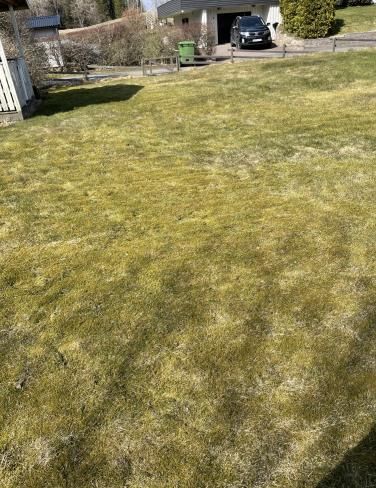
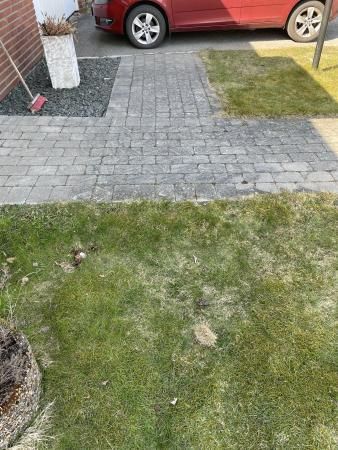
and that some of the testing areas were short. Testing with two different mowers over
several surfaces gives us two results from each surface and a more quantitative testing.
Similar testing was done by Suwandi et al., (2019), where they conducted tests on a
moving vehicle to explore IMU filter method performance. The angle of all the surfaces
tested was also measured along the path the mowers were run with one meter between
the measurements. This was done to have something to compare the IMU data to and
to see how far from the actual angle the filtered data went.
 When testing how the filters affect the performance of the IMU a built-in
microsecond timer was used to check how long it took to read the data from the IMU
and how long it took to run the filters on the collected data. To get an accurate reading
of the time, the average of 10 000 runs was calculated. This was done with and without
filters so that the times could be added to a table and be compared. Another test was
made to see the impact the filter weight constant for the complementary filter had on
the data. This was done by turning the IMU to an angle of 90 degrees and measuring
the time it took the filtered data to catch up.
 To see the amount of drift the IMUs’ gyroscope experienced a test was run with
the IMU completely stationary for 100 seconds during the test the roll, pitch, and yaw
were sampled.

2.2.1 Environment

The surface the mowers ran across were grass, asphalt, sloped asphalt, gravel, stone
brick, and dirt, see figure 1. The testing surfaces that were chosen were limited by the
surfaces an auto mower might come across while operating.

 6
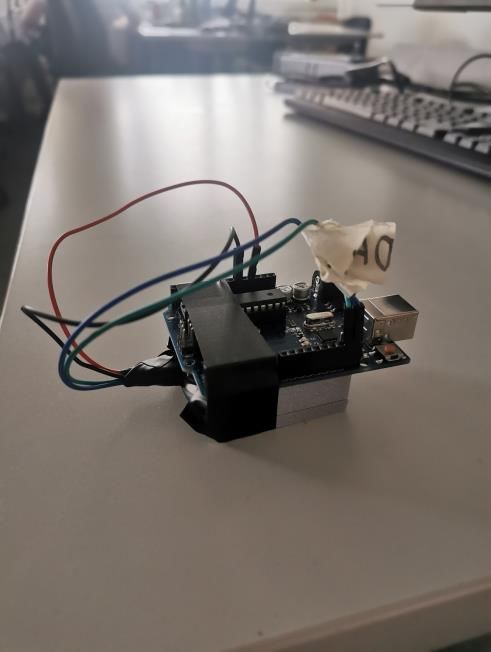
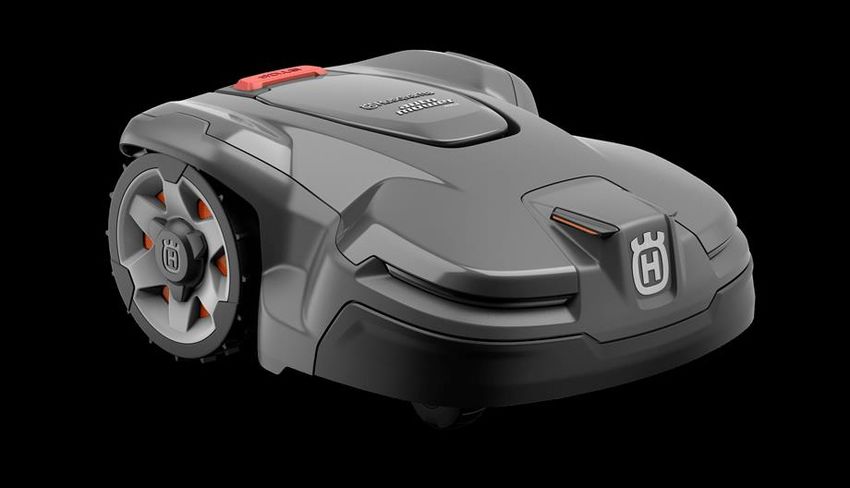
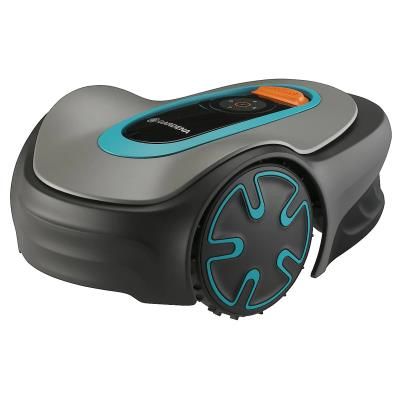
Figure 1: Test surfaces

2.2.2 Equipment

Two different types of automowers were used for the tests, the Husqvarna Automower
x405 (Husqvarna, 2021) (figure 2) and the Gardena Sileno Minimo (Gardena, 2021)
(figure 3). Both mowers are equipped with the ICM-20689 running on an ARM Cortex-
M3 (Arm, 2021) processor but they differ in size. The Husqvarna x405 has an angle
limit of 18 degrees and the Garden Sileno Minimo has an angle limit of 11.25 degrees.

 7
Figure 2: Husqvarna x405 Figure 3: Gardena Sileno Minimo

The reason for running the ICM-20689 from an Arduino UNO instead of a Cortex-M3
based chip like the mowers was to save time since the Arduino UNO is much easier to
program and work with. And the data gathered from the IMU will be the same
regardless of the processor running it.

Figure 4: Arduino UNO with ICM-20689

2.2.3 IMU data collected

The data collected in the performed tests were the following.

From mowers

Acceleration along the x,y, and z-axis in G

Rotation around the x, y, and z-axis in °
 8
Timestamps

From Arduino

Pitch and roll in degrees.

Filtered pitch and roll in ° with the complementary filter.

Timestamps

2.3 Data analysis

The data gathered from the lawnmowers were entered into an excel file along with the
timestamps and made into graphs; in these excel files the complementary filter could
be applied to the data as well. The gathered graphs were used to answer the research
question by examining the timestamps and change in velocity during data spikes.
 In order to get the maximum vibrations that occurred while the mower was
running, the acceleration along all the axes was added together using the formula. =
√ 2 + 2 + 2
There was not an option to test the filter algorithms live on the mower during this thesis,
instead the IMU breakout boards’ data is the only one used to test the filter’s effect on
the CPU performance. This was done by comparing the timestamps and looking for
delays on the data as well as looking at the computing time for the filters.

2.4 Validity and reliability

To improve the reliability of the testing on surfaces, two identical IMU:s were used for
data collection. This will let us see if any IMU delivers data with major differences
from the other IMU:s and consider that when reviewing our result. To research the
filtering algorithms, keywords such as “complementary filter”, “LMS filter”, and “IMU
filter algorithms”, were used to find relative papers. The filtering algorithms which were
used are based on other studies and altered to fit our IMU and research. When recreating
the experiments, it can be difficult to have exactly the same surface to test on, although
tests on the grass, asphalt, and stone bricks surfaces should produce matching results.

 9
2.5 Considerations

One thing that needed to be considered is that the filter algorithms used could not be
too complicated for the processor not to slow down. A too complicated algorithm would
mean that the entire lawnmower would have to wait for the process to be done before
it would be able to continue, due to the Cortex-M3 processor only having a single core.
Another thing that was taken into consideration for the experiments was that mowers
of different sizes might be affected differently by the surfaces they run across. This is
why the tests were performed on two different mowers which differ in size.

 10
3 Theoretical framework

3.1 IMU

The Inertial Measurement Unit (IMU) is an electronic device that measures orientation,
velocity, and gravitational forces with accelerometers and gyroscopes and in some cases
magnetometers.
 It is most common that accelerometers contain capacitive plates, some of these
are fixed and the others are attached to springs that move when accelerating forces
influence the sensor. The results of the movement of the capacitive plates result in a
change of capacitance. This change will be measured and interpreted into an
acceleration. (Sparkfun, 2019)
 The gyroscope contains an H-shaped tuning fork that will vibrate in a certain
direction, the gyro will rotate and the Coriolis force will create a vertical vibration. This
will cause angular velocity that can be converted to an electrical signal (epsondevice,
2021).

3.1.1 ICM-20689

The ICM-20689 is a 6 DOF (Degrees Of Freedom) IMU meaning that it measures
movement along the three different axes as well as rotation around them. It does this
using a 3-axis accelerometer and a 3-axis gyroscope. The accelerometer has a
programmable Full Scale Range of ±2g, ±4g, ±8g, and ±16g. The gyroscope has a
programmable FSR of ±250dps, ±500dps, ±1000dps, and ±2000dps. In both these
cases, the lower range values give a higher sensitivity and more detailed data, and the
higher range values allow for the sensors to measure higher values.

3.2 Algorithms / Filter

The general use of filters is to stabilize data, improve accuracy and remove noise. A
sensor that experiences vibrations or electromagnetic forces can deliver a faulty output
and make the data it collects unusable.
 There are a few different filters that are used to stabilize IMU data, some work
better than others but in turn require more computation. One of these stronger ones is
the Kalman filter, due to its complexity it is difficult to implement and tune. In (Gui et
al., 2015) Kalman was compared with a complementary low-pass and high-pass filter,

 11
and showed that both the complementary and Kalman filter can get accurate results in
static and dynamic testing. The complementary filter was even more stable than the
Kalman filter due to the fact that Kalman has several filter parameters that need to be
tuned, while complimentary only has one filter parameter to tune.

3.2.1 Complementary high-pass, low-pass filter

The way the complementary high-pass low-pass filter works is by implementing a low-
pass filter on the accelerometer reading and a high-pass filter on the gyro and then
combining the filtered data. The low-pass filters’ task is to filter out signals that are too
high and only let frequencies under a selected number pass through, high-pass filters
do the opposite. Meaning that the high-pass filter only lets through frequencies higher
than a selected amount, this makes the low-pass filter a complement to the high pass
(IMU, 2021). Before applying the accelerometer and gyroscope data to the filter its raw
values need to be converted according to the datasheet The accelerometer data
converted according to the datasheet is multiplied with the filter weight constant. the
gyroscope data needs to be converted into a gyro angle, take the sampling frequency
into consideration, and add the previous angle before applying the high pass filter. This
is represented as a numeric integration. See the example of a complementary filter
implementation in figure 5.
 The mathematical model used for the complementary filter in this thesis can be
represented like
Equation 1: θangle = ɑ * (θangle + ωGyro * dt) + (1 - ɑ) * θacc

θangle represents the calculated angle(pitch/roll), ɑ is a filter weight constant, ωGyro is the
angular velocity from the gyroscope, dt is the sampling time, and θacc is the calculated
pitch or roll from the accelerometer data. Alpha is chosen from the formula

 ● ɑ = tau/(tau+dt), where tau is how fast you want the filter to respond.

 ● dt = 1/fs, where fs is our sampling frequency. (100Hz)

 12
Figure 5: complementary block diagram

Depending on a weight constant the filtered data will be affected more or less from the
IMU raw data. This means that depending on the weight constant, the filter can become
too slow and fall behind the unfiltered data or that the filter will not filter out enough
and be close to the raw data.

3.2.1.1 Mathematical formulas

The raw accelerometer and gyroscope data are handled according to the ICM datasheet.
To transform the raw accelerometer data into gravitational values it needs to be divided
by the sensitivity scale factor in the code. Since the accelerometer uses a 16-bit register
that goes from -32768 to 32767 and the FSR is set to +-4g the sensitivity scale factor is
8192, this is done like this for X, Y, and Z.

 ● GAccXYZ = (float) rawAccXYZ / 8192

By using the gravitational accelerometer data, the roll and pitch can be calculated. To
get the pitch and roll these formulas are used,

 ● = ፀ ( )
 √ 2 + 2

 ● ℎ = − ፀ ( )
 √ 2 + 2

 13
The resultant of this is multiplied by (180 / Pi) to get a [90/-90] range.
When it comes to the gyroscope data a numeric integration needs to be done which is
highly dependent on the sampling frequency. To get the angle change per second from
the raw gyroscope data this formula is used,

 ● gyro = rawGyro / (131 * 100)

131 is from using the range +- 250 in the datasheet and our sampling frequency is 100
Hz.

3.2.2 Combination of an LMS and a low-pass FIR filter

The Least Mean Squares (LMS) filter is an adaptive filter, which means that LMS is
continually being updated and is learning as the program runs.
 It is common that the LMS filters’ input vector is used with a desired signal to
define an error vector that controls the parameters of the filter. The LMS filter consists
of two parts, a digital filter, and an algorithm to adjust the coefficients. In this case, the
digital filter is the finite impulse response (FIR) filter. The desired signal should have
a constant frequency and the adaptive algorithm will attempt to make the input signal
resemble the desired signal. See the example of a LMS filter implementation in figure
6. In figure 6 there are two inputs, x(n) which is the input signal from the IMU and d(n)
which is the desired signal (the desired signal is a frequency you want to resemble).
There is also one output e(n) is the error signal (difference between output and desired)
(internal vibrations). Inside the filter there is an adaptive algorithm which is the LMS
filter, this sends an output into the digital filter (FIR). y(n) is the output from the digital
filter y(n) = x(n) * h(n).

 14
Figure 6: LMS block diagram

3.3 Arduino

The implementation of code will be done on an Arduino Uno wired to the ICM-20689.
Since an Arduino is being used to read data from the IMU, the code will be written on
the Arduino IDE and in the language C/C++. Arduino was specifically developed for
beginners but with a growing community, it is currently being used by anyone from
beginners to professionals. With the growth of Arduino, several community and
company-created libraries have surfaced. These libraries make it easy to start up new
components and can be adjusted to fit one's needs.

 15
4 Results

In this chapter, the results are provided in graphical and table form and are briefly
explained. The testing gathered fourteen raw data sheets, seven from each mower. This
chapter will provide the results from asphalt, grass, and asphalt slope recorded with the
internal IMU on both mowers. Results from other relevant tests will also be provided.

4.1 Collected data

Table 1 shows the raw and calculated g values from both mowers and each surface
tested. The data shown is the total calculated G value from the accelerometer x, y, and
z-axis.

Table 1: Maximum acceleration measured during tests.

 Gardena Sileno Husqvarna Gardena Sileno Husqvarna x405
 Minimo (raw) x405 (raw) Minimo (g) (g)

Asphalt 32769,36 16679,89 4,000166016 2,036119385

Asphalt slope 26783,89 15713,18 3,269517822 1,918112793

Grass 14730,99 12750,04 1,798216553 1,556401367

Dirt 19324,48 11583,37 2,358945313 1,413985596

Dirt+gravel 21223,35 16181,93 2,590740967 1,975333252

Stone plates 36053,11 12952,22 4,401014404 1,581081543

Stone path 19945,5 13008,42 2,434753418 1,587941895

Table 2 shows the timing from collecting data with the IMU and the timing from
collecting data and running the complementary filter with the data collection.

Table 2: Execution time of the program.

 Data collection (µs) 1738

 With Filter (µs) 2440

Figure 7-12 shows the unfiltered roll and pitch collected from the Gardena Sileno
Minimo and the Husqvarna x405 mowers together with the highest (0,98) and lowest
(0,88) filter weight constant applied to the complementary filter. The data is from a 10
second interval when the mowers ran across different surfaces.
 16
Figure 7: Gardena sileno minimo asphalt data

 17
Figure 8: Husqvarna x405 asphalt data

 18
Figure 9: Gardena sileno minimo asphalt slope data

 19
Figure 10: Husqvarna x405 asphalt slope data

 20
Figure 11: Gardena sileno minimo grass data

 21
Figure 12: Husqvarna x405 grass data

 22
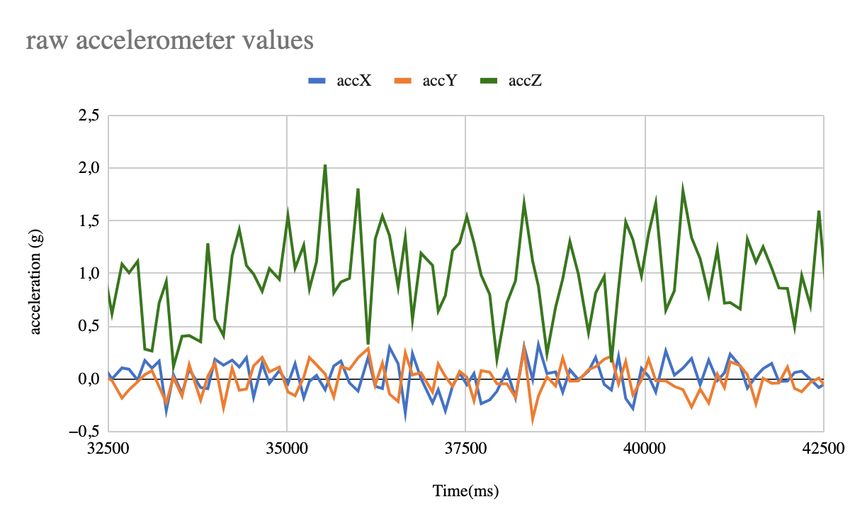
Figure 13 shows the raw gyro data from the Husqvarna x405 from the same test as
figure 8.

Figure 13: Raw gyro data Husqvarna x405 asphalt

Figure 14 shows the accelerometer data from the same test as figure 8.

Figure 14: Accelerometer data Husqvarna x405 asphalt

 23
Figure 15 below shows the amount of drift the IMUs gyroscope experiences over 100
seconds. The IMU breakout board was placed on a flat surface and was left alone for
100 seconds to gather drift data.

Figure 15: Gyroscope drift over time

Table 3 shows the maximum and minimum angles that were measured along the path
that the mowers were run across on the different surfaces.

Table 3: Measured angle of the surfaces the mowers ran across.

 Asphalt Measured Max Measured Min

 Pitch -0,3 -0,6

 Roll -0,5 -1,4

 Grass

 Pitch 0,6 −1,6

 Roll 1,2 −1

 24
Slope

 Pitch −4,7 −6,4

 Roll 0 −1,3

 Bricks

 Pitch 0,3 −0,9

 Roll 1,8 0,2

 Dirt

 Pitch 2,7 −1,6

 Roll 2,5 −1

Table 4-9 shows how far from the actual angle of the surface the filtered IMU data were
using different filter weight constants. Table 4-6 is the data recorded from the
Husqvarna x405 mower, and table 7-9 is from the Gardena Sileno Minimo mower.
Mower Max and Min represent the highest and lowest value recorded using the
complementary filter. Max difference and Min difference is the absolute value
difference between the recorded mower max or Min and the measured surface value
from table 3.
Table 4 shows the difference from the collected asphalt values compared with the
measured angle on the asphalt surface with the larger Husqvarna x405 automower.
From the highest alpha we get a margin of error of 2,367 degrees at most. From there
the margin of error steadily increases with the use of a lowest alpha and ends up at 8,458
degrees as highest.

Table 4: Difference between IMU data and measured angle on asphalt with Husqvarna
x405

 Asphalt Mower Max Max difference Mower Min Min difference
 Alpha 0.98
 Pitch −0,037 0,263 −2,967 2,367
 Roll 1,553 2,053 −0,907 0,493
 Alpha 0.96
 Pitch 1,165 1,465 −4,386 3,786

 25
Roll 2,852 3,352 −1,769 0,369
 Alpha 0.93
 Pitch 3,636 3,936 −6,325 5,725
 Roll 4,709 5,209 −3,011 1,611
 Alpha 0.90
 Pitch 5,845 6,145 −7,881 7,281
 Roll 6,632 7,132 −4,102 2,702
 Alpha 0.88
 Pitch 7,117 7,417 −8,777 8,177
 Roll 7,958 8,458 −4,757 3,357

Table 5 shows the difference between collected IMU data and the actual measured angle
on a grass surface with the Husqvarna x405. Here there is not that much difference
between the angles using different alpha values due to grass being a much softer surface
and therefore the vibrations are smaller. The highest margin of error using the biggest
alpha value was 2.684 degrees and using the lowest alpha it was 3.914 degrees.

Table 5: Difference between IMU data and measured angle on grass with Husqvarna
x405

 Grass Mower Max Max Difference Mower Min Min Difference
 Alpha 0.98
 Pitch −2,084 2,684 −3,783 2,183
 Roll 0,297 0,903 −0,644 0,356
 Alpha 0.96
 Pitch −2,296 2,896 −4,601 3,001
 Roll 0,695 0,505 −1,063 0,063
 Alpha 0.93
 Pitch −1,117 1,717 −5,112 3,512
 Roll 1,28 0,08 −1,688 0,688
 Alpha 0.90
 Pitch 0,058 0,542 −5,389 3,789
 Roll 1,738 0,538 −2,292 1,292

 26
Alpha 0.88
 Pitch 0,775 0,175 −5,514 3,914
 Roll 1,97 0,77 −2,63 1,63

Table 6 shows the data collected from the asphalt slope surface with the larger
Husqvarna x405 automower. From the highest alpha we get a margin of error of 1,768
degrees at most. From there the margin of error steadily increases up towards the alpha
0,93 where the max difference pitch takes a turning point and starts to decrease. With
the use of a lowest alpha, the highest margin of error ends up at 4.902.

Table 6: Difference between IMU data and measured angle on asphalt slope with
Husqvarna x405

 Slope Mower Max Max Difference Mower Min Min Difference
 Alpha 0.98
 Pitch −3,923 0,777 −7,525 1,125
 Roll 1,268 1,768 −1,156 0,144
 Alpha 0.96
 Pitch −5,583 0,883 −8,817 2,417
 Roll 2,085 2,585 −2,333 1,033
 Alpha 0.93
 Pitch −5,988 1,288 −9,559 3,159
 Roll 3,017 3,517 −3,581 2,281
 Alpha 0.90
 Pitch −5,598 0,898 −10,05 3,65
 Roll 3,858 4,358 −4,455 3,155
 Alpha 0.88
 Pitch −5,209 0,509 −10,41 4,01
 Roll 4,402 4,902 −4,892 3,592

Table 7 shows the data collected from the asphalt surface with the smaller Gardena
SIleno Minimo automower. From the highest alpha we get a margin of error of 3,755
degrees at most. From there the margin of error increases with the decrease of the alpha,
with the use of a lowest alpha the highest margin of error ends up at 14,416.

 27
Table 7: Difference between IMU data and measured angle on asphalt with Gardena
Sileno Minimo

 Asphalt Mower Max Max Difference Mower Min Min Difference
 Alpha 0.98
 Pitch −0,362 0,062 −4,355 3,755
 Roll 3,757 4,257 −0,746 0,654
 Alpha 0.96
 Pitch 0,811 1,111 −6,792 6,192
 Roll 6,202 6,702 −3,294 1,894
 Alpha 0.93
 Pitch 3,053 3,353 −9,839 9,239
 Roll 8,677 9,177 −6,895 5,495
 Alpha 0.90
 Pitch 5,286 5,586 −12,935 12,335
 Roll 10,506 11,006 −9,702 8,302
 Alpha 0.88
 Pitch 6,755 7,055 −15,016 14,416
 Roll 11,864 12,364 −11,221 9,821
Table 8 shows the data collected from the grass surface with the smaller Gardena SIleno
Minimo automower. From the highest alpha we get a margin of error of only 1,093
degrees. In this table the roll and min difference pitch decrease with each alpha until
they reach 0 degrees where they start to increase again. This causes the largest margin
of error becoming 1.399 with the lowest alpha 0,88.

Table 8: Difference between IMU data and measured angle on grass with Gardena
Sileno Minimo

 Max Min
 Gras Mower Max Difference Mower Min Difference
 Alpha 0.98
 Pitch 0,778 0,178 −0,616 0,984
 Roll 0,107 1,093 −0,727 0,273
 Alpha 0.96
 Pitch 1,115 0,515 −1,288 0,312
 28
Roll 0,292 0,908 −1,112 0,112
 Alpha 0.93
 Pitch 1,426 0,826 −2,102 0,502
 Roll 0,601 0,599 −1,632 0,632
 Alpha 0.90
 Pitch 1,664 1,064 −2,695 1,095
 Roll 0,88 0,32 −2,083 1,083
 Alpha 0.88
 Pitch 1,792 1,192 −2,999 1,399
 Roll 1,094 0,106 −2,338 1,338
Table 9 shows the data collected from the asphalt slope surface with the smaller
Gardena SIleno Minimo automower. In this table the highest margin of error with the
highest alpha is 3,307 and then the margin of error increases towards 12,098 with the
lowest alpha.

Table 9: Difference between IMU data and measured angle on asphalt slope with
Gardena Sileno Minimo

 Max Min
 Slope Mower Max Difference Mower Min Difference
 Alpha 0.98
 Pitch −2,699 2,001 −6,611 0,211
 Roll 2,807 3,307 −2,525 1,225
 Alpha 0.96
 Pitch −1,61 3,09 −8,045 1,645
 Roll 5,525 6,025 −4,726 3,426
 Alpha 0.93
 Pitch 0,701 5,401 −10,468 4,068
 Roll 8,496 8,996 −7,48 6,18
 Alpha 0.90
 Pitch 2,7088 7,4088 −13,795 7,395
 Roll 10,505 11,005 −9,97 8,67
 Alpha 0.88
 29
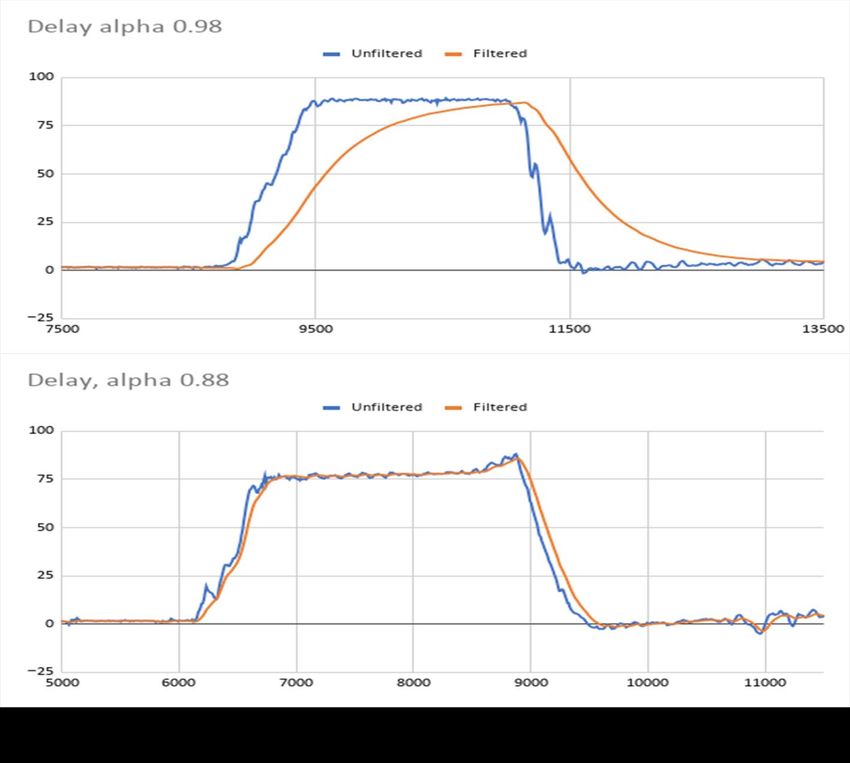
Pitch 3,938 8,638 −16,197 9,797
 Roll 11,598 12,098 −11,86 10,56

Figure 16 shows an example of how a delay may look in an extreme angle change case.
This test was conducted by turning the IMU 90 degrees by hand and back to 0 degrees
after 2-3 seconds. This delay test was done to show how different alpha may cause
delay in filtered data.

Figure 16, IMU delay difference

 30
4.2 Data analysis

Table 1 shows the maximum acceleration the two lawnmowers experienced while
running across the different surfaces. Vibration is measured using m/s2 and therefore
the values in this table also show the maximum strength of the vibrations. One thing
that is visible from these results is that the size of the lawnmower has a big effect on
the vibrations it experiences. This could be from the weight, wheel size, and as
mentioned the dimensions of the mower. During two of the tests with the Gardena
Sileno Minimo, asphalt, and stone plates the accelerometer reached its maximum
possible value of 4g in the z-axis, what this means is that the vibrations might have been
even stronger than what was measured.
 In table 2 “Execution time of program” the mean of the time it took to collect
data and run the filters can be seen. It is seen in the table that it took 1738 microseconds
to read the data from the IMU and 701 (2440-1738) microseconds to run the filter.
 In figure 7-12, is a visual comparison from the difference in results from using
a lower and higher alpha. In the second part of the figures 7-13 the filter weight constant
(alpha) is set to 0,88, the filtered data then follows the raw data closely and creates a
larger error margin. The first graph in each figure from 7-13 with the filter weight
constant(alpha) set to 0,98 stays close to the true angle measured in table 2.
 Figure 8 shows the data from the large mower running across the same asphalt
surface. Here it is visible that the data spikes occur less frequently and are smaller. This
combined with the higher angle limit allows the filter to use a lower alpha value and
still stay within the margins.
 In figures 13 and 14, it is visible that both the gyroscope and accelerometer are
affected by vibrations although the gyroscope is affected much less as it only reaches -
4 degrees while the accelerometer when calculated into angle reaches almost 50 degrees
at one point as seen in figure 8.
 Figure 15 shows how much the gyro drifts over 100 seconds, this drift can be
counteracted by changing the IMUs’ offset registers, but it is nearly impossible to get
it exactly right and there will always be some drift in the gyroscope.
 Tables 4 through 9 shows the maximum and minimum angle the data reached
with the different filter weight constants and compares these values with the actual
measured angle of the surfaces. From this it is visible that the higher filter weight
constant gives values closer to the actual angle of the surface. The only exception to
 31
this is the Gardena Sileno Minimo running across grass where the alpha 0,96 was closer
to the actual value than alpha 0,98. This could depend on the delay from the higher filter
weight constant causing bigger errors than the vibrations on this surface, but further
testing would be needed to prove it.
 In figure 16 IMU delay difference, there is a large difference in the delay
between the raw and filtered data depending on the alpha used. With an alpha of 0.98,
the filtered data takes around 2 seconds to catch up completely when turning the IMU
to a 90-degree angle. When using an alpha of 0.88, the filtered data barely falls behind
at all. This testing is an extreme case and was done to give a visual representation of
how a different alpha creates a delayed data.

 32
5 Discussion

5.1 Result discussion

The base update frequency of the IMU is 250Hz and according to the Nyquist-Shannon
Sampling Theorem (Nyquist, 1928), (Shannon, 1949), that means that it has to be
sampled by the Arduino with 500Hz. According to table 2, the time it took the loop
with the filter was 2440µs which gives a sampling frequency of 410Hz this meant that
the data that was collected from the IMU might not be completely accurate. To counter
this the internal frequency of the IMU was changed to 42Hz and the program was
rewritten to sample with a frequency of 100Hz.
 When calculating what filter weight constant to use, the worst case was selected
for both the mowers in order to find a weight constant that could handle all possible
scenarios the mowers can come across.
 When using the complementary filter and deciding what filter weight constant
to use comes down to how accurate and delayed the filter can be. By lowering the filter
weight constant, the filtered data is closer to the unfiltered data, but this also means that
the data is not as accurate as using a higher filter weight constant. Even when using a
high filter weight constant, a major data spike such as figure 8 with a filter weight
constant of 0.98 can bring the filtered data up. This data will then fall behind and not
be completely correct to the mowers’ orientation.
 From the results of testing the margin of error with the different filter weight
constants, the graphs show a difference in how the filtered data will follow the raw data
and cause errors. While sacrificing a little bit of time to filter better the results get more
promising results with a filter weight constant of 0.98. The assumption can be made
that due to the weight, construction, and stability of the two different mowers the IMU
experienced different strengths of vibrations on the same surfaces, and hence the
smaller Gardena mower would require a higher filter weight constant than the larger
more stable Husqvarna mower.

5.2 Method discussion

The method to test and collect data on different surfaces was chosen to get more data
and to analyze the effect the different surfaces had on the IMU data. It may be hard to
recreate the surfaces used in the testing, however, a normal road and a lawn will deliver

 33
results close to ours. Testing on different surfaces has produced a quantitative result but
using a vibrating test bench could have given this research more credibility and more
qualitative test results.
 When selecting the filters this research would focus on, no tests that had been
run, hence no data could be analyzed before selecting the filters. The LMS filter is a
very useful filter when filtering out known frequencies such as constant vibration or
audio waves. It is not useful when trying to filter unknown signals without a constant
frequency. When running the tests, they showed that the constant vibration from the
mower engine was negligible compared to the vibrations from running the mower
across terrain.

 34
6 Conclusions and further research

6.1 Conclusions

To answer the first research question “How strong does the vibration need to be to cause
errors on the IMU?” Several tests were run with the mowers on different surfaces to
gather data from the IMU, this data was later analyzed to see the effect vibrations had.
The errors can be defined in two ways, the first being if the vibrations are stronger than
what the IMU can handle, in this case any force in one direction totaling more than 4g.
The other way the errors were defined was when the angle went above the limit
Husqvarna had set on their mowers. This meant that the ratio between the axes or r in
atan(r) needed to be between ±0,32492 for the Husqvarna x405 and between ±0,198912
for the Gardena Sileno Minimo. The vibration strength only went above 4g on two
occasions for the Gardena Sileno Minimo, these errors can be solved by increasing the
FSR on the accelerometer in the IMU. However, in most test cases the calculated angle
went above the angle limit set by Husqvarna in these cases a filter of some kind will be
necessary for the IMU to function properly. There were some exceptions to this when
running the Husqvarna x405 across dirt and grass where the angle stayed within the set
limits. From the results in tables 4 through 9, the margin of error can be taken from the
max and min difference. This means that the larger Husqvarna x405 mowers angle can
range anywhere between 1.8 and 2.7 degrees off from the true angle with a high filter
weight constant. The smaller mowers margin of error could range anywhere from 1 –
4,2 degrees. With a lower filter weight constant, the Husqvarna x405 margin of error
went up towards 8 degrees and the Gardena Sileno Minimo went up towards 12 degrees.
However, when testing on the softer surface grass the margin of error barely increased
between the highest and lowest filter weight constant, for the Gardena sileno minimo
the difference was just 0.306 degrees and for the Husqvarna the difference was 1.230
degrees. Using the mathematical formulas to calculate the angle, placing the IMU on a
completely flat surface with the z-axis being 1g and inducing a vibration of only 0.01g
in the y-axis or x-axis the IMU will give an angle of 0.57 degrees from the actual
surface.
 For the second question “How do filters affect the performance of an IMU
during runtime?”, two filters were intended to be used, a complementary filter and an
LMS filter. A conclusion was made that the LMS filter was not well suited for the

 35
purpose of this research because there was no good data that could be used for the
desired signal. However, the complementary filter was successfully implemented and
thoroughly tested. The complementary filter was a good way to filter out vibrations that
affected the IMU performance however it came at the cost of delayed data. This delay
depends on how meticulous you want the filter to be. Another thing that needs to be
taken into consideration when implementing a filter is that the processor can keep up
while running it. This was the case during this research, without the filter, the processor
could keep up with the IMU and sample it at a frequency of 500Hz. Although with the
filter implemented the processor could only sample the IMU at 410Hz which meant the
internal frequency of the IMU had to be lowered for the data to be accurate.

6.1.1 Implications

This study shows the effect vibrations have on an IMU which can be used in many
areas. It also shows how the IMU data can be filtered using a complementary filter with
differing filter weight constant values depending on the amount of filtration needed.

6.2 Further research

During this research, one thing that was not investigated was how a physical vibration
damper on the IMU would affect the output. The physical damper could improve the
unfiltered signal which would imply a lower filter weight constant could be used for
the complementary filter leading to a better response time. One thing not included in
this paper was the impact calibration could have on the IMU, to examine this another
IMU without locked factory calibrations would be required, where more than just
offsets can be changed.

 36
7 References

ARM Developer (2021). Cortex-M3. ARM Developer; Arm Ltd. Retrieved April 20,

 2021, from https://developer.arm.com/ip-products/processors/cortex-m/cortex-

 m3

Capriglione, D., Carratu, M., Catelani, M., Ciani, L., Patrizi, G., Pietrosanto, A., &

 Sommella, P. (2021). Experimental Analysis of Filtering Algorithms for

 IMU-Based Applications Under Vibrations. IEEE Transactions on

 Instrumentation and Measurement, 70, 1–10.

 https://doi.org/10.1109/tim.2020.3044339

Chen, H., Schall, M. C., & Fethke, N. B. (2020). Measuring upper arm elevation

 using an inertial measurement unit: An exploration of sensor fusion

 algorithms and gyroscope models. Applied Ergonomics, 89, 103187.

 https://doi.org/10.1016/j.apergo.2020.103187

epsondevice. (2021). Gyro sensors - How they work and what’s ahead | about Gyro

 sensor | Technical Information | other Information. Www5.Epsondevice.com.

 Retrieved March 15, 2021, from

 https://www5.epsondevice.com/en/information/technical_info/gyro/#:~:text=V

 ibration%20Gyro%20Sensors

Gardena Robotgräsklippare Robotic mower SILENO minimo, 500 m2. (2021). Gardena;

 Husqvarna AB. Retrieved April 20, 2021, from

 https://www.gardena.com/se/produkter/grasmattevard/robotgrasklippare/roboti

 c-mower-sileno-minimo-500-m2/970462905/

 37
Gui, P., Tang, L., & Mukhopadhyay, S. (2015). MEMS based IMU for tilting

 measurement: Comparison of complementary and kalman filter based data

 fusion. 2015 IEEE 10th Conference on Industrial Electronics and Applications

 (ICIEA). https://doi.org/10.1109/iciea.2015.7334442

Husqvarna Robotgräsklippare AUTOMOWER® 405X. (2021). Husqvarna; Husqvarna

 AB. Retrieved April 20, 2021, from

 https://www.husqvarna.com/se/produkter/robotgrasklippare/automower-

 405x/970456221/

Kalman, R. E. (1960). A New Approach to Linear Filtering and Prediction Problems.

 Journal of Basic Engineering, 82(1), 35. https://doi.org/10.1115/1.3662552

Nyquist, H. (1928). Certain Topics in Telegraph Transmission Theory. Transactions

 of the American Institute of Electrical Engineers, 47(2), 617–644.

 https://doi.org/10.1109/t-aiee.1928.5055024

Shannon, C. E. (1949). Communication in the Presence of Noise. Proceedings of the

 IRE, 37(1), 10–21. https://doi.org/10.1109/jrproc.1949.232969

Sparkfun. (n.d.). Accelerometer Basics - learn.sparkfun.com (Toni_K, Ed.).

 Sparkfun.com. Retrieved April 15, 2021, from

 https://learn.sparkfun.com/tutorials/accelerometer-basics

Suwandi, B., Kitasuka, T., & Aritsugi, M. (2019a). Vehicle Vibration Error

 Compensation on IMU-accelerometer Sensor Using Adaptive Filter and Low-

 pass Filter Approaches. Journal of Information Processing, 27(0), 33–40.

 https://doi.org/10.2197/ipsjjip.27.33

TDK InvenSense. (2021, March 16). ICM-20689 Datasheet | TDK.

 Https://Invensense.tdk.com/Download-Pdf/Icm-20689-Datasheet/.

 38
Vathsangam, H. (2010, May 29). Complementary filter - My IMU estimation

 experience. Google.com.

 https://sites.google.com/site/myimuestimationexperience/filters/complementar

 y-

 filter#:~:text=Idea%20behind%20complementary%20filter%20is,of%20tilt%2

 0in%20dynamic%20conditions.

 39
8 Appendixes

void compFilter(){
 //acc data to gravity value
 GAcX = (float) rawACCX / 8192;
 GAcY = (float) rawACCY / 8192;
 GAcZ = (float) rawACCZ / 8192;

 acc_pitch = atan ((GAcX) / sqrt(GAcY * GAcY + GAcZ * GAcZ))
* 57.29577951; // 180 / PI = 57.29577951
 acc_roll = - atan ((GAcY) / sqrt(GAcX * GAcX + GAcZ * GAcZ))
* 57.29577951;

 Cal_GyX += (rawGYROX)/(100*131);
 Cal_GyY += (rawGYROY)/(100*131);
 Cal_GyZ += (rawGYROZ)/(100*131);

 angle_pitch = alpha * (((float)(rawGYROX)/(100*131)) +
angle_pitch) + (1 - alpha) * acc_pitch;
 angle_roll = alpha * (((float)(rawGYROY)/(100*131)) +
angle_roll) + (1 - alpha) * acc_roll;
}

Figure 17: Arduino code for complementary filter

 40
You can also read