2020 Competition Guidebook - Making Data "Sing" Through Creative Expression - Cary Institute of Ecosystem
←
→
Page content transcription
If your browser does not render page correctly, please read the page content below
Making Data “Sing” Through Creative Expression

                 2020 Competition Guidebook

 Support for the Hudson Data Jam Competition has been provided by Cary Institute of Ecosystem Studies,
 M&T Bank, Central Hudson, Adams Fairacre Farms, and Price Chopper Golub Foundation.
Hudson Data Jam Competition 2020 –

Guidebook                                                                                        page 1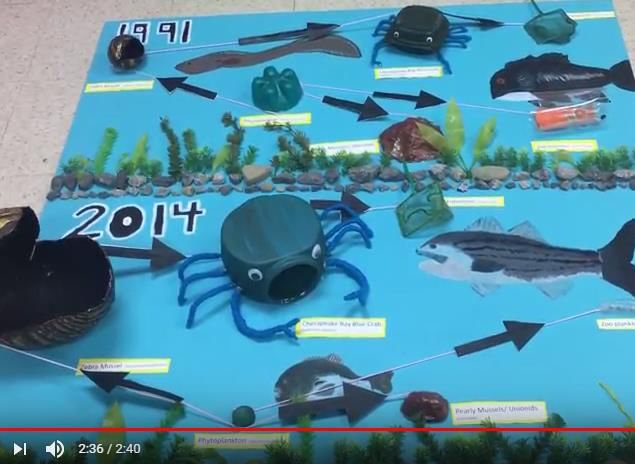
Project Overview
Welcome to the Hudson Data Jam Competition!

The Hudson River Valley has been intensely studied by scientists for decades. Yet despite the
tremendous discoveries made about the Hudson, many of the river's science stories are not well
known by the people who call the Hudson Valley home. We believe that the skills of
understanding, interpreting, and presenting data are essential in a world where our ability to
collect data outpaces our ability to make it understandable for a public audience.

That's why we began the Hudson Data Jam Competition in 2014. We’re looking for new,
creative ways to share the science of the Hudson River and its watershed. This year, Data
Jammers will immerse themselves in authentic, local datasets that have been collected by
professional scientists, including Cary Institute ecologists. Whether teams create a graphic, song,
video, sculpture, computer game, puppet show, or children's book, their imagination is the limit!

Projects will be judged using the criteria detailed on page 5-6. As you will see, the Hudson Data
Jam Competition emphasizes creativity in presenting data. These are the very skills that will
continue to be necessary as we strive to make local science understandable to the general public.

We can’t wait to see what you create!

Sincerely,
The Cary Education Team

                                For more information:
                  CONTACT: caryeducation@caryinstitute.org
DATA JAM on the WEB: http://www.caryinstitute.org/students/hudson-data-jam-competition
                       FACEBOOK: @HudsonDataJam

                                     Important Dates
       Early              Final Registration           Projects due          Expo + Awards
    registration:           + Forms due:                 online:               Ceremony:
     February 1                 May 13                   May 27                 June 19

Hudson Data Jam Competition 2020 –

Guidebook                                                                                    page 2
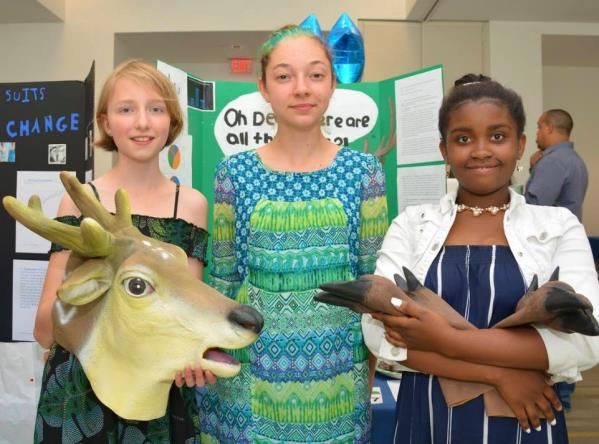
Exploring Data Through Art
   (adapted from Stephanie Bestelmeyer, Asombro Institute for Science Education)

Anyone who follows major league sports, and especially baseball, knows the incredible amount of
data collected during each game. Craig Robinson is a self-proclaimed baseball fanatic who has
turned some of these data into fun graphics in his book Flip Flop Fly Ball: An Infographic Baseball
Adventure and on his website http://www.flipflopflyin.com/flipflopflyball/. The sample
infographic above shows how Mr. Robinson took data available to everyone, but found a way to
present it in an innovative way. "Infographics" like those created by Mr. Robinson are becoming
increasingly popular.

Keep in mind that graphical presentations are not the only option for presenting science to non-
scientists. For example, students attaining a PhD in science can create a dance explaining their
research and enter it in the Dance Your PhD Contest (http://gonzolabs.org/dance/). In last year’s
Hudson Data Jam, students created songs, videos, murals, computer games and more.

Now it’s your turn! How can you present ecological data from the Hudson Valley to nonscientists?
Teams can use any artistic media they like, just as long as their creative product illustrates
interesting trends or comparisons in the data.
Hudson Data Jam Competition 2020 –

Guidebook                                                                                      page 3
Competition Essentials
Prizes
Prizes will be awarded separately for middle and high school students. Each age group will
include:
Best overall project ($500)
Level 1 winner ($200)
Level 2 winner ($200)
Level 3 winner ($200)
People’s Choice Award chosen at the Data Jam Expo ($100)
Honorable Mentions and various other special prizes, such as “Best Use of Visual Art”
and “Best Use of Riverkeeper Sweep Data”. Watch our DJ Facebook page for more
special award announcements throughout the contest period.
Additionally, a special prize will be awarded for our top Family Data Jam (see “Teams”) project
submission.
All Data Jam participants are invited and encouraged to share their project at the Data Jam Expo
& Awards Ceremony. Students do not have to attend the Expo to win the top prizes, but must be
present for the People’s Choice Award. NOTE: We are still unsure at this moment if we will be
able to host our annual Hudson Data Jam Expo and Awards Ceremony on June 19, 2020 at the
Cary Institute due to COVID-19 restrictions. Regardless, all projects will be submitted and judged
virtually, and we will announce the winners online if necessary. We will be sure to notify all
Hudson Data Jam participants about these changes accordingly. Until then, have fun getting to
know your local ecosystem from home through data exploration!
Teams
Students can work on projects on their own or in groups as small as two students or as large as a
whole class. Prizes are awarded for a project, so winnings must be split between team members.
We have a new category for 2020: Family Data Jam! To help accommodate distance-learning
needs during COVID-19-related school closures, we are offering a Hudson Data Jam option
specifically for families. Siblings of different ages can work together with their parents or
guardians on a condensed version of Data Jam, with submissions requiring only a single graph, a
brief interpretation of observed trends, and a creative project with a short explanation. Please refer
to the Family Data Jam Rubric on the “Important Documents” webpage for further details. Project
groups can be as small as one child and one adult (the team advisor).
Registration
Pre-registration for the Hudson Data Jam Competition is required three weeks before project
submissions are due. All registrations are due by May 13, 2020. Registration is non-binding, but is
extremely useful for us so we can estimate the number of judges we will need.
Hudson Data Jam Competition 2020 –
Guidebook page 4
To register:
a. Fill out the registration form on the Hudson Data Jam website:
http://www.caryinstitute.org/students/hudson-data-jam-competition/teachers/data-
jam-project-registration. Only one registration form is necessary. Family Data Jam
teams will register using the same form (simply type “N/A” in any fields that do not
apply to family submissions, such as “school name”).
b. You will receive a confirmation by email. If you have not received a confirmation
within 24 hours of submitting your registration, please call or email us (845-677-
5343; caryeducation@caryinstitute.org).
c. All students participating in the competition must complete the student consent form.
Team projects with missing consent forms cannot be judged.
Which data should we use?
We provide dozens of local datasets collected by Cary Institute and other local organizations like
Scenic Hudson and Riverkeeper. We also highly recommend using the data from the Day in the Life
of the Hudson, especially if you’ve participated in Day in the Life.
Our datasets are available as Google Sheets through the Datasets page. Each dataset includes a short
paragraph called “metadata.” Here, you will find information on the dataset, including who collected
the data, and when and how the data were collected. Most of the datasets also link to a PDF with
additional background information.
If you want a fun, easy way to try graphing, you might want to try out our interactive drag-and-drop
Hudson Data portal hosted on Tuva Labs Inc.: https://hudsonvalleydata.tuvalabs.com/
If there is a local dataset you’d like to use that we don’t have on our page yet please let us know, as
we are always trying to make our collection more engaging and classroom-friendly.
Parts of the Project
Each submission to the Hudson Data Jam Competition will include two parts – a scientific report
and an interpretive creative component.
Report. Each team must submit a report that summarizes their project for judges and
others to review. The report is worth 55% of the total project score. For Family Data Jam,
participants will submit a brief paragraph interpreting observed data trends, plus a short
explanation of their creative component, in lieu of a full report. For Family Data Jam, the
condensed report is worth 40% of the total project score.
Interpretive Creative Component. Communicate your findings! The creative piece
should clearly explain the data to someone without the scientific knowledge to interpret
Hudson Data Jam Competition 2020 –
Guidebook page 5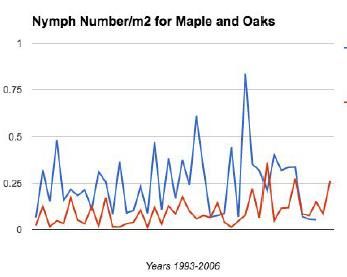
datasets or graphs on their own. Skits, videos, songs, puppet shows, poems, photographs,
   exhibits, sculptures, interactive displays and more are encouraged. The projects will be
   judged online, so live performances must be submitted as electronic audio or a YouTube
   video. Recordings must be 5 minutes or less. The creative project is worth 45% of the
   total project score (60% for Family Data Jam).

Data Jam Report
The Data Jam report should be completed using the document titled: Hudson_DJ_Report_Form
found in the “Important Documents” tab of the website. Students should complete all components
of the document, as outlined in the table below. Students are required to include information and
citations from two sources beyond the Metadata file (not required for Family Data Jam). These
sources could come from scientific publications, newspaper articles or reputable online sources.
Note: Components required for Family Data Jam are designated with an asterisk.

                                     Report Components
              (these are the same as the Rubric, but this chart gives more detail)

    1. Title/Organization*      Include the title, name(s), grade(s), and school name(s) of all
                                students who participated in the project.

                                The report should be typed in a readable font, well organized,
                                and free of spelling and grammatical errors.
    2. Introduction             Start your report by describing your topic to someone
                                unfamiliar with it. Include the scientific question you
                                investigated and a brief claim about what the dataset showed.
        (1 paragraph)           Give an overview of the project but do not go into specific
                                detail in your introduction.

    3. Dataset Description      Introduce the experiment to the reader. Explain what the
                                variables are. Include as much information as you can about
                                who collected the data, how they collected the data, where they
        (1 paragraph)           collected the data, when they collected the data, why they
                                collected the data, and the source of the data (ex: Vassar
                                College, NOAA, Snapshot Day, Cary Institute), and any other
                                relevant information. Explain why a scientist might study these
                                variables.

    4. Data                     Your team will need to create at least one graph or chart of the
       Representations          data. Hand-drawn graphs are acceptable if they are neat and
       (Graphs)*                legible. Remember to label your axes and include a graph title.
                                If you selected a large dataset, your representation only needs
                                to include the variables that are relevant to your investigation.

Hudson Data Jam Competition 2020 –

Guidebook                                                                                   page 6
5. Data Trends or Describe the trend(s) or comparison(s) in the dataset(s) you
Comparisons* used for your project. In other words, What does the graph look
like? Make sure to use basic descriptive statistics (ex: average,
(1-2 paragraphs; 2-3 range, standard deviation). Describe and address variability if
sentences for Family applicable.
Data Jam) Examples:
The average annual blue crab population increased over
time from 158 to 2,703 crabs/m2.
Despite the overall increase in pearly mussels from
1995-2010, the mussel population sharply dropped in
2003.
The precipitation in Poughkeepsie was variable from
1997-2020.
Fish populations were higher in Beacon than at Norrie
Point in 2008.
There appeared to be no clear correlation between
phosphorous and salinity levels from 1990-2000.
If you used two datasets for a comparison, how were the data
similar? How were they different?
6. Data Interpretation Use reasoning and what you know about the topic to explain
(Explanation)* the trend(s) or comparison(s) you discovered. In other words:
Why do you think the graph looks the way it does? Why do you
(1-3 paragraphs, 1-3 think your trend happened? Why is your finding interesting and
sentences for Family important? Are your results expected or surprising? What
Data Jam) environmental processes might be causing what you
discovered?
Make sure to support your explanation with evidence and be
consistent with current scientific ideas.
7. New Questions and Remember -- for your creative piece, your job is just to
Hypotheses describe the data. However, when you look at data closely, you
will inevitably start asking more questions that you can’t
(1 paragraph) answer without more research, such as 'Why did the numbers
go down in 2003?' Or, 'What's happening in Beacon to make
the site so different from others?' The report is your place to ask
'Why?' and 'What's up with that?' Then brainstorm some
hypotheses. Hypotheses are the explanations your brain comes
up with when you ask that 'Why?' question. You start thinking
'Maybe...' That 'maybe' is your hypothesis. Be sure to give at
least two new ideas (hypotheses and/or questions) about future
scientific research that could be done on this topic.
8. Written Explain why you chose your creative method and what message
Hudson Data Jam Competition 2020 –
Guidebook page 7Explanation of you hope audience members will take away from your project.
Creative Project* For example, "We believe the best way to help a general
audience relate to and understand our findings is to create a fun,
(2-5 sentences) engaging, educational video. We hope that people who watch
our video will realize that salt levels in the Hudson River
strongly affect where different fish species can live.” If you
create an abstract visual art piece like a sculpture you may need
a longer description here.
9. Brief Reflection on Let us know what you thought about your Data Jam experience.
Data Jam You might consider the following questions: Was Data Jam
challenging or easy? What was the hardest part? What was the
(2-5 sentences) most fun part? What did you learn from Data Jam? How would
you change Data Jam if you had the chance? Do you think there
is a way to share your project with an audience outside of Data
Jam?
10. Reference List* Include at least two references from outside of the Metadata
document (e.g., data source, graph or table source, and anything
used to explain the data interpretation). You can use any
standard citation form (APA, MLA, etc.) For Family Data Jam,
participants only need to cite the source of their chosen data set
(i.e., HRECOS).
11. Link to Creative If you upload your creative project to YouTube, make sure you
Project include a link for judges!
(if applicable)*
Submitting Your Project
All projects will be submitted on Google Drive. Teams will submit their information via a
Google Form and then upload projects to the Drive folder. Each school will have their own folder, and a
designated folder will be established for Family Data Jam submissions. All project materials must be
submitted electronically by May 27. Visual and written files must be uploaded as PDFs and videos
must be uploaded onto YouTube. All video links must be included in the report.
How Projects will be Judged
Judging will take place online between May 27 and June 12.
A panel of judges, including scientists, artists, and teachers will evaluate each project based on
the following criteria:
Scientific Merit (Report) – 40 points (23 points for Family Data Jam)
Creativity in Communicating Data – 32 points
Hudson Data Jam Competition 2020 –
Guidebook page 8Please refer to the judging rubrics (available in the Important Documents page) for details on how
projects will be scored.
Announcing Winners
We will announce the winning teams at the Hudson Data Jam Expo at Cary Institute on Friday, June 19 from
5:00-7:00. Students do not need to be present at the Expo to win. We will also post the winners on the
Hudson Data Jam Facebook page shortly after the competition. NOTE: Expo may be cancelled due to
COVID-19 restrictions. We will update participants accordingly.
If students choose to present their project at the Data Jam event, we ask that they prepare a tri-
fold poster board (no larger than 36" tall by 48" wide) neatly displaying the components from
their report. Students should bring this poster and any physical materials, electronic media
(videos, songs, etc.), and other necessary equipment to display their project (laptops, power
cords, etc.). Table space and a limited number of extension cords will be provided.
Helpful Resources:
Data Jam Facebook page frequently gives competition updates and posts exemplary
creative data analysis projects: https://www.facebook.com/HudsonDataJam/ We have
also created a Data Jam Network Facebook group for educators and students to connect
and share strategies for Data Jamming. We will also be posting opportunities for student
and teacher webinars on this group page.
Cary Institute Teaching website has data-rich ecology lessons that can help develop
your students’ content knowledge while they work on their projects:
http://www.caryinstitute.org/educators
Hudson Data Jam YouTube channel includes the 2014-2018 winners and a selection of
other strong projects: http://bit.ly/2gI3hUy.
Rules & Regulations
Eligibility
The Hudson Data Jam Competition is open to all current middle and high school students (grades
4-12). Family Data Jam is open to students of all ages and their parents/guardians.
Previous Entrants
Previous entrants are encouraged to compete again in the Hudson Data Jam Competition, as long
as they meet the above student eligibility requirements. Students are welcome to use the same
dataset(s) they used in previous years, however, they must create a new project for the
competition. Previously entered projects are ineligible.
Team Advisors
Hudson Data Jam Competition 2020 –
Guidebook page 9Participation in the Hudson Data Jam Competition and Family Data Jam requires coordination
by a responsible adult who agrees to facilitate and validate student participation. Middle and high
school (grades 4-12) teachers of all subject areas are encouraged to get their students involved.
Adult advisors can be teachers, parents, guardians, or other mentors.
Registration Period
Registration for the Hudson Data Jam Competition is required, and due no later than May 13,
2020.
Project Entry Period
Project entries for the Hudson Data Jam Competition are due online by 11:59 PM EST on May
27, 2020.
Student Privacy
Student privacy is important to us. All adult team advisors will receive parental/guardian consent
forms for permission of student participation and the release of limited personally identifiable
student information (i.e., student name, grade level and gender, school name, hometown,
photographs, video or audio files of the student, and project entry). These consent forms should
be completed and signed for each participating student and returned to the student's team
advisor.
Team advisors are asked to handle the distribution and collection of parental/guardian consent
forms for their student participants. To ensure receipt of materials, please submit all team
members’ parental/guardian consent forms together. Completed forms must be received by Cary
Institute no later than May 13, 2020. These forms may be scanned or photographed and e-mailed
to caryeducation@caryinstitute.org or mailed to the following address:
Data Jam Program
c/o Cary Institute
2801 Sharon Turnpike
Millbrook, NY 12545
Publicity & Rights
By entering a project into the Hudson Data Jam Competition, the project creator(s),
parent(s)/guardian(s), and the team advisor grant to the Cary Institute of Ecosystem Studies
world-wide, royalty-free, non-exclusive license to use all materials submitted by the student
teams into the Hudson Data Jam Competition for publicity purposes.
The Cary Institute of Ecosystem Studies may post information about the Hudson Data Jam
Competition in the Cary newsletter, on the Cary website, in the Cary annual report, in the local
newspapers, and on the Cary and Hudson Data Jam Competition Facebook pages. Project entries
may be published without compensation through any or all of the above sources in whole or in
part. Submitting a project entry does not guarantee it will be publicized. We will not publicize
any student information without prior parental/guardian consent.
Hudson Data Jam Competition 2020 –
Guidebook page 10Plagiarism
Project entries cannot include plagiarized work. Plagiarism is considered the deliberate copying
of someone else’s thoughts, ideas, expressions, words, artistic expressions, or scientific work
without formally acknowledging its source. Plagiarism includes project entries that are
comprised substantially of someone else’s work, copying words or ideas from someone else
without giving credit, the failure to put quotation marks around unmodified content that was
copied from an outside source, and the use of photos, graphs, charts, or other images without
acknowledging their source. Project entries that include plagiarized content will be eliminated
from the competition. We recommend teams working together to help each other avoid
plagiarism. The best way to ensure your work is original is to be creative!
This competition requires students to use information that is not their own, and thus merits
increased diligence to proper source acknowledgement. Students will use data (scientific
work) collected by a group of researchers. Students are also welcome to use any of the images
provided on the “Datasets” page in their project entries. In order to avoid plagiarism, students
should be sure to properly cite all sources of information for content that isn’t their own original
work. This includes noting the data source and the sources of any images copied or modified.
Citations
All project entries must have a complete reference list of all resources used. Any standard
citation form is permissible (APA, MLA, etc.), but the same form should be used for all citations
for a given project entry.
Additional Disclaimers
1. It is the responsibility of each participant and team advisor to obtain and read these rules and
regulations for the Hudson Data Jam Competition.
2. The Cary Institute of Ecosystem Studies will not be responsible for any claims, costs, liabilities,
damages, expenses, or losses arising from 1) The Cary Institute of Ecosystem Studies’ use of
project entries, 2) the participants’ involvement in the competition, 3) technical failures of any
kind, including, but not limited to, computer viruses or equipment malfunctions, 4) travel to and
from the teacher workshops, Data Jam Expo, and other related activities, 5) the use of prizes, and
6) any events outside the Cary Institute of Ecosystems Studies’ reasonable control.
3. The Cary Institute of Ecosystem Studies reserves the right to reject any project entry for any
reason and at any time, at its own discretion.
4. The Cary Institute of Ecosystem Studies may refuse to award a prize if a winning participant
does not follow proper registration and project entry procedures, or these rules and regulations.
5. The Cary Institute of Ecosystem Studies is not responsible for any technical failures that may
affect participation in the Hudson Data Jam Competition.
Hudson Data Jam Competition 2020 –
Guidebook page 11Frequently Asked Questions General Are Cary Institute educators available to help? Yes. Cary Institute educators are delighted to answer any questions you have via e-mail or phone, including questions about the data. In many cases we are able to send specific questions about the data directly to the researchers who collected the data. Depending on our availability, we may also be able to visit your classroom to help with projects. Can I register and participate independently of my teacher or class? Yes. Any middle or high school student or student team is eligible to participate in the Hudson Data Jam Competition, and any family team is eligible to participate in Family Data Jam. You do not have to register through your teacher, but do need to have an adult represent your team as an advisor. This can be a parent or another trusted adult. What do the different dataset levels mean? The simple answer is this: Level 1= Easy, Level 2= Moderate Level 3=Challenging Dataset levels are derived by looking at the number of variables in the dataset and by the sheer amount of data collected. Most middle schoolers will be successful with a Level 1 or 2 dataset, and the appropriate level for your high schoolers depends on their data experience and determination. Drop us a line if you need help selecting an appropriate dataset for your students. Registration/Forms I need to submit my parental consent forms. How can I send it in? You can send us your parental consent forms by e-mail (caryeducation@caryinstitute.org) or snail mail (Data Jam Program, Cary Institute, P.O. Box AB, Millbrook, NY, 12545). Submission How do I submit projects? Projects are submitted to the “Hudson Data Jam 2020 Submissions” Google Drive folder. You will directly upload projects to your school’s folder. Hudson Data Jam Competition 2020 – Guidebook page 12
A separate folder will be designated for Family Data Jam submissions. All written or visual files
must be submitted as a PDF, and all videos must be submitted as a YouTube link. See the Project
Submissions page for specific instructions.

Why do projects need to be submitted online?
All projects must be submitted online because judging for merit prizes takes place online. This
means that all of the files you submit online must clearly show your project in its entirety
because that is how the judges will see it. If you create a 3-D object, send us lots of photos so we
can see it from all angles. You will have the chance to share your projects in person at the Expo
& Awards Ceremony on June 19 at Cary Institute. We hope to see you there!

How should participants present their creative data display digitally for online submission?
It's up to them to determine the best way to view their project online. Most participants choose to
either photograph or video record their work. Participants usually take photographs of their
comic strips, dioramas, sculptures, and paintings, or record a YouTube video with a quick
narration describing their project. Participants also record YouTube videos of their
choreographed dances, puppet shows, movies, original songs, and stop-motion videos.

Remember, the judges will be determining prize winners based on what you upload online, so be
sure that they include a narrative description of pieces as needed. Take a look at our 2014-2019
Winning Projects Gallery for ideas about how to display projects digitally.

Expo – TBD (May require cancellation due to COVID-19 restrictions)

Are students required to attend the Data Jam Expo?
No. Students are still eligible to receive merit prizes regardless of their attendance at the Data
Jam Expo. However, the door prizes and the People's Choice Awards will only be given to
students present at the Data Jam Expo. We will announce all prizewinners at the Expo and on the
Data Jam Facebook page shortly after the event.

I live far away from the Expo. Are there any scholarships available to help fund my travel to the
Data Jam Expo?
Travel scholarships will be available for students who live over 40 miles away and demonstrate
financial need. Send us an e-mail at caryeducation@caryinstitute.org for more information about
travel scholarships.

What should students bring to the Data Jam Expo?
We ask that they create a tri-fold poster board display (no larger than 36" tall by 48" wide) that
contains all of the components of the report. This should look very similar to a science fair poster

Hudson Data Jam Competition 2020 –

Guidebook                                                                                   page 13
display and make it easy for visitors to see the information in the report. In addition, students
should bring all of the materials they need to present their creative data display. If they submitted
a YouTube video, they might want to bring a laptop computer and a pair of headphones for
visitors to watch and listen to the video. Be sure to bring any computer chargers or electrical
equipment needed. We will have tables and electric outlets available.

Students are also encouraged to bring their family and friends to the event. This is their chance to
show off their work and see the work of other students in the competition…and there will be
snacks!

Workshops

When is the next Data Jam workshop for teachers?
Visit our “Professional Development” page to check our workshop schedule or sign up to receive
email updates through our Ecosystem Teaching Newsletter. These workshops are optional, but
highly recommended for new Data Jam teachers. Additionally, we encourage you to join the
Data Jam Network Facebook group, where announcements for webinar opportunities will be
posted.

Contact
Please contact the Cary Institute Education Office if you have any questions about the project or
competition. caryeducation@caryinstitute.org – www.caryinstitute.org

                   BEST OF LUCK AND HAVE FUN!!!

Hudson Data Jam Competition 2020 –

Guidebook                                                                                           page 14
Hudson Data Jam Competition 2020 – Guidebook page 15
You can also read