NEON USER GUIDE TO HERBACEOUS CLIP HARVEST (DP1.10023.001) - PREPARED BY Katherine Jones Courtney Meier Dave Barnett
←
→
Page content transcription
If your browser does not render page correctly, please read the page content below

Title: NEON User Guide to Herbaceous clip harvest (DP1.10023.001)   Date: 02/01/2021
                  Author: Katherine Jones                                             Revision: E

  NEON USER GUIDE TO HERBACEOUS CLIP HARVEST
                (DP1.10023.001)

PREPARED BY                                             ORGANIZATION
Katherine Jones                                         SCI
Courtney Meier                                          SCI
Dave Barnett                                            SCI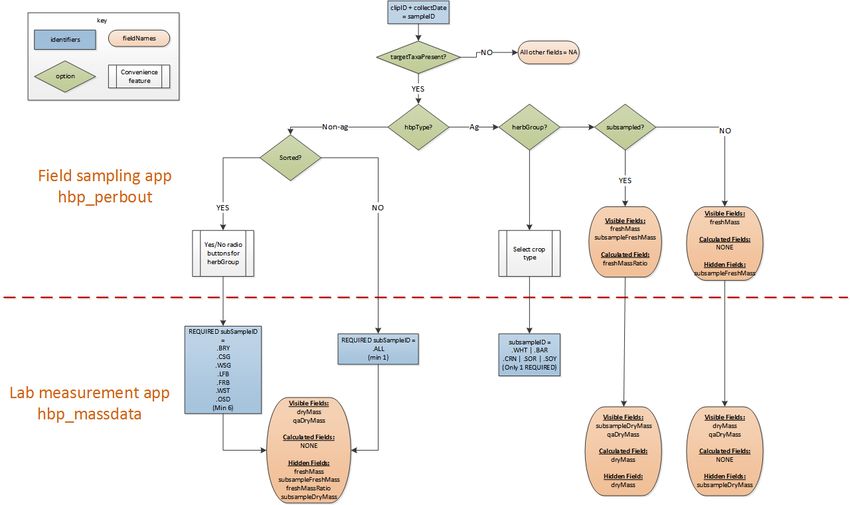
Title: NEON User Guide to Herbaceous clip harvest (DP1.10023.001)         Date: 02/01/2021
           Author: Katherine Jones                                                   Revision: E

                                     CHANGE RECORD

REVISION   DATE                  DESCRIPTION OF CHANGE
A          06/16/2017            Initial Release
B          11/15/2018            2018 sampling modifications described
                                 Additional known data quality issue described, BoutNumber described
C          10/14/2019
                                 for Distributed plots
                                 Included general statement about usage of neonUtilities R package and
D          06/22/2020
                                 statement about possible location changes
E          10/19/2020            Added Sampling Design Changes secion and content
Title: NEON User Guide to Herbaceous clip harvest (DP1.10023.001) Date: 02/01/2021
Author: Katherine Jones Revision: E
TABLE OF CONTENTS
1 DESCRIPTION 1
1.1 Purpose . . . . . . . . . . . . . . . . . . . . . . . . . . . . . . . . . . . . . . . . . . 1
1.2 Scope . . . . . . . . . . . . . . . . . . . . . . . . . . . . . . . . . . . . . . . . . . . . 1
2 RELATED DOCUMENTS AND ACRONYMS 2
2.1 Associated Documents . . . . . . . . . . . . . . . . . . . . . . . . . . . . . . . . . . . 2
2.2 Acronyms . . . . . . . . . . . . . . . . . . . . . . . . . . . . . . . . . . . . . . . . . . 2
3 DATA PRODUCT DESCRIPTION 3
3.1 Spatial Sampling Design . . . . . . . . . . . . . . . . . . . . . . . . . . . . . . . . . . . 3
3.2 Temporal Sampling Design . . . . . . . . . . . . . . . . . . . . . . . . . . . . . . . . . 6
3.3 Sampling Design Changes . . . . . . . . . . . . . . . . . . . . . . . . . . . . . . . . . . 7
3.4 Variables Reported . . . . . . . . . . . . . . . . . . . . . . . . . . . . . . . . . . . . . 8
3.5 Spatial Resolution and Extent . . . . . . . . . . . . . . . . . . . . . . . . . . . . . . . . 8
3.6 Temporal Resolution and Extent . . . . . . . . . . . . . . . . . . . . . . . . . . . . . . 9
3.7 Associated Data Streams . . . . . . . . . . . . . . . . . . . . . . . . . . . . . . . . . . 9
3.8 Product Instances . . . . . . . . . . . . . . . . . . . . . . . . . . . . . . . . . . . . . . 10
3.9 Data Relationships . . . . . . . . . . . . . . . . . . . . . . . . . . . . . . . . . . . . . 10
4 DATA QUALITY 11
4.1 Data Entry Constraint and Validation . . . . . . . . . . . . . . . . . . . . . . . . . . . . 11
4.2 Automated Data Processing Steps . . . . . . . . . . . . . . . . . . . . . . . . . . . . . 12
4.3 Data Revision . . . . . . . . . . . . . . . . . . . . . . . . . . . . . . . . . . . . . . . . 12
4.4 Quality Flagging . . . . . . . . . . . . . . . . . . . . . . . . . . . . . . . . . . . . . . 12
LIST OF TABLES AND FIGURES
Table 1 Descriptions of the dataQF codes for quality flagging . . . . . . . . . . . . . . . . . 12
2
Figure 1 A 20m x 20m (400m ) NEON plot showing potential clip harvest ”cells” (dashed
blue lines). Cells overlapping 10m2 nested subplots are not sampled for herbaceous
biomass. When grazing management is absent, one randomly selected grid cell is chosen
for harvest per sampling bout. At sites managed for grazing, two grid cells are sampled
per bout. The pointID (red star) is used to calculate the location in UTM of a given Clip List
coordinate (red ‘x’). . . . . . . . . . . . . . . . . . . . . . . . . . . . . . . . . . . . . . 5
Figure 2 A 40m x 40m (1600 m2 ) NEON Tower plot showing clip‐harvest cells within a 400
m subplot. Cells overlapping 10m2 nested subplots are not sampled for herbaceous
2
biomass. Clip harvest samples are generated from two randomly selected subplots per
sampling bout, but for clarity, cells are not shown in 3 of 4 subplots. At sites managed
for grazing, two grid cells per selected subplot are sampled per bout. For each subplotID
(grey numbers), the pointID at the SW corner (red stars) is used to calculate the location
in UTM of a given Clip List coordinate (red ‘x’). . . . . . . . . . . . . . . . . . . . . . . . 6
iTitle: NEON User Guide to Herbaceous clip harvest (DP1.10023.001) Date: 02/01/2021
Author: Katherine Jones Revision: E
Figure 3 Schematic of the applications used by field technicians to enter herbaceous
biomass data . . . . . . . . . . . . . . . . . . . . . . . . . . . . . . . . . . . . . . . . 11
iiTitle: NEON User Guide to Herbaceous clip harvest (DP1.10023.001) Date: 02/01/2021
Author: Katherine Jones Revision: E
1 DESCRIPTION
1.1 Purpose
This document provides an overview of the data included in this NEON Level 1 data product, the qual‐
ity controlled product generated from raw Level 0 data, and associated metadata. In the NEON data
products framework, the raw data collected in the field, for example, the dry weights of litter functional
groups from a single collection event are considered the lowest level (Level 0). Raw data that have been
quality checked via the steps detailed herein, as well as simple metrics that emerge from the raw data are
considered Level 1 data products.
The text herein provides a discussion of measurement theory and implementation, data product prove‐
nance, quality assurance and control methods used, and approximations and/or assumptions made dur‐
ing L1 data creation.
1.2 Scope
This document describes the steps needed to generate the L1 data product ‘Herbaceous clip harvest’ ‐
the dry weight of annual production of herbaceous plants clipped from randomly placed clip cells in ter‐
restrial plots ‐ and associated metadata from input data. This document also provides details relevant
to the publication of the data products via the NEON data portal, with additional detail available in the
file, NEON Data Publication Workbook for TOS Herbaceous Biomass: QA/QC of Raw Field and Lab Data
(DP1.10023.001) (AD[05]), provided in the download package for this data product.
This document describes the process for ingesting and performing automated quality assurance and con‐
trol procedures on the data collected in the field pertaining to TOS Protocol and Procedure: Measure‐
ment of Herbaceous Biomass (AD[07]). The raw data that are processed in this document are detailed in
the file, NEON Raw Data Ingest Workbook for TOS Herbaceous Biomass (DP0.10023.001) (AD[04]), pro‐
vided in the download package for this data product. Please note that raw data products (denoted by
‘DP0’) may not always have the same numbers (e.g., ‘10033’) as the corresponding L1 data product.
Page 1 of 12Title: NEON User Guide to Herbaceous clip harvest (DP1.10023.001) Date: 02/01/2021
Author: Katherine Jones Revision: E
2 RELATED DOCUMENTS AND ACRONYMS
2.1 Associated Documents
AD[01] NEON.DOC.000001 NEON Observatory Design (NOD) Requirements
AD[02] NEON.DOC.000913 TOS Science Design for Spatial Sampling
AD[03] NEON.DOC.002652 NEON Data Products Catalog
Available with data
AD[04] Validation csv
download
Available with data
AD[05] Variables csv
download
AD[06] NEON.DOC.000914 TOS Science Design for Plant Biomass and Productivity
TOS Protocol and Procedure: Measurement of Herbaceous
AD[07] NEON.DOC.014037
Biomass
AD[08] NEON.DOC.000913 TOS Science Design for Spatial Sampling
AD[09] NEON.DOC.000913 TOS Science Design for Plant Diversity
AD[10] NEON.DOC.000008 NEON Acronym List
AD[11] NEON.DOC.000243 NEON Glossary of Terms
TOS Protocol and Procedure: Measurement of Herbaceous
AD[12] NEON.DOC.014037
Biomass
NEON Algorithm Theoretical Basis Document: OS Generic Transi‐
AD[13] NEON.DOC.004825
tions
Available on NEON
AD[14] NEON Ingest Conversion Language Function Library
data portal
Available on NEON
AD[15] NEON Ingest Conversion Language
data portal
Available with data
AD[16] Categorical Codes csv
download
2.2 Acronyms
Acronym Definition
ANPP Aboveground Net Primary Productivity
TOS Terrestrial Observation System
Page 2 of 12Title: NEON User Guide to Herbaceous clip harvest (DP1.10023.001) Date: 02/01/2021
Author: Katherine Jones Revision: E
3 DATA PRODUCT DESCRIPTION
The herbaceous clip harvest data products provide mass data for herbaceous plant functional groups
from individual sampling bouts. All masses reported following processing are reported at the spatial reso‐
lution of one clip strip and the temporal resolution of a single collection event (Figure 1).
Mass data for each collection event are reported to an accuracy of 0.01 grams. Masses < 0.01g are also
reported and indicate presence of an identifiable sample present at masses below accuracy of the scales
used to weigh samples.
For a minimum of one bout per growing season, the aboveground dry mass production associated with
key herbaceous functional groups will be provided. These functional groups are defined as:
• Bryophytes for which annual production is discernable
• C3 cool‐season graminoids
• C4 warm‐season graminoids
• Nitrogen‐fixing forbs and woody species at decimeter height < 1 cm
• Non‐leguminous forbs
• Woody‐stemmed shrubs with diameter at decimeter height < 1 cm
All data products include spatial and temporal sampling details, as well as required metadata. For addi‐
tional information on the sampling design and the associated protocol, see TOS Science Design for Plant
Biomass, Productivity, and Leaf Area Index (AD[06]), and the TOS Field and Lab Protocol for Herbaceous
Plant Biomass (AD[07]). Following data collection in the field and the lab, several standard QA/QC proce‐
dures are implemented, as described in Section 5 of this document, in order to produce quality‐checked
Level 1 herbaceous clip harvest data products.
Herbaceous clip harvest data may be used to estimate annual Aboveground Net Primary Productivity
(ANPP) and aboveground biomass at plot, site, and continental scales. They also provide essential data
for understanding vegetative carbon fluxes over time.
3.1 Spatial Sampling Design
The Herbaceous Clip Harvest sampling is implemented in Tower plots at all terrestrial NEON sites and in
Distributed plots at terrestrial NEON sites with non‐forest, herbaceous dominated, National Land Cover
Database (NLCD) Classification. Sampling occurs at a subset of Tower plots at some sites and at all Tower
plots at others, and in a maximum of twenty randomly selected Distributed plots, with ≥ 50% herba‐
ceous plant cover, per site. In Distributed plots, the maximum potential sampling effort (n=20 plots)
corresponds to sampling in ½ to ⅔ of the established Distributed plots per site. The Distributed plots at
which the herbaceous clip harvest protocol is performed are chosen according to a spatially balanced,
stratified‐random design in order to create an unbiased estimate of herbaceous biomass at the site scale
(see AD[08] for details).
In forest, grassland, and rangeland systems, for both plot types, the clip harvest is performed in 0.1 m x
2 m clip strips that exist within 0.5 m x 3 m gridded clip “cells” (Figure 1 and Figure 2). For typical sam‐
pling bouts, one gridded clip‐area “cell” is randomly chosen per 400 m2 plot or subplot. However, at sites
managed for grazing, an additional grid cell is placed within a grazing exclosure, resulting in two clip‐strips
Page 3 of 12Title: NEON User Guide to Herbaceous clip harvest (DP1.10023.001) Date: 02/01/2021
Author: Katherine Jones Revision: E
harvested per sampling bout. Grid cells that overlap with 25m2 nested subplots (used for seedling and
sapling counts) may be used for clip harvests, but those that overlap with 1m2 and 10m2 nested subplots
(used for diversity sampling) are never clipped. This ensures that generation of herbaceous plant produc‐
tivity data minimally affects the quality of plant diversity data. See TOS Science Design for Plant Biomass
and Productivity (AD[06]), TOS Protocol and Procedure: Measurement of Herbaceous Biomass (AD[07]),
TOS Science Design for Spatial Sampling (AD[08]) and TOS Science Design for Plant Diversity (AD[09]) for
further details.
Placement of clip strips is random and utilizes the randomized list of grid cell locations being utilized for
herbaceous clip harvest (AD[12]). This is an ordered list of all available sampling locations within a given
plot, from which a clipCell is removed after being utilized for sampling in any one of the three sampling
protocols. Removal precludes consideration of a clipCell for future sampling under all protocols.
Clip strip dimensions and orientation at agricultural sites differs from clip strips at non‐agricultural sites.
In all agricultural systems, clip strips are oriented perpendicular to crop rows. Plots planted with barley
and wheat utilize clip stips that are 2.0 m x 0.5 m; plots planted with corn, sorghum and soybeans clip
biomass within 1.5 m x 0.65 m clip strips consistent with Long‐Term Agroecosystem Research (LTAR) pro‐
tocols.
As much as possible, sampling occurs in the same locations over the lifetime of the Observatory. However,
over time some sampling locations may become impossible to sample, due to disturbance or other local
changes. When this occurs, the location and its location ID are retired. A location may also shift to slightly
different coordinates. Refer to the locations endpoint of the NEON API for details about locations that
have been moved or retired: https://data.neonscience.org/data‐api/endpoints/locations/
Page 4 of 12Title: NEON User Guide to Herbaceous clip harvest (DP1.10023.001) Date: 02/01/2021
Author: Katherine Jones Revision: E
Figure 1: A 20m x 20m (400m2 ) NEON plot showing potential clip harvest ”cells” (dashed blue lines). Cells
overlapping 10m2 nested subplots are not sampled for herbaceous biomass. When grazing management
is absent, one randomly selected grid cell is chosen for harvest per sampling bout. At sites managed for
grazing, two grid cells are sampled per bout. The pointID (red star) is used to calculate the location in
UTM of a given Clip List coordinate (red ‘x’).
Page 5 of 12Title: NEON User Guide to Herbaceous clip harvest (DP1.10023.001) Date: 02/01/2021
Author: Katherine Jones Revision: E
Figure 2: A 40m x 40m (1600 m2 ) NEON Tower plot showing clip‐harvest cells within a 400 m2 subplot.
Cells overlapping 10m2 nested subplots are not sampled for herbaceous biomass. Clip harvest samples
are generated from two randomly selected subplots per sampling bout, but for clarity, cells are not
shown in 3 of 4 subplots. At sites managed for grazing, two grid cells per selected subplot are sampled
per bout. For each subplotID (grey numbers), the pointID at the SW corner (red stars) is used to calculate
the location in UTM of a given Clip List coordinate (red ‘x’).
3.2 Temporal Sampling Design
NEON field and lab technicians will generate the herbaceous clip harvest data product at least once per
growing season for each site. However, the temporal sampling resolution depends on plot type. Dis‐
tributed plots are sampled at five year intervals at each site. In a site sampling year, Distributed plots are
harvested once per growing season except for agriculture sites, which can be harvested more frequently
when multiple crops are planted in a single growing season. The default sampling frequency for Tower
plots is once per year, but the following factors may result in additional sampling bouts per growing sea‐
son, and hence additional instances of the data product, and are assessed on a per site basis:
• Sites with distinct early‐season (C3 plants) and late‐season biomass peaks (C4 plants) are clip‐
harvested twice per growing season.
• Sites actively managed for grazing are clip‐harvested every 4 or 8 weeks depending on the compen‐
satory response of species present.
• Sites with continuous growth and decomposition (e.g., tropical and sub‐tropical grasslands) are
harvested more frequently than sites with periods of senescence.
Within a sampling season, herbaceous clip harvests are scheduled at phenologically consistent times
across sites to allow for data comparability across the Observatory and through time. To determine phe‐
nologically consistent sampling dates across widely different ecosystems, the TOS utilizes MODIS‐EVI phe‐
nology data for the majority of sites (Didan 2015), and more specifically, per site averages from the most
Page 6 of 12Title: NEON User Guide to Herbaceous clip harvest (DP1.10023.001) Date: 02/01/2021
Author: Katherine Jones Revision: E
recent 10 years that are updated every 5 years. Ungrazed, wildland site herbaceous clip harvest sam‐
pling schedules correspond to the average date after which greenness begins to decrease, ensuring a high
probability that all herbaceous biomass has been produced prior to clipping. For grazed sites, scheduled
sampling corresponds to green‐up dates, and it is assumed that cows are present from that point forward.
At agriculture sites, MODIS is considered a rough guide; field staff monitor crops for senescence and begin
clipping after the first leaves begin to dry or yellow, and work with sites to ensure clipping occurs before
crops are harvested.
Date values are assigned to a boutNumber in the field, and the boutNumber, year of sampling, and siteID
in which the clip harvest occurred are used to create a unique eventID associated with each herbaceous
dry weight mass value. Harvested herbaceous biomass is sorted to functional group for a minimum of
one sampling bout per growing season.
3.3 Sampling Design Changes
Several design changes have been implemented over the course of data collection. Such changes arise
due to continual evaluation of the sampling design for best practices in collaboration with external techni‐
cal working groups. Design changes also occur when optimization is necessary to ensure that allocation of
sampling effort is poised to maximize returns to the scientific community.
• Prior to 2018: Distributed plots were sampled at three‐year intervals. Subsequent sampling at five‐
year intervals coincides with other plant biomass and productivity data products at each site.
• Prior to 2018: All Tower plots were sampled during each sampling bout at each site.
• Prior to 2018: The Tower plot intra‐annual sampling at grazed sites occurred every four weeks dur‐
ing the growing season.
• Prior to 2018: At select grazed sites, those bouts not associated with peak biomass during which
samples are not sorted by functional group, the complete clip strip was collected and weighed. For
the 2018 and subsequent sampling years a subsample of the plot‐specific clip harvest is dried and
weighed, but data‐driven estimates of the entire sample mass are reported.
• Prior to 2019: Samples were sorted into functional groups that included the category ‘Leguminous
Forbs (LFB)’. Subsequent sampling places leguminous forbs and nitrogen fixers < 1 cm DBH into a
‘N‐fixer (NFX)’ functional group category.
• 2020: The field samplingImpractical was added to the data to allow for the generation of a record
when a plot could not be sampled or a sample could not be dried for a particular bout and year. If
field sampling was not possible samplingImpractical is populated with a value other than ‘OK’ (e.g.,
‘location flooded’) in the hbp_perbout table, no sample is collected, and no record is generated in
the hbp_massdata table. If a sample is collected but not dried or weighed, samplingImpractical is
populated with a value other than ‘OK’ in the hbp_massdata table and no mass data are available
for that sample.
• 2020: The field biophysicalCriteria was added to the data to account for instances when sampling
occurred but conditions were not optimal. If conditions were suboptimal ‐ the sample was not col‐
lected during peak biomass ‐ the field biophysicalCriteria is populated with a value other than ‘OK
Page 7 of 12Title: NEON User Guide to Herbaceous clip harvest (DP1.10023.001) Date: 02/01/2021
Author: Katherine Jones Revision: E
‐ no known exceptions’ (e.g., ‘conditions not met: most plants not yet flowering’) but the sample is
collected and mass data are generated.
• Prior to 2021: The bout number for each clipping event within a site was assigned a number. Sam‐
pling at Tower plots began with bout = 1 and continued with ordered numeric increments for each
sampling event at each site within a sampling year. Bout number = 0 was assigned to Distributed
plots that are typically harvested only once per season for biomass stocks. This means that agricul‐
ture sites where different Distributed Plots may be harvested at different times all have boutNum‐
ber = 0, regardless of clipDate.
3.4 Variables Reported
All variables reported from the field or laboratory technician (L0 data) are listed in the file, NEON Raw
Data Ingest Workbook for TOS Herbaceous Biomass (DP0.10023.001) (AD[04]). All variables reported in
the published data (L1 data) are also provided separately in the file, NEON Data Publication Workbook for
TOS Herbaceous Biomass: QA/QC of Raw Field and Lab Data (DP1.10023.001) (AD[05]).
Field names have been standardized with Darwin Core terms (http://rs.tdwg.org/dwc/; accessed 16
February 2014), the Global Biodiversity Information Facility vocabularies (http://rs.gbif.org/vocabulary
/gbif/; accessed 16 February 2014), the VegCore data dictionary (https://projects.nceas.ucsb.edu/nc
eas/projects/bien/wiki/VegCore; accessed 16 February 2014), where applicable. NEON TOS spatial data
employs the World Geodetic System 1984 (WGS84) for its fundamental reference datum and GEOID09
for its reference gravitational ellipsoid. Latitudes and longitudes are denoted in decimal notation to six
decimal places, with longitudes indicated as negative west of the Greenwich meridian.
Some variables described in this document may be for NEON internal use only and will not appear in
downloaded data.
3.5 Spatial Resolution and Extent
The overall spatial hierarchy of the herbaceous clip harvest data product is subtly different for Tower plots
compared to Distributed plots. For Tower plots that are 40 m x 40 m and larger, the gridded clip harvest
locations exist within subplotIDs within each plotID (Figure 2):
Tower plots (≥ 1600m2 ): clipID Ý subplotID Ý plotID Ý habitat (NLCD veg class) Ý siteID Ý domainID
All other plots:clipID Ý plotID Ý habitat Ý siteID Ý domainID
The basic spatial data included in the data download include the latitude, longitude, and elevation of the
centroid of the plot where sampling occurred + associated uncertainty due to GPS error and plot width.
Shapefiles of all NEON TOS sampling locations can be found in the Document Library: http://data.neonsci
ence.org/documents.
To derive a more precise estimate of the location of each trap, there are two options:
1. Use the def.calc.geo.os function from the geoNEON package, available here: https://github.com/N
EONScience/NEON‐geolocation
2. Or follow these steps to perform the same calculation:
Page 8 of 12Title: NEON User Guide to Herbaceous clip harvest (DP1.10023.001) Date: 02/01/2021
Author: Katherine Jones Revision: E
a. The namedLocation field in the data is the named location of the plot; more precise geographic
data require the named location of the subplot. Construct the named location of the subplot
of each record in hbp_perbout by concatenating the fields for namedLocation and subplotID as:
namedLocation + ‘.’ + subplotID, e.g. subplotID ‘41’ of namedLocation ‘HARV_052.basePlot.hbp’
has a complete named location of ‘HARV_052.basePlot.hbp.41’.
b. Use the API (http://data.neonscience.org/data‐api; e.g. http://data.neonscience.org/api
/v0/locations/HARV_052.basePlot.hbp.41) to query for elevation(“locationElevation”), east‐
ing(“locationUtmEasting”), northing(“locationUtmNorthing”), coordinateUncertainty (“Value for
Coordinate uncertainty”), elevationUncertainty (“Value for Elevation uncertainty”), and utmZone
(“locationUtmZone”) as inputs to the next step.
c. Calculate the clipCellNumber of each trap (last 3 digits of clipID).
d. Use the clip cell lookup table, available here: http://data.neonscience.org/api/v0/docume
nts/clipCellNumber_lookup (clicking on link will initiate download), to find the offsets for each
clipCellNumber and subplot (=pointID), and use the offsets to adjust the UTM values downloaded
in step 2.
e. Increase coordinateUncertainty by an appropriate amount to account for error introduced by
navigating within plots. Technicians may shift elevated trap up to 1 meter to either the north or
south within a selected clip cell to avoid obstacles. Additional error may be introduced due to tape
stretching to navigate to locations within plots.
3.6 Temporal Resolution and Extent
The finest temporal resolution at which instances of the herbaceous clip harvest data product are tracked
is the date of harvest, collectDate, for a given plot or subplot.
collectDate (date an individual strip was clipped) Ý eventID Ý annual production
The NEON Data Portal provides data in monthly files for query and download efficiency. Queries including
any part of a month will return data from the entire month. Code to stack files across months is available
here: https://github.com/NEONScience/NEON‐utilities.
3.7 Associated Data Streams
Additional information about woody vegetation present in the plot, if relevant, is available in the NEON
Woody Plant Vegetation Structure data product (DP1.10098.001). Users are advised to leverage data from
vegetation structure to provide context to clip harvest data. Additional information about litter produc‐
tion in the plot is available in the NEON Litterfall and Fine Woody Debris data product (DP1.10033.001).
The herbaceous clip harvest data product is used as an input to the herbaceous production data prod‐
uct, the latter of which is detailed in NEON ATBD: TOS Herbaceous Biomass – Aboveground Productiv‐
ity Calculations (AD[12]). Separate, additional herbaceous clip harvest sampling events are carried out
to generate samples analyzed for isotopes and chemistry. The results of these analyses can be found
in NEON’s plant foliar stable isotopes (NEON.DOM.SITE.DP1.10053) and plant foliar chemical properties
(NEON.DOM.SITE.DP1.10051) data products.
Page 9 of 12Title: NEON User Guide to Herbaceous clip harvest (DP1.10023.001) Date: 02/01/2021
Author: Katherine Jones Revision: E
3.8 Product Instances
There are a maximum of 2 herbaceous clip harvest bouts per year at ungrazed sites, with samples col‐
lected from no more than 40 clip strips in Tower plots and no more than 20 clip strips in Distributed plots,
for a total of 60 or fewer clip strips per site. Each clip yields 1‐5 herb group samples. No ungrazed site
should ever exceed 500 data product instances in a single calendar year.
At grazed sites, Tower plots are sampled no more than 8 times per year. There are 2 clip strips per
plot/subplot resulting in up to 80 clip strips in Tower plots. Only 1 bout per year is sorted to herb group
resulting a maximum of 960 samples generated in Tower plots. In years scheduled for sampling in Dis‐
tributed plots, 20 clip strips yielding 1‐5 mass samples each are also clipped. No grazed site should ever
exceed 1160 data product instances in a single calendar year.
3.9 Data Relationships
A selected clipID is only ever harvested once. The unique sampleID is generated from the clipID and
the collectDate. Each sampleID created in the field sampling activity, hbp_perbout, results in 1‐5 child
records, subsampleIDs, in the hbp_massdata table. Duplicates and/or missing data may exist where proto‐
col and/or data entry abberations have occurred; users should check data carefully for anomalies before
joining tables.
hbp_perbout Ý One record expected per clipID per collectDate, producing only one instance of sampleID
for all time in the hbp_perbout table
hbp_massdata Ý One record expected per sampleID per herbGroup, generates a single subampleID. Du‐
plicate instances of a single subampleID are expected to exist where qaDryMass = ‘Y’; these are samples
that are reweighed for quality assurance purposes.
sampleID and the associated barcode (sampleCode) can be used to link the tables. The sampleID and
sampleCode will be generated for each collection event, and subsampleIDs and subsampleCodes will be
generated fore each functional group within a sample in the hbp_massdata table. Physical samples will
be discarded following measurement.
Primary key for hbp_perbout Ý plotID, clipID, collectDate, sampleID, sampleCode
Primary key for hbp_massdata Ý sampleID, sampleCode, subsampleID, subsampleCode, qaDryMass
Data downloaded from the NEON Data Portal are provided in separate data files for each site and month
requested. The neonUtilities R package contains functions to merge these files across sites and months
into a single file for each table described above. The neonUtilities package is available from the Compre‐
hensive R Archive Network (CRAN; https://cran.r‐project.org/web/packages/neonUtilities/index.html)
and can be installed using the install.packages() function in R. For instructions on using neonUtilities
to merge NEON data files, see the Download and Explore NEON Data tutorial on the NEON website:
https://www.neonscience.org/download‐explore‐neon‐data.
Page 10 of 12Title: NEON User Guide to Herbaceous clip harvest (DP1.10023.001) Date: 02/01/2021
Author: Katherine Jones Revision: E
4 DATA QUALITY
4.1 Data Entry Constraint and Validation
Many quality control measures are implemented at the point of data entry within a mobile data entry ap‐
plication or web user interface (UI). For example, data formats are constrained and data values controlled
through the provision of dropdown options, which reduces the number of processing steps necessary to
prepare the raw data for publication. An additional set of constraints are implemented during the pro‐
cess of ingest into the NEON database. The product‐specific data constraint and validation requirements
built into data entry applications and database ingest are described in the document NEON Raw Data In‐
gest Workbook for TOS Herbaceous Biomass (DP0.10023.001), provided with every download of this data
product. Contained within this file is a field named ‘entryValidationRulesForm’, which describes syntac‐
tically the validation rules for each field built into the data entry application. Data entry constraints are
described in Nicl syntax in the validation file provided with every data download, and the Nicl language is
described in NEON’s Ingest Conversion Language (NICL) specifications ([AD[15]).
Data collected prior to 2017 were processed using a paper‐based workflow that did not implement the
full suite of quality control features associated with the interactive digital workflow.
A schematic of the data entry application design is depicted in Figure 3.
Figure 3: Schematic of the applications used by field technicians to enter herbaceous biomass data
Page 11 of 12Title: NEON User Guide to Herbaceous clip harvest (DP1.10023.001) Date: 02/01/2021
Author: Katherine Jones Revision: E
4.2 Automated Data Processing Steps
Following data entry into a mobile application of web user interface, the steps used to process the data
through to publication on the NEON Data Portal are detailed in the NEON Algorithm Theoretical Basis
Document: OS Generic Transitions (AD[13]).
4.3 Data Revision
All data are provisional until a numbered version is released; the first release of a static version of NEON
data, annotated with a globally unique identifier, is planned to take place in 2021. During the provisional
period, QA/QC is an active process, as opposed to a discrete activity performed once, and records are
updated on a rolling basis as a result of scheduled tests or feedback from data users. The Change Log sec‐
tion of the data product readme, provided with every data download, contains a history of major known
errors and revisions.
4.4 Quality Flagging
The dataQF field in each data record is a quality flag for known errors applying to the record. Please see
below for an explanation of dataQF codes specific to this product.
Table 1: Descriptions of the dataQF codes for quality flagging
fieldName value definition
Data recorded using a paper‐based workflow that did not imple‐
dataQF legacyData ment the full suite of quality control features associated with the
interactive digital workflow
Additional known quality issues that are not flagged: For all records published prior to 2019‐08‐27, the
measuredBy and recordedBy fields were populated incorrectly and may or may not be unique.
Records of land management activities, disturbances, and other incidents of ecological note that
may have a potential impact are found in the Site Management and Event Reporting data product
(DP1.10111.001)
Page 12 of 12You can also read