Search Analysis for the Underwater Wreckage of Air France Flight 447
←
→
Page content transcription
If your browser does not render page correctly, please read the page content below
Search Analysis for the Underwater Wreckage
                        of Air France Flight 447
                     Lawrence D. Stone
                                                                               Johan P. Strumpfer
                      Colleen M. Keller
                                                                               Partners for Change
                     Thomas M. Kratzke
                                                                              Clovelly, South Africa
                          Metron Inc
                                                                          johan@partnersforchange.co.za
                    Reston Virginia, U.S.A.
                      Stone@metsci.com
                      keller@metsci.com
                     kratzke@metsci.com

On 1 June 2009 Air France Flight 447, with 228                 proved unsuccessful. The Phase III search, which took
passengers and crew aboard, disappeared over the               place from 2 April to 24 May 2010, consisted of
South Atlantic during a night flight from Rio de Janeiro       additional side looking sonar searches using REMUS
to Paris. An international air and surface search effort       AUVs operated by the Woods Hole Oceanographic
located the first floating debris during the sixth day of      Institute (WHOI) and using the ORION towed side-
search. Three phases of unsuccessful search for the            looking sonar operated by the US Navy with assistance
underwater wreckage ensued. Phase I was a passive              from Phoenix International. The search also used a Triton
acoustic search for the aircraft’s underwater locator          ROV provided by Seabed AS (Norway). It was likewise
beacons. Phases II and III were side-looking sonar             unsuccessful.
searches scanning the ocean bottom for the wreckage                  In July of 2010, Metron was tasked by the BEA to
field. In July of 2010 the French Bureau d’Enquêtes et         review the search and to produce an updated posterior
d’Analyses tasked Metron to review the searches and            probability map for the location of the underwater
produce posterior probability maps for the location of         wreckage. To accomplish this Metron reviewed and
the wreckage. These maps were used to plan the next            modified the distributions developed in 2009. A new
phase of search beginning in March 2011. On April 3,           prior was developed based on studies by the BEA, the
after one week of search, the wreckage was located in a        Russian Interstate Aviation Group (MAK), and a new
high probability area of the map.                              reverse drift analysis using updated current estimates.
                                                                     Metron analyzed the effectiveness of Phase III side
Keywords: Search, Bayesian, Posterior Distribution.            looking sonar searches performed by the WHOI REMUS
                                                               and the US Navy ORION sensors and computed an
1    Introduction                                              updated posterior probability distribution for the location
On 1 June 2009 Air France Flight 447, an Airbus 330-200        of the wreckage using the new prior distribution and
with 228 passengers and crew, disappeared over the South       incorporating the unsuccessful phase I and II searches
Atlantic during a night flight from Rio de Janeiro to Paris.   performed during 2009, as well as the unsuccessful Phase
An international air and surface search effort recovered       III searches performed by REMUS and ORION in 2010
the first wreckage on June 6th, five and one half days after   as well as the Triton ROV searches. Metron also
the accident. More than 1000 pieces of the aircraft and 50     accounted for the unsuccessful surface searches
bodies were recovered and their positions logged. A            performed by aircraft and ships between 1 and 6 June
French submarine as well as French and American                2009.
research teams searched acoustically for the Underwater              Metron’s previous work in search applications,
Locator Beacons (ULBs, or “pingers”) on each of the two        detailed in references [1,2,3], includes searches for the
flight recorder’s “black boxes” for 31 days from 10 June       U.S. nuclear submarine Scorpion, the SS Central America,
to 10 July 2009 with no results.                               and Steve Fossett’s crash site. In addition, Metron played
      In early July of 2009 the French Bureau d’Enquêtes       a key role in developing the U. S Coast Guard’s Search
et d’Analyses pour la sécurité de l’aviation civile,           and Rescue Optimal Planning System (SAROPS) which
abbreviated as BEA, contacted Metron for assistance in         has been successfully employed to plan and execute
preparing for Phase II of the search, utilizing side-looking   searches for ships and personnel lost at sea [4]. This
sonar to scan the ocean bottom for the wreckage field.         paper describes the results of Metron’s Air France 447
      The Phase II side looking sonar search, performed        (AF 447) analysis.
by the Pourquoi Pas? from 27 July to 17 August 2009,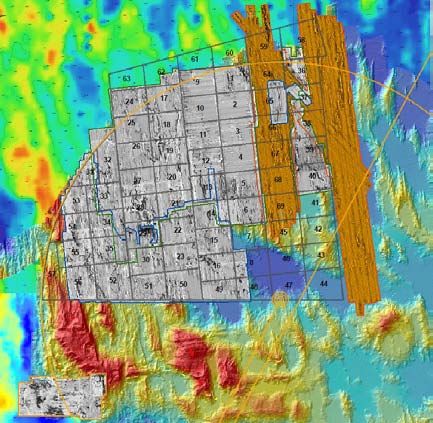
2    Approach                                                  estimates CDP at the conclusion of each underwater
                                                               search phase.
   Our approach to this search planning problem is rooted        The following chart summarizes the various steps of
in classical Bayesian inference, which allows the              this approach and also references other figures that are
organization of available data with associated                 used throughout this report. In Phase I, the Reverse Drift
uncertainties and computation of the Probability               and Surface Search blocks, shown in green, use the
Distribution Function (PDF) for target location given          SAROPS environmental module that simulates winds and
these data. In following this approach, the first step was     currents in the search zone. The other Phase I blocks are
to gather the available information about the location of      based on flight dynamics computations and a study
the impact site of the aircraft. Using a Bayesian approach     undertaken on loss of control accidents during flight.
we organized this material into consistent scenarios,
quantified the uncertainties with probability distributions,                            Fig 13

weighted the relative likelihood of each scenario, and
                                                                                        Fig 11
performed a simulation to produce a prior PDF for the
location of the wreck. This is the same methodology that
                                                                                        Fig 9
was pioneered in [1] and incorporated into SAROPS.
   Next we estimated the effect of the unsuccessful search
efforts. These efforts included air and surface searches                        Fig 7
for floating debris and underwater searches in Phases I, II,                                             Fig 6
and III. The goal of the Phase I search was to detect
signals from the flight recorders’ ULBs. The Phase II and                                                Fig 5
III searches involved the use of side-looking sonar and
cameras to detect the underwater debris field of the wreck                                                       Fig 4
                                                                                                 Fig 3
of the AF 447 flight. For each search, we enlisted sensor
experts and knowledge of the sea state, visibility,
underwater geography, and water column conditions to
estimate sensor performance. The results of the search                  Figure 1. Summary of PDF Computation
assessment, combined mathematically with the prior PDF
of the impact site, yielded the posterior PDF for the            As an excursion, we computed the posterior PDF
impact location given the unsuccessful search efforts.         assuming that both ULB “pingers” failed to function
Posterior PDFs after each phase of the search are              during the Phase I search. On 3 April 2011, the wreckage
presented in Section 4 along with the estimated                was found in a high probability area of this distribution
effectiveness of the search in terms of Cumulative             (Figure 14). From the location of the wreckage, it appears
Detection Probability (CDP).                                   that the ULBs either failed to operate properly or failed to
   The posterior distribution given in Section 4 provided      be detected, which greatly increased the difficulty of the
guidance for the location of the wreckage and the amount       search. In early May the Flight Data Recorder and
of additional search effort required to obtain a high          Cockpit Voice Recorder were recovered.
probability of success.
   Section 3 of this paper describes the method for            3     Prior PDF for Impact Location
producing the prior (to the surface search) PDF for impact       In this section we compute the prior (before surface
location.     This distribution is composed of two             search) PDF for impact location. This PDF has two
components. The first component, called the Flight             components, a flight dynamics and a reverse drift
Dynamics (FD) prior, is based on flight dynamics               component.
considerations and information from past crashes. The
second component of this prior is derived from the             3.1    Flight Dynamics Prior
information provided by the detection and recovery of
floating debris from the wreckage of the aircraft on 6 June       This prior is the mixture of two distributions. The first
– 10 June. This information was used to produce a              is based on purely flight dynamics considerations about
Reverse Drift (RD) prior. The FD and RD priors were            the maximum distance the aircraft could have feasibly
blended to produce a surface search prior.                     traveled from the time of its last reported position (last
   In section 4, the effect of the unsuccessful surface        known position (LKP)) at 35,000 ft. altitude to the time
searches during 1 June – 6 June 2009 conducted by              when a scheduled response from the Aircraft
aircraft and ships was used to compute the surface search      Communications Addressing and Reporting System
posterior. This posterior became the prior for the passive     (ACARS) was not received. ACARS is a maintenance
and side-scan sonar searches in Phases I, II, and III. The     and logistics reporting system that sends out position
remainder of section 4 computes the posterior PDF and          reports based on GPS roughly every 10 minutes. The
                                                               impact time was estimated based on the time of the last
                                                               ACARS message received and the expectation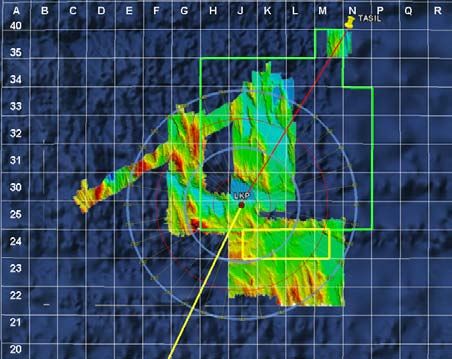
(unfulfilled) of a subsequent message in the next 60 3.2 Reverse Drift Prior
seconds. The end of the flight occurred between 2 h 14
min 26 sec and 2 h 15 min 14 sec - see page 39 of [5]. An The reverse drift (RD) prior was computed using
analysis was performed by the BEA and reported in SAROPS and data on currents and winds to reverse the
reference [6] which produced a uniform distribution over motion of recovered floating debris pieces back to the
the disk of radius 40 NM centered at the LKP. This is the time of impact.
first distribution. The U. S. Coast Guard employs SAROPS for all their
The second distribution is based on data from nine search and rescue planning. SAROPS allows a search
commercial aircraft accidents involving loss of control. planner to define scenarios, obtain the winds and currents
This analysis was performed by the Russian Interstate necessary to compute drift trajectories, estimate effective
Aviation Group [7] and the BEA. Figure 2 shows the sweep widths for search sensors, develop probability
cumulative distribution of distance (pro-rated to 35,000 ft. distributions for search object location, and find near
altitude) flown from the beginning of the emergency optimal search plans given the amount of search effort
situation to impact of the aircraft. available.
Fraction of Impact Locations within Distance D of Beginning of Emergency In order to compute an RD scenario, one must have an
1
estimate of the surface currents in the area of the crash
0.9
during 1 – 10 June 2009. The BEA commissioned a
0.8
group of oceanographic experts to review the data
0.7
available for estimating these currents. The results are
0.6 reported in the Drift Group Report [8]. Because the area
Fraction
0.5 is near the equator and in the middle of the Atlantic, the
0.4 currents are complex and difficult to estimate. In addition
0.3
the remote nature of the crash site meant that there were
0.2
few meteorological measurements to provide a basis for
0.1
current estimates. Because of the complexity of the
currents and the lack of data, there is substantial
0
0 2 4 6 8 10
D (NM)
12 14 16 18 20
uncertainty in these estimates.
Figure 2. Cumulative Distribution of Distance Traveled from Metron used the ANALYSE_75KM_LPO current
Beginning of Emergency to Impact Location estimates to compute a reverse drift prior. These
The analysis shows that all impact points are contained estimates were produced as a result of the work of the
within a 20-NM radius circle from the point at which the Drift Group. However, we have given the results based
emergency situation began. These results are represented on these estimates a low weight (30%) in producing the
by a circular normal distribution with center at the LKP prior and posterior distributions because of the great
and standard deviation 8 NM along both axes. For the uncertainty associated with the estimates.
Flight Dynamics (FD) prior, we chose a mixture weighted To produce the RD Prior Metron used the positions and
by 50% for the uniform over 40 NM distribution and 50% recovery times of the 33 bodies that were located from 6 –
for the circular normal distribution truncated at 40 NM 10 June 2009 [5]. Some bodies were recovered in groups.
from the LKP. This distribution is shown in Figure 3 The positions of the bodies or groups of bodies were
drifted back in time using the ANALYSE_75KM_LPO
current estimates.
There are two components of drift. Drift due to ocean
current and drift due to wind which is called leeway. We
did not apply reverse drift to pieces of debris that were
recovered during this time because we do not have good
models for the effect of leeway on this type of debris.
Data obtained in September 2009 from experiments on
the drift of a manikin modified to simulate a deceased
person floating in the water (PIW) is reported in [9].
From these experiments, the authors produced the leeway
model shown by equation (1) below. This model, which
is based on empirical data, produces a total drift speed of
roughly 2.35% of wind speed and includes a cross wind
component. The equations in (1) were used in SAROPS
to account for the leeway of the bodies.
Figure 3. Flight Dynamics Prior
DWL = 1.17W10 m + 10.2 cm/s
(1)
CWL = 0.04W10 m + 3.9 cm/s
where W10m is in m/s and DWL and CWL are in cm/s.               the search efforts in Phases I – III, and combine them to
  Figure 4 shows the reverse drift distribution produced        compute the posterior PDF on impact location given
in this fashion and truncated at the 40 NM circle.              failure of these efforts.
                                                                  The unsuccessful searches considered in this analysis
                                                                include the ones listed below.
                                                                Unsuccessful Surface Searches: 1 June to 5 June 2009.
                                                                     • The air and ship search efforts failed to positively
                                                                          identify and recover floating debris or bodies
                                                                          during the period from 1 June to 5 June. The first
                                                                          piece of debris was recovered and identified on
                                                                          June 6th.
                                                                Phase I: 10 June to 10 July 2009
                                                                     • Passive acoustic searches for the “black box”
                                                                          Underwater Locator Beacons (ULBs) by the US
                                                                          Navy Towed Pinger Locators (TPLs).
                                                                     • Search by the IFREMER Victor Remotely
                                                                          Operated Vehicle (ROV)
                                                                Phase II: 27 July to 17August 2009
                                                                     • Side looking sonar search by the IFREMER deep
                                                                          sonar towed by the Pourquoi Pas?
                  Figure 4. Reverse Drift Prior                 Phase III: 2 April – 24 May 2010
                                                                     • Side-scan sonar search by three REMUS
3.3     Prior Before Surface Search                                       Autonomous Underwater Vehicles (AUVs) and
                                                                          visual/sonar search by the Triton ROV.
  The prior distribution before surface search by aircraft
and ships is a mixture of 70% of the FD Prior given in               • Search by the USN Orion towed side-scan sonar
section 3.1 and 30% of the RD Prior given in section 3.2.                 system.
The resulting distribution is shown in Figure 5.                4.1    Accounting for Unsuccessful Search
                                                                   The SAROPS program uses a large number N of
                                                                simulated points or particles to represent the probability
                                                                distribution on the path or location of a search object.
                                                                The n th particle has weight wn for n = 1, …, N . Initially
                                                                all weights are set equal. The weight is the probability
                                                                that the particle represents the search object’s location or
                                                                path. The SAROPS PDF in Figure 5 was produced by
                                                                adding the weights (probabilities) of the particles in each
                                                                cell to obtain the probability that the impact point is in
                                                                that cell. These probabilities are represented by the color
                                                                code progressing from red to yellow to blue as cells
                                                                progress from high to low probability. The particles form
                                                                the actual distribution computed by SAROPS. The cells
                                                                are used simply as a method of display.
                                                                   If an unsuccessful search takes place, we compute the
    Figure 5. PDF for Impact Location Prior to Surface Search   probability p1d (n) that the search would have detected the
                                                                search object if it were located where particle n is for
4     Posterior Distribution Given                               n = 1, …, N .    From this we compute the posterior
                                                                distribution on object location using Bayes’ rule as
      Unsuccessful Search                                       follows).
  Effort that fails to find the search object provides                             (1− p1d (n)) wn
(negative) information about the object’s location. This                 wn =
                                                                          1
                                                                                                        for n = 1, …, N   (2)
                                                                               ∑ n′=1(1− p1d (n ′)) wn′
                                                                                  N
information is incorporated into the posterior distribution
on impact location through the use of Bayes’ rule in the
fashion described in Section 4.1 In this section we             where w1n is the posterior probability that particle n
estimate the effectiveness of the surface search effort and     represents the object’s location. We can see from (2) that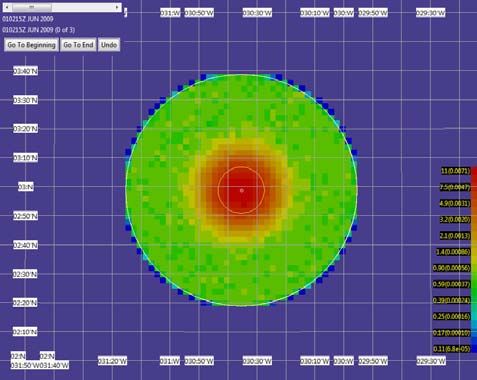
if p1d (n) is close to 1, the posterior probability on particle   calculated a new PDF for the impact point. The result of
 n will tend to be low. Correspondingly those particles           this calculation is shown in Figure 6.
with low values of p1d (n) will tend to have high posterior
probabilities.
  If the particles are moving and the search sensor is
moving, SAROPS accounts for both of these motions in
calculating pd (n) for each particle.

4.2    Aircraft and Ship Surface Search
   Searches for debris by Brazilian and French aircraft
were conducted from June 1st to June 26th 2009. These
searches were unsuccessful until June 6 when debris and
bodies from the aircraft were first recovered. Analysis of
the unsuccessful air searches and ship searches prior to 6
June provides negative search information that we use to
decrease the probability on some particles and increase it
on others according to Bayes’ rule.
   Search paths for each sortie were entered into SAROPS,                  Figure 6. Surface Search Posterior PDF
along with information on altitude, speed, aircraft type,
                                                                       Underwater Search Prior. For the purpose of
meteorological visibility, sea state, and expected sensor
                                                                  evaluating the underwater search, we formed a prior
performance against a raft-sized target (specifically a
                                                                  which is a mixture of 30% of the Surface Search Posterior
four-man raft), which was taken as a surrogate for the
                                                                  in Figure 6 and 70% of the FD Prior in Figure 2. This
detectability of a large piece of debris such as the galley.
                                                                  PDF is shown in Figure 7. We have given the Surface
In addition to the air search, we included the effort of the
                                                                  Search Posterior a low weight in this PDF because it
ship Douce France that searched in the vicinity of LKP
                                                                  depends heavily on estimates of currents in the area of the
on June 1st.
                                                                  crash during 1 – 10 June. For the reasons discussed in
   Two Brazilian Air Force Embraer R-99 and a French
                                                                  Section 3.2, we have low confidence in these estimates
Air Force E-3F (AWACS) were also involved in the
search. They patrolled at high altitude and used their
airborne radars to search for possible reflections from the
ocean surface. The (vast) surfaces that they covered are
not accounted for in the search analysis. Only the low
altitude visual searches in the vicinity of the 40 NM circle
are included.
   To evaluate the effect of the unsuccessful surface
search, we started with the surface search prior
distribution given in Figure 5. We allocated simulation
particles in accordance with the probability density in
each cell. We then used SAROPS to “drift” these
particles forward in time from the time of impact though 6
June. In the process of doing this we accounted for the
unsuccessful aircraft and ship search during that time.
The search object was assumed to have the drift and
detection characteristics of a four-person life raft. If the
particles were predicted to pass through an area searched                  Figure 7. Underwater Search Prior PDF
by aircraft or the Douce France, their weight was
appropriately reduced according to the estimated detection        4.3    Phase I Searches
probability for that platform sortie as described in section
                                                                    In this section we describe the searches performed
4.1. The result is a set of particles whose weights
                                                                  during Phase I and compute the posterior PDFs resulting
(probabilities) have been updated to incorporate the
                                                                  from these unsuccessful searches.
unsuccessful air and ship search effort during those days.
                                                                       Acoustic Searches for the ULBs. The aircraft was
      Surface Search Posterior. We then pulled each
                                                                  equipped with two “black boxes”, the digital Flight Data
particle back to its position at the time of impact keeping
                                                                  Recorder (FDR) and the Cockpit Voice Recorder (CVR).
its weight the same as it was at the end of unsuccessful
                                                                  These ruggedized devices are designed to withstand the
surface search. From these reweighted particles, we
                                                                  high impacts expected in a crash, and are fitted with an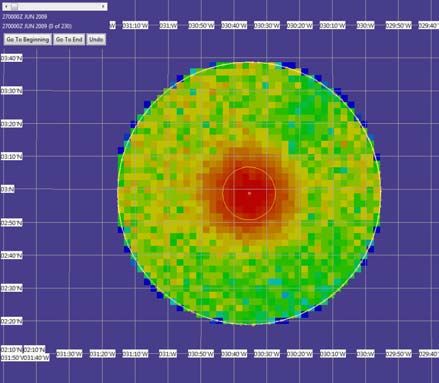
Underwater Locator Beacon (ULB) that activates when            were likely to be working according to the manufacturer,
contact is made with water. The batteries on the ULBs          we discounted the TPL detection probability to 0.385.
are certified to last at least 30 days. In the case of the
ULBs fitted on this aircraft, the manufacturer stated that
the duration of the transmission was of the order of forty
days.
  The passive acoustic search for the FDR and CVR,
which lasted 31 days and ended on 10 July 2009,
primarily involved two tugs hired to assist in the search,
Fairmount Glacier and Fairmount Expedition.
  The Fairmount ships’ search efforts overlaid the
aircraft’s intended track. Both ships employed Towed
Pinger Locators (TPLs) supplied by the US Navy.
Personnel from Phoenix International operated the
equipment. On-site tests indicated the equipment was
functioning properly.
  The TPL sensors were assessed to detect the ULBs at a
lateral range of 1730m with a POD of 0.90. This
detection range accounted for the frequency of the ULBs’
emissions (37.5 kHz) and the assumed source level (160            Figure 8. Fairmount Glacier (orange) and Expedition
dB). The TPLs were flying above the underwater terrain,                         (pink) TPL Search Tracks
so we estimated that degradation due to terrain shadowing        The posterior distribution after unsuccessful ULB
was minimal. Environmental calculations showed that            searches by the Fairmount ships is shown in Figure 9.
deep water propagation in this area is basically direct path   This is the posterior for the location of the underwater
and the transmission loss and ambient noise are                wreckage after the Phase I searches. The Cumulative
sufficiently low to provide detection probabilities of 0.90    Detection Probability for the TPL searches is 0.41.
or above, a number that we feel is conservative provided
at least one of the ULBs was operating properly. The
ships’ tracks, reconstructed from GPS data, are shown in
Figure 8 below.
  The calculation of the probability of detection for the
TPL search must account for the possibility that the ULBs
were destroyed in the crash. Based on the condition of
the wreckage recovered and after conferring with the
BEA, we assumed a probability of 0.8 that a single ULB
survived the crash If ULB survival is considered
independent, then the probability of detecting at least one
ULB given it is within lateral range 1730 m of the TPL as
follows:
     PD = Pr {detect|both working} Pr {both working}
           + Pr {detect|one working} Pr {one working}
       = (1− (0.1) 2 ) (0.8) 2 + (0.9)(2(0.8)(0.2)) = 0.92           Figure 9. Posterior PDF after Phase I: CDP = 0.41
If the ULBs were mounted sufficiently close together to
consider their chances of survival to be completely            4.4     Phase II Search
dependent, then the probability of detecting at least one        To continue the search after the pingers’ extinction, the
ULB drops to 0.9×0.8 = 0.72.                                   BEA decided to use the IFREMER side-looking sonar
   It is difficult to say whether the survival of the two      towed by the Pourquoi Pas? which had the capability to
ULBs should be considered independent events. In light         complete the bathymetry survey of the area thanks to its
of this uncertainty, it was decided to use a weighted          hull-mounted multi-beam sonar.
average of 0.25 for the independent and 0.75 for the             Metron’s 2009 analysis of the Phase I search efforts
dependent probabilities yielding a 0.77 detection              was presented to the BEA during the planning for the
probability given a ULB is within lateral range 1730 m of      second phase of search. It was estimated that the
a TPL search during the 30 day period from June 1 – June       Pourquoi Pas? could cover three-to-four cells in the three
30 , 2009 which corresponds to the pingers rated 30 day        weeks in which it would be on station at the accident site,
lifetime. During the additional 10 days that the pingers       achieving a 0.9 POD in those cells.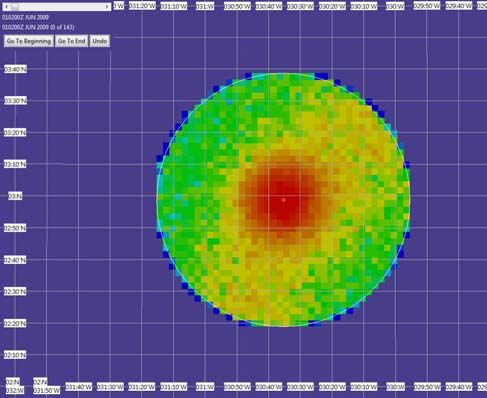
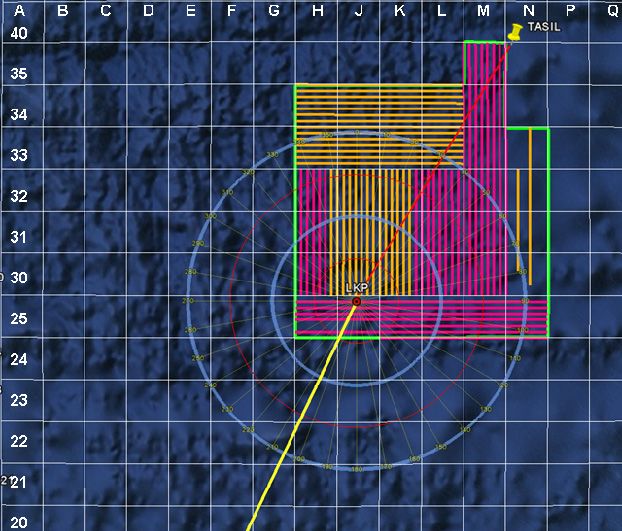
The BEA chose to search the eastern half of J24, all of reviewed in accelerated playback and all items of interest
K24 and L24, and the western half of M24 as shown in were further processed with sonar enhancement software.
yellow in Figure 10. This constituted three full cells in a US Navy/Phoenix International operators/analysts
row south/southeast of the LKP, 19 – 36 NM away at the evaluated the 1743 km2 as having been covered with the
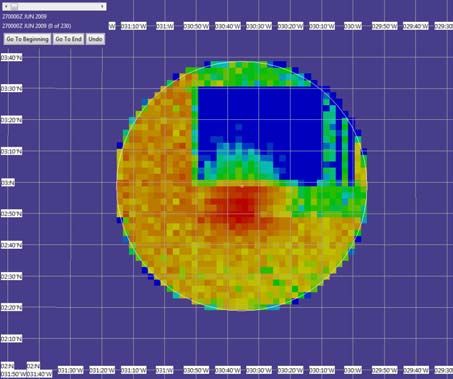
farthest point. Figure 11 shows the posterior PDF after highest degree of confidence. Two patches of bottom,
the unsuccessful Phase II search. located in the peaks of some of the steepest slopes
produced returns that were not interpretable. These were
subsequently covered by REMUS 6000 AUVs. In the
high confidence areas, we used a detection probability of
0.90. For the rest, we set the detection probability to 0.50
with the exception of the ridge areas which received 0.10.
Figure 10. Pourquoi Pas? Search Cells (yellow).
Figure 12. Search Areas for ORION (orange) and
REMUS/Triton (grey)
Within the searched area Phoenix International
operators identified a number of small targets which BEA
planed to investigate during search operations in 2011.
Woods Hole Oceanographic Institution. The Seabed
Worker deployed to the search area with three REMUS
6000 AUVs — two belonging to the Waitt Institute for
Discovery and one to GEOMAR, and the Seabed Triton
XLX 4000 ROV. The three REMUS vehicles covered the
Figure 11. Posterior PDF after Phase II: CDP = 0.45 4,375 km2 area shown in grey in Figure 12. The REMUS
side scan sonar maximum range is 600 – 700 m. Search
4.5 Phase III Searches legs were spaced a distance apart equal to the maximum
There were two search efforts during Phase III. One range less 50 m which produced double coverage almost
involved the US Navy/Phoenix International with assets everywhere within its search area. Most regions of steep
onboard the Anne Candies and the other involved assets terrain, such as ridges, were imaged from both sides and
operated by WHOI. Both efforts used side-scan sonar. were thus well searched. Exceptions were regions that
The search area covered by these searches was, for the contained ridges that were not suitable for side-looking
most part, determined by the search area sonar coverage. The Triton ROV was deployed in some
recommendations made by the Drift Group in [8]. of these.
US Navy/Phoenix International. The US We attributed a detection probability of 0.90 to the
Navy/Phoenix International search was performed using areas shown in grey in Figure 12 with the exception of the
the USN ORION towed side-scan sonar system which areas noted where we set the detection probability to 0.10.
covered the 1900 square kilometer area of orange swaths
shown in Figure 12. The ORION was operated to cover a
4.6 Posterior After Phase III Searches
2400 meter swath. Adjacent lines were spaced no greater Figure 13 shows the posterior PDF after the
than 2000 meters apart. All records were monitored in unsuccessful searches from Phases I, II, and III.
real time. During turns between track lines, the data were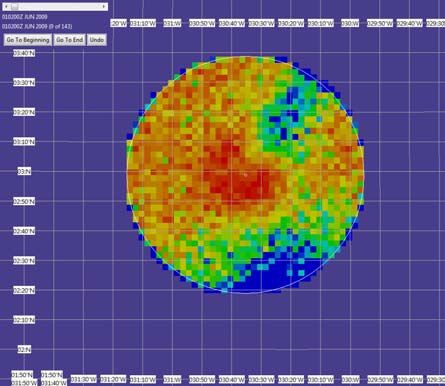
weighted scenario approach allowed inconsistent
                                                               information to be combined with subjective weights that
                                                               capture the confidence in each piece of data. The analysis
                                                               of the detection effectiveness of each component of the
                                                               search which produced the Bayesian posterior
                                                               distributions shown in Figures 13 and 14 formed a solid
                                                               basis for planning the next increment of search. In fact
                                                               the phase IV search commenced in the center of the
                                                               distribution and quickly found the wreckage.
                                                                  The success of this effort provides a powerful
                                                               illustration of the value of this methodical, Bayesian
                                                               approach to search planning. The full report [11] of this
                                                               work is available on the BEA website.

                                                               References
   Figure 13: Posterior PDF after Phase III: CDP = 0.58
                                                               [1] Henry R. Richardson and L. D. Stone, Operations
Posterior Assuming Pingers Failed. If both pingers             Analysis During the Underwater Search for Scorpion,
failed to activate, the ULB search would have had no           Naval Research Logistics Quarterly Vol 18 June 1971.
chance of detecting the wreckage. If this were the case we
would remove the ULB search in computing the posterior.        [2] Lawrence D. Stone, Search for the SS Central
The result of doing this is shown in Figure 14 below.          America: Mathematical Treasure Hunting Interfaces Vol
                                                               22: January – February 1992.
                                                               [3] Colleen M. Keller and M. A. Anderson, Applying
          Location of wreckage
                                                               Optimal Search Theory to Inland SAR: Steve Fossett Case
                                                               Study, October 2008.
                                                               [4] U. S. Coast Guard Addendum to the United States
                                                               National Search and Rescue Supplement to the IAMSAR
                                                               Manual, (COMDTINST M16130.2E) September 2009.
                                                               [5] Interim Report n°2 on the accident on 1st June 2009
                                                               to Airbus A330-203 registered F-GZCP operated by Air
                                                               France, flight AF 447 Rio de Janeiro – Paris by Bureau
                                                               d’Enquêtes et d’Analyses, 17 December 2009 (see
                                                               http://www.bea.aero/en/enquetes/flight.af.447/flight.af.447.php)
                                                               [6] AF447 Flight Path Analysis, BEA briefing, July 27,
                                                               2010
Figure 14. Posterior Assuming Pingers Failed: CDP = 0.29
                                                               [7] Presentation MAK AF447 Briefing,                    Russian
5    Conclusions                                               Interstate Aviation Group, 16 October 2009

  The posterior PDFs in Figures 13 and 14 provided good        [8] Estimating the Wreckage Location of the Rio-Paris
guidance for the phase IV search [10]. The wreckage is         AF447, Report from Drift Group to BEA, June 30, 2010
located in an area thoroughly covered by the TPL passive       [9] Ø. Breivik, A. Allen, C. Maisondieu, and J-C Roth
acoustic search (see Figure 8) which suggests the locator      Wind-induced drift of objects at sea: The leeway field
beacons were not functioning properly. Figure 14 shows         method Applied Ocean Research 2011 doi:
the wreckage is located in a high probability area             10.1016/j.apor.2011.01.005.
assuming the ULBs failed to operate properly. These
results suggest is likely that either both ULBs failed or      [10] Troadec,Jean-Paul. Undersea search operations to
failed to be detected for some reason, and that this failure   find the wreckage of the A 330, flight AF 447: the
resulted in a long and difficult search for the wreckage.      culmination of extensive searches. Note from BEA
The BEA began recovery operations in April 2011. One           Director, 8 April 2011, on the BEA website at
of the goals is to recover the ULBs to determine if they       http://www.bea.aero/en/enquetes/flight.af.447/note.from.bea.dire
were functioning during the 30 day period after the crash.     ctor.end.phase4.pdf
  Methodology.        Our approach used careful and            [11] Lawrence D. Stone, C M. Keller, T. M. Kratzke, and
methodical consideration of all data available, with           J. P. Strumpfer, Search Analysis for the Location of the
associated uncertainties, to form an analytic assessment of    AF447 Underwater Wreckage Report to BEA, 20 January
the highest likelihood areas for future search efforts. The    2011.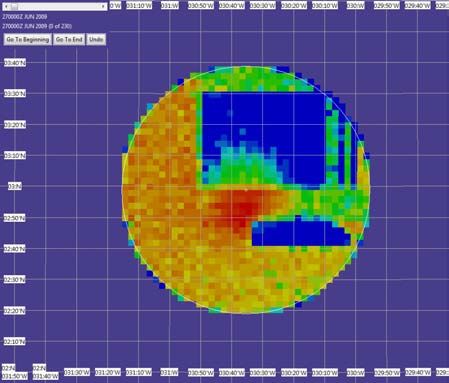
You can also read