Slipstream Deformation of a Propeller-Wing Combination Applied for Convertible UAVs in Hover Condition - IMAVS.ORG
←
→
Page content transcription
If your browser does not render page correctly, please read the page content below
IMAV2019-13 11th I NTERNATIONAL M ICRO A IR V EHICLE C OMPETITION AND C ONFERENCE
Slipstream Deformation of a Propeller-Wing
Combination Applied for Convertible UAVs in Hover
Condition
Y. Leng∗, M. Bronz, T. Jardin and J-M. Moschetta
ISAE-SUPAERO, Université de Toulouse, France
ENAC, Université de Toulouse, France
A BSTRACT up new type of missions. Rotor lifting system is inefficient
for long-endurance flight, and thus mission range is limited.
Convertible unmanned aerial vehicle (UAV) On the other hand, most current fixed-wing UAVs rely on
promises a good balance between convenient crew and sometimes specific systems for launch and recovery,
autonomous launch/recovery and efficient long which limits the origin and destination to dedicated points
range cruise performance. Successful design of where the aircraft can be accommodated by ground crew. To
this new type of aircraft relies heavily on good perform a fully autonomous long-range mission, a hybrid de-
understanding of powered lift generated through sign called convertible drone is needed.
propeller-wing interactions, where the velocity
distribution within propeller slipstream is criti-
cal to estimate aerodynamic forces during hover
condition. Current study analysed a propeller-
wing combination with a plain flap. A 5-hole
probe measurement system was built to construct
3 dimensional velocity field at a survey plane af-
ter trailing edge. The study has found that sig-
nificant deformation of propeller slipstream was
present in the form of opposite transverse dis-
placement on extrados and intrados. The defor-
mation could be enhanced by flap deflections.
Velocity differences caused by the slipstream de- (a) Combination of quad-copter and flying wing [1]
formation could imply local variation of lift dis-
tribution compared to predictions from conven-
tional assumptions of cylindrical slipstream. The
research underlined that the mutual aspect of
propeller-wing interaction could be critical for
low-speed aerodynamic design.
1 I NTRODUCTION
Small-scale unmanned aerial vehicle has recently at-
tracted great amount of interests due to their autonomous ca-
pability to conduct highly repetitive or dangerous flight mis-
sions. This capability is realised through electrical propulsion
system and improved autoflight system. The current UAV lift-
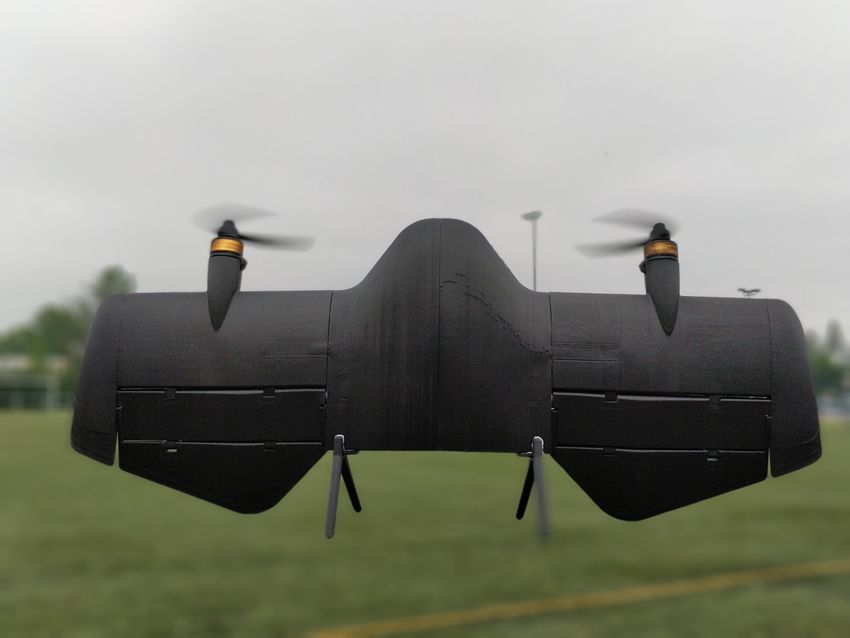
(b) Darko developped by ENAC drone research group
ing systems are generally derived by down-scaling manned
aircraft. The clear division of rotorcraft and fixed-wing air- Figure 1: Examples of convertible drone configurations
craft can still be seen in most professional UAV applications.
It has been seen however that a hybrid design that com-
bines the vertical take-off / landing capability and the ef- The key to an optimised design of convertible drone lies
ficiency of fixed-wing aircraft could improve mission per- in the interaction between propulsion system and the lifting
formance of current UAV applications and eventually open surfaces. An entirely independent design, such as shown in
Figure 1a requires lifting propellers that aren’t used in cruise
∗ Email address(es): yuchen.leng@isae-supaero.fr flight, hence additional weight and drag are introduced. A
S EPTEMBER 29th TO O CTOBER 4th 2019, M ADRID , S PAIN 95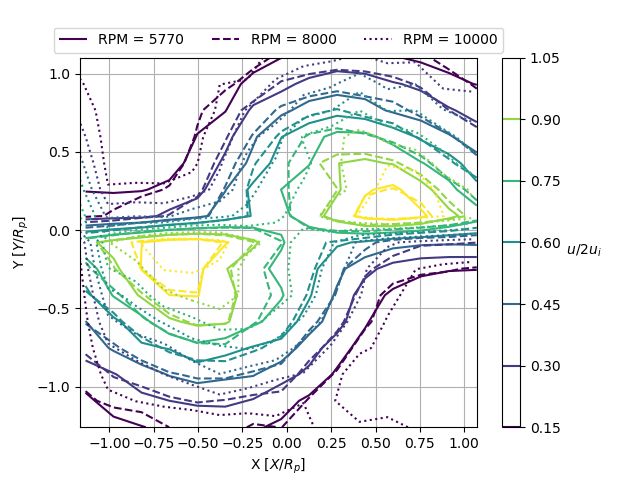
IMAV2019-13                                  11th I NTERNATIONAL M ICRO A IR V EHICLE C OMPETITION AND C ONFERENCE

fully hybrid approach (Figure 1b) takes advantage of arrang-        is solved, and induced velocity from the lifting surfaces is
ing lifting surfaces within propeller slipstream for augmented      added to flight speed for propeller calculation. Ideally, an it-
lift from blown wing. In this way the propeller and wing are        erative approach is used until both solutions converge.
both used during hover and cruise flight, and their sizes must           Both analysis modes require an empirical coefficient to at-
match to deliver the required aerodynamic performance while         tenuate propeller induced velocity before application in wing
minimizing the weight of combined system.                           calculation [3, 4]. This suggests propeller induced velocity
     Unlike an independent design, the hover lift is distributed    distribution might have changed due to the presence of wing.
between the vertical component of propeller thrust and wing         The effect was treated semi-empirically in [3], but a clear
lift augmented by rotor slipstream. Thus flow interference          physical understanding is still absent.
between the wing and slipstream must be well understood to               Recent studies on tractor propeller wake measurements
ensure sufficient lift in hover.                                    have found that the influence of wing to the propeller isn’t
     To further augment wing lift and to provide flight con-        limited to the flow upstream of the rotor disk. Deters et al [5]
trol, trailing edge flap is typically installed, such as shown in   have used a seven-hole probe to make wake survey at differ-
Figure 2. Propeller slipstream can therefore be deflected at        ent downstream locations after three different propellers. A
a certain angle to generate additional aerodynamic force and        flat plate wing is situated close to the propeller. The presence
moment. Sufficient pitch and roll control authority can be          of wing is significant that the upper and lower halves of the
achieved with appropriate flap design.                              slipstream translated in opposite direction by a distance up
                                                                    to 1 propeller radius at survey plane. The phenomenon was
                                                                    first observed and analysed by Witkowski et.al [6]. However
                                                                    neither studies provided quantitative analysis.
                                                                         In this paper, a wake survey in static condition is pre-
                                                                    sented at different rotation speeds and flap deflection angles.
                                                                    The test equipment and condition will be introduced in Sec-
                                                                    tion 2. Results and quantitative analysis will be shown in
                                                                    Section 3.
                                                                         The test was also performed with flap deflection to inves-
                                                                    tigate the slipstream development when the wing was gener-
                                                                    ating lift.

                                                                                           2   T EST SET- UP
                                                                    2.1   Test equipments
                                                                        The test was conducted in the indoor flight arena at Ecole
Figure 2: Convertible UAV Cyclone hovering with negative            National de l’Aviation Civile (ENAC). The flight arena’s
flap deflection                                                     volume provides static ambient environment for simulating
                                                                    hover condition.
     During preliminary design, reduced-order models such as            The test equipments were divided into three subsystems :
panel method, vortex lattice method, to name a few, are pre-        1) propeller-wing combination and their relevant motion con-
ferred due to their capability of analysing large amount of         trol system ; 2) 5-hole probe and its data acquisition system ;
candidate configurations at a relatively small computational        3) motion control system for 5-hole probe. The test setup in
cost [2]. Veldhuis et al. has identified two approaches in          shown in Figure 3.
analysing propeller-wing systems : single approach and dual-
coupling approach.
     In single analysis mode, only the influence of propeller
slipstream is taken into consideration. When calculating wing                                           Motion control system
lift for sections immersed in propeller slipstream, the accel-             Tractor Propeller
erated freestream velocity and sometimes the circumferential
                                                                                                                   Aeroprobe
swirl velocity are applied to calculate local angle of attack
and dynamic pressure. The velocities in the slipstream are
computed from a free propeller model, such as one based on                Semi-span Wing
blade element momentum theory.
     A dual-coupling mode is sometimes used to improve ac-
curacy. The same calculation on wing sections still applies.
A main difference is that the freestream condition of the pro-
peller is also modified after the wing circulation distribution            Figure 3: Test set-up in ENAC indoor flight arena

   S EPTEMBER 29th TO O CTOBER 4th 2019, M ADRID , S PAIN                                                                      96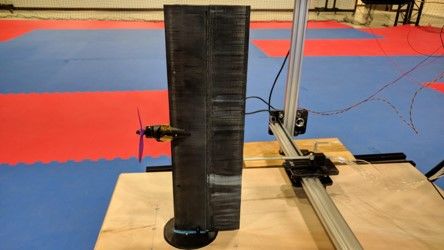
IMAV2019-13                                  11th I NTERNATIONAL M ICRO A IR V EHICLE C OMPETITION AND C ONFERENCE

2.1.1   Propeller-wing model

The wing tested was a semi-span model with 500mm span.
The straight wing had a constant chord length of 150mm and
NACA0012 aerofoil section. A propeller nacelle was situated
at 55mm from plane of symmetry, where a CM2206 direct
current brushless motor was enclosed. A full-span plain flap
was installed for the last 50% chord, and a servo allowed sym-
metrical flap deflection of 15◦ in either direction.
    An APC 3-blade 5x4.6E propeller was tested. A tilt-rotor
mechanism was designed to allow propeller install angle to
change between −10◦ to 10◦ with respect to wing chord line.
The tilt mechanism was fixed at 0◦ for this experiment.
                                                                                Figure 5: Flow speed measurement
2.1.2   5-hole probe

The wake survey was conducted with an Aeroprobe 5-hole             measurement and its uncertainty is plotted in figure 4; flow
probe. The centre of probe head was located at 15mm behind         speed measurement and its uncertainty is plotted in figure 5.
trailing edge or 1.7 times propeller diameters downstream of           From the validation case, uncertainty in flow speed was
rotor plane.                                                       estimated at ±0.3m/s and error in flow angle was estimated
                                                                   to be less than 2◦ below 20◦ .
     At the centre sphere, five holes were arranged in a cross
pattern with one in the centre, a pair in vertical plane and an-
other pair perpendicularly arranged. A series of static ports      2.1.3   Motion control system
were situated after the probe head. When air is blown, the ve-     A 2-axis linear motion frame was constructed to allow auto-
locity, pitch and yaw attitude of probe will produce pressure      matic wake survey at a given plane perpendicular to propeller
difference between centre hole and static ports, vertical pair     axis. Three stepper motors controlled by I2C bus were used
and side pair holes.                                               to move a cart on which the 5-hole probe was mounted within
     Honeywell analogue differential pressure sensors were         the survey plane. The measurement was made on a 15 × 15
used to measure the three pairs of pressure differences which      grid using alternating survey pattern as depicted in figure 6.
were needed to resolve flow velocity. A calibration method         Mean velocity data was obtained from sample recorded at
proposed by Reichert et al [7] were used to take into consid-      700Hz over a period of 5s.
eration of cross-product terms and to correct alignment errors.

                                                                         Figure 6: Motion control system and survey pattern

                                                                   2.2   Test conditions
             Figure 4: Flow angle measurement                          All tests were conducted at V∞ = 0 to analyse flow con-
                                                                   dition at hover flight. Different propeller rotation speed and
    The calibration were also analysed for measurement er-         flap angle were tested, and the test matrix is given in Table 1
ror. An uncertainty analysis were performed similar to the             The rotation of propeller in front of a finite wing made
one described by Reichert et al, and fitting error as well as      the situation no longer symmetrical. Since lift must vanish
pressure fluctuations were considered in uncertainty propa-        at wing tip, spanwise lift distribution isn’t uniform for a fi-
gation. A validation test were performed in the wind tunnel        nite wing without propeller. Furthermore, an up-going pro-
with known wind velocity and probe attitude. Flow angle            peller blade influences the wing section behind in a different

   S EPTEMBER 29th TO O CTOBER 4th 2019, M ADRID , S PAIN                                                                     97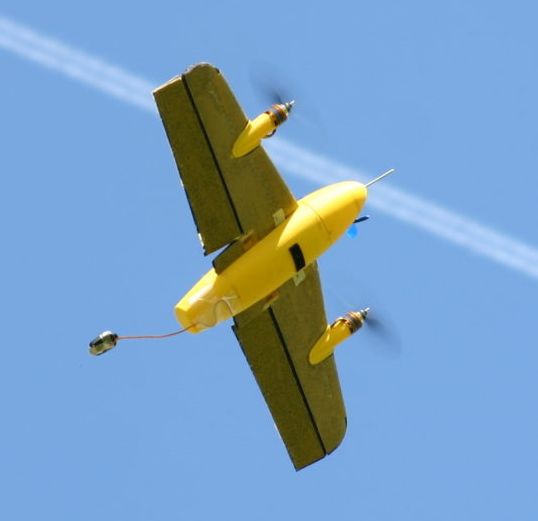
IMAV2019-13                                    11th I NTERNATIONAL M ICRO A IR V EHICLE C OMPETITION AND C ONFERENCE

          Test Variables                                              Within the slipstream, both u and Vt are noticeably higher
          Rotation Speed [rpm]      5770 / 8000 / 10000               in magnitude than the surrounding flow region. The increase
          Flap Deflection [◦ ]            0, ±15                      in axial velocity is expected as the propeller produces forward
                                                                      thrust by accelerating air in downstream direction. The trans-
                   Table 1: Test Parameters                           verse velocity is caused by the air resistance against blade
                                                                      rotation. Transverse velocity contains both induced velocity
                                                                      and viscous effect, and is commonly referred to as swirl in
                                                                      rotary wing terminology.
way from the down-going blade, hence the influence of a sin-
                                                                           According to momentum theory [8], the induced axial ve-
gle rotating propeller isn’t symmetrical. For this reason, both
                                                                      locity at propeller disk can be related to thrust coefficient.
positive and negative flap deflections were tested.
                                                                                                        r
                         3    R ESULTS                                                                     2CT
                                                                                              ui = nD                                (1)
    In this section the results of 0◦ flap deflection will first be                                         π
presented in subsection 3.1, where the effect of rotation speed       where n is rotation speed in revolution per second and D is
as well as the general flow structure of propeller-wing inter-        propeller diameter. Thrust coefficient is defined as CT =
                                                                      ρn2 D 4 , and was obtained as tabulated data from propeller
                                                                         T
ference will be discussed. Further discussion will continue in
subsection 3.2 on the effect of flap deflection.                      manufacturer at different rotation speeds [9]. After the ro-
3.1   0◦ Flap Deflection                                              tor plane, contraction of slipstream accelerates flow towards
                                                                      twice of ui at downstream infinity. The flow survey is non-
    The configuration at neutral flap setting excluded the ef-
                                                                      dimensionalised using the induced axial velocity at ultimate
fect of different velocity and pressure profiles on the extrados
                                                                      wake. The benefit of such normalisation is to remove the ef-
and intrados. The wake survey therefore was only influenced
                                                                      fects of thrust loading and rotational speed.
by the fact that propeller slipstream was separated by a solid
                                                                           A circle in dashed line represents the undisturbed slip-
surface.
                                                                      stream boundary obtained from vortex theory from Mc-
    The wake survey at 8000rpm is presented in Figure 7.
                                                                      Cormick [10], where
The velocity field distribution in the survey plane is depicted                                  q
as two components : the streamwise component u is per-                                                         p
                                                                                    R (z̄) = Rp 1 + z̄ 2 − z̄ 1 + z̄ 2               (2)
pendicular
       √ to the survey plane and the transverse component
Vt = v 2 + w2 is situated within the survey plane. In Fig-            where z̄ is the distance from propeller plane normalized by
ure 7, the background contour shows u distribution while the          Rp and z̄ is negative downstream. Through comparison with
transverse Vt is superposed by arrow symbols that give both           the actual high-speed regions, a distinct separation of flow
magnitude and direction of Vt at sample points.                       structures between the extrados and intrados can be observed.

Figure 7: Velocity distribution at survey plane for symmetri-         Figure 8: Comparison of axial velocity distribution at differ-
cal configuration at 8000rpm                                          ent rotation speeds

    Above and below the wing, propeller slipstream can be                 While increases in ui and Vt can be reasonably explained
identified as a semi-circular region of high energy airflow.          by free propeller theory, movement of the two slipstream re-

      S EPTEMBER 29th TO O CTOBER 4th 2019, M ADRID , S PAIN                                                                       98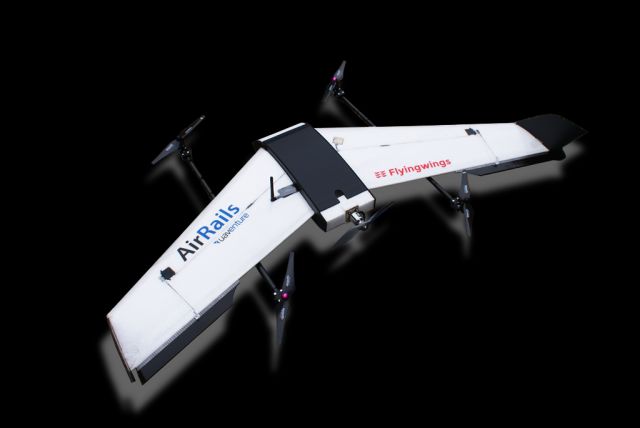
IMAV2019-13 11th I NTERNATIONAL M ICRO A IR V EHICLE C OMPETITION AND C ONFERENCE
gions can’t be similarly explained. For a single propeller, the From turbulent jet theory, it can be concluded that the
slipstream will stay together as in an approximate cylindrical axial velocity profile of a round jet surrounded by static air
shape. But when a wing is present, as seen in Figure 7, the up- can be approximated by Gaussian function. The jet bound-
per slipstream exhibited a general displacement towards the ary corresponds to where the extrema of shear stress exists.
right (outboard) while the lower slipstream region moves op- If streamwise partial derivatives ( ∂x
∂
) are assumed to be small
positely towards the left (inboard). The directions of move- compared to cross flow derivatives, the cross-flow shear stress
ment is associated with the direction of propeller, where in can therefore be determined.
the test case, the inboard blade was turning upward relative to
the wing chord.
∂u
Axial velocity contours of cases from three different ro- τxy = µ (3)
tation speeds are plotted in Figure 8, where the solid line de- ∂y
picts u distribution at 5770rpm, dashed line represents the ∂u
τxz =µ (4)
one at 8000rpm and dotted line is for 10000rpm. ∂z
Plotted in non-dimensional form, the contour lines of The wake boundary was then determined to be the locus
three different cases generally overlap for most flow region. of maximum transverse shear stress, drawing analogy from
Major differences lie close to the axial velocity peaks at in- conclusions of turbulent jet theory.
trados and extrados. The general agreement of flow topol-
q
ogy suggests that at hover condition, the wake development (y, z) : max τxy 2 + τ2 (5)
xz
is scalable with thrust loading and blade rotation. The vertical extrema of the slipstream boundary were
A quantifiable measurement is made by determining the chosen as the radius of contracted wake Rw . The angular and
centres of extrados and intrados slipstreams. Due to the pres- radial position of the closest points of slipstream boundary to
ence of wing wake, the slipstream centre cannot be easily de- rotational axis were determined as R1 and θ1 . From geometry
fined. An indirect method was used to determine slipstream relations, the slipstream centre can then be determined.
centre through shear stress at the boundary.
q
yc = Rw 2 − (R sin θ )2 + R cos θ (6)
1 1 1 1
The displacement of slipstream centre from propeller axis
Rw
can therefore be found, and the results for three test cases can
θ1 be found in Table 2.
R1
yc RP M CT yc /R Theoretical yc /R Error
5770 0.1907 0.4290 0.4252 0.9%
8000 0.1908 0.4086 0.4253 3.9%
10000 0.1906 0.4017 0.4252 5.5%
Figure 9: Geometry relations to determine slipstream centre Table 2: Centreline displacement at different rotation speeds
0,
z̄LE ≤ z̄
2
(tan φ − sec φ) (z̄ − z̄LE ) z̄T E ≤ z̄,
π √ !
√ p 2
2 2 z̄ LE 1 − 1 + z̄
− sec φ 1 + z̄ 2 − 1 + z̄LE + ln p , z̄ < z̄LE
π z̄ 1 − 1 + z̄LE2
ȳc (z̄) = (7)
2
(tan φ − sec φ) (z̄T E − z̄LE )
π p !
2 p p z̄LE 1 − 1 + z̄T2 E
2 2
− sec φ 1 + z̄T E − 1 + z̄LE + ln p z̄ < z̄T E
π z̄T E 1 − 1 + z̄LE 2
2 z̄ − z̄T E
+ tan φ (z̄ − z̄LE ) − p sec φ ,
π z̄
TE 1 + z̄ 2 − z̄ 2
TE TE
S EPTEMBER 29th TO O CTOBER 4th 2019, M ADRID , S PAIN 99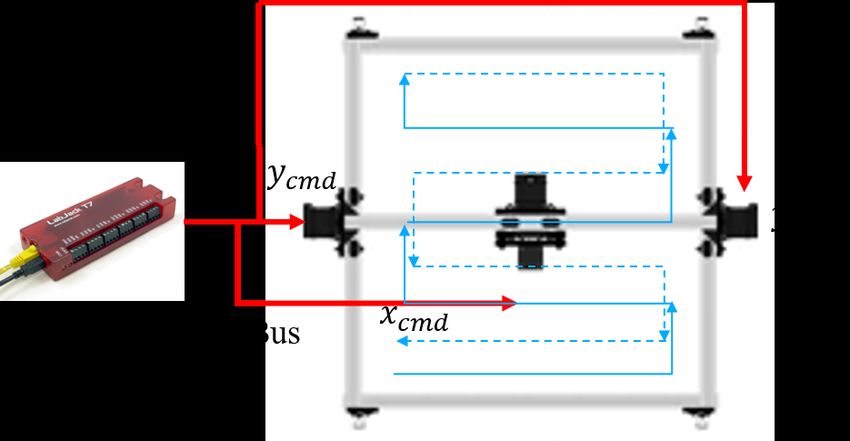
IMAV2019-13                                   11th I NTERNATIONAL M ICRO A IR V EHICLE C OMPETITION AND C ONFERENCE

    From Table 2 it can be concluded that the three cases                Results obtained at 8000rpm are included and discussed
have nearly identical wake displacement. A theoretical re-           in this section, while the other results are included in ap-
sult was also calculated for each case. This value is based on       pendix for simplicity. The effects discussed in this section
a potential flow method considering the mean chord surface           are similar at a different tested rotation speed.
as an imaginary plane, and thus a transverse velocity is in-             Figure 11 demonstrated the wake survey in a similar fash-
duced from streamwise vortices in propeller slipstream, such         ion as in Figure 7. The dashed line represents the flap trailing
idea was first introduced in [6] qualitatively and a quantitative    edge location when deflected. High speed region can still be
model has been proposed by Leng et al [11].                          observed in the velocity field, but the distribution took a dif-
    The resulting model for centreline displacement ȳc =            ferent shape because of the deflection of flap. Besides the
yc /R is a function of downstream location z̄ = z/R, with            transverse displacement in left and right directions, the slip-
blade tip vortex shedding angle φ as a parameter. The centre-        stream profiles also differ from each other in their vertical
line displacement is given in equation 7 at static condition.        expansion. On the extrados, the slipstream was displaced to-
    Angle φ can be calculated from momentum theory using             wards the right and took a slightly narrower width. While
thrust coefficient, and z̄LE , z̄T E are leading edge and trailing   the highest point of extrados slipstream stayed close to 1 pro-
edge locations divided by propeller radius with origin at rotor      peller radius, the region spread lower and generally followed
centre and negative direction pointing downstream.                   the deflected trailing edge flap. The extended vertical expan-
                                                                     sion is consistent with the reduced lateral width, since flow
                                                                     continuity must be satisfied.

Figure 10: Velocity distribution at survey plane for sym-
metrical configuration at 8000rpm, with displaced slipstream
boundary
                                                                     Figure 11: Velocity distribution at survey plane for with 15◦
    In Figure 10, slipstream boundary from momentum the-             flap deflection at 8000rpm
ory was displaced by the predicted amount from Table 2. The
deformed boundary appeared to include both high-speed flow
regions at extrados and intrados. The results confirm that at            The intrados slipstream was wider and flatter compared
static condition, displaced centreline can be accurately calcu-      to the extrados slipstream and Figure 7. The combined effect
lated using the theoretical model. The results seem to affirm        produced a distinct velocity difference for the wing section
that the presence of wing serves as an imaginary plane for           after up-going blade (inboard section), while such difference
slipstream vortex system, and its induced transverse velocity        was more subtle on the other side. The non-uniform velocity
component explains centreline displacement.                          distribution could imply significant local lift variation in the
3.2   Effect of Flap Deflection                                      surveyed section.
    In subsection 3.1 the slipstream development in 0◦ flap              Wake survey for negative flap deflection is depicted in
deflection configuration was presented and analysed. In this         Figure 12. The velocity distribution is generally axial sym-
condition the wing wasn’t lifting, and thus the transverse slip-     metric of Figure 11. However the vertical extent of the intra-
stream displacement was purely caused by the presence of             dos slipstream is slightly larger than the extrados slipstream
solid surface between the extrados and intrados parts of slip-       in positive flap deflection. In Figure 12, the wake boundary
stream.                                                              of intrados slipstream is shown lower than 1 propeller radius.

      S EPTEMBER 29th TO O CTOBER 4th 2019, M ADRID , S PAIN                                                                   100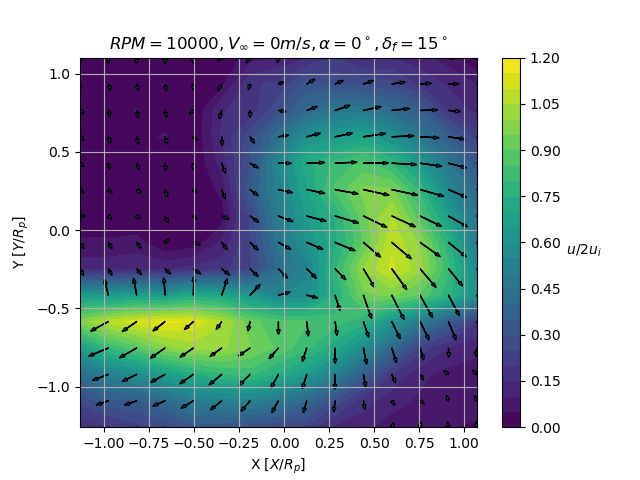
IMAV2019-13                                  11th I NTERNATIONAL M ICRO A IR V EHICLE C OMPETITION AND C ONFERENCE

                                                                    [2] LLM Veldhuis. Review of propeller-wing aerodynamic
                                                                        interference. In 24th International Congress of the
                                                                        Aeronautical Sciences, volume 6, 2004.
                                                                    [3] Gavin Kumar Ananda Krishnan, Robert W Deters, and
                                                                        Michael S Selig. Propeller-induced flow effects on
                                                                        wings of varying aspect ratio at low reynolds numbers.
                                                                        In 32nd AIAA Applied Aerodynamics Conference, page
                                                                        2152, 2014.
                                                                    [4] Kitso Epema. Wing Optimisation for Tractor Propeller
                                                                        Configurations: Validation and Application of Low-
                                                                        Order Numerical Models Adapted to Include Propeller-
                                                                        Induced Velocities. Master’s thesis, Delft University of
                                                                        Technology, Delft, Netherlands, 2017.
                                                                    [5] Robert W Deters, Gavin K Ananda, and Michael S
                                                                        Selig. Slipstream measurements of small-scale pro-
Figure 12: Velocity distribution at survey plane for with −15◦          pellers at low reynolds numbers. In 33rd AIAA Applied
flap deflection at 8000rpm                                              Aerodynamics Conference, page 2265, 2015.
                                                                    [6] Dave P Witkowski, Alex KH Lee, and John P Sullivan.
                                                                        Aerodynamic interaction between propellers and wings.
                      4    C ONCLUSION
                                                                        Journal of Aircraft, 26(9):829–836, 1989.
     In this paper, a wake survey was presented immediately
after a propeller-wing combination to investigate the flow in-      [7] Bruce A. Reichert, Bruce J. Wendt, and United States. A
teraction for a convertible UAV under hover condition. A                new algorithm for five-hole probe calibration, data re-
symmetric wing profile was tested in ENAC indoor flight                 duction, and uncertainty analysis. National Aeronautics
arena at calm wind condition. Velocity magnitude and direc-             and Space Administration ; National Technical Infor-
tion were measured by a 5-hole probe at a plane perpendicular           mation Service, distributor [Washington, DC] : [Spring-
to streamwise direction and downstream of trailing edge. The            field, Va, 1994.
test was conducted with zero flap deflection, as well as with       [8] Gordon J Leishman. Principles of helicopter aerody-
flap deflection of 15◦ in either direction.                             namics with CD extra. Cambridge university press,
     The results demonstrated that the presence of wing influ-          2006.
ences velocity distribution within propeller slipstream com-
pared to a free propeller. In the experiment, the upper half        [9] Apc propeller performance data. https://www.
slipstream was observed to translate towards outboard while             apcprop.com/technical-information/
the lower half slipstream translates towards inboard. The re-           performance-data/, [Online; accessed 21-May-
sults contrast with most reduced-order model of propeller-              2019].
wing interaction where propeller wake was assumed to keep
                                                                   [10] B.W. McCormick. Aerodynamics, Aeronautics, and
its cylindrical shape.
                                                                        Flight Mechanics. Wiley, 1994.
     Comparison with a theoretical model suggests that wing
influence on propeller slipstream velocity distribution can be     [11] Yuchen Leng, Murat Bronz, Thierry Jardin, and Jean-
accurately modelled using method of reflection on slipstream            Marc Moschetta. Comparisons of different propeller
streamwise vorticity.                                                   wake models for a propeller-wing combination. In 8th
     The influence of wing on velocity distribution within slip-        European Conference for Aeronautics and Space Sci-
stream was observed to be different between upper and lower             ences, 2019.
surfaces when flap deflection was present, with the deforma-
tion being stronger on the wing surface opposite to flap de-
flection.

                          R EFERENCES
 [1] Quadplane. http://uaventure.com/fcs/, [On-
     line; accessed 31-July-2019].

   S EPTEMBER 29th TO O CTOBER 4th 2019, M ADRID , S PAIN                                                                 101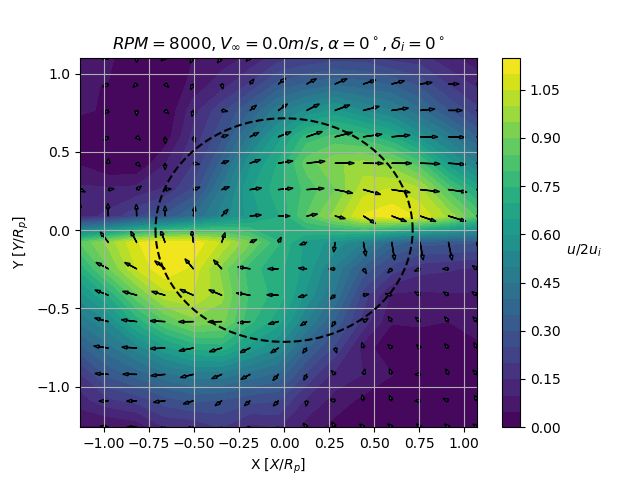
IMAV2019-13 11th I NTERNATIONAL M ICRO A IR V EHICLE C OMPETITION AND C ONFERENCE
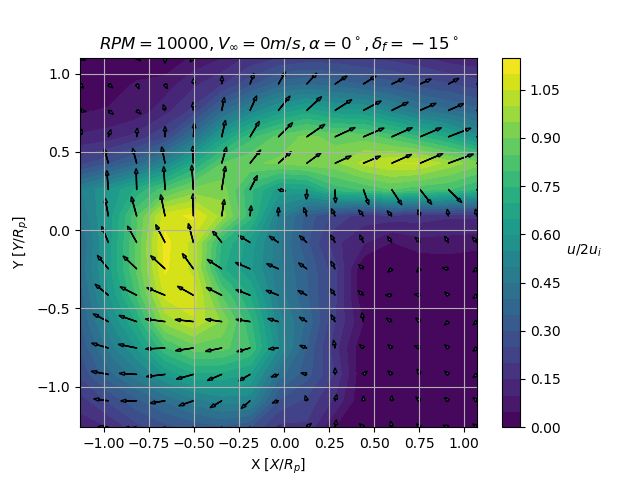
A PPENDIX A: WAKE S URVEYS WITH F LAP
Wake surveys with ±15◦ flap deflections are depicted in
Wake surveys with ±15◦ flap deflections are depicted in Figure 14a and Figure 14b for propeller rotation speed at
Figure 13a and Figure 13b for propeller rotation speed at 10000rpm.
5770rpm.
(a) −15◦ flap deflection (a) −15◦ flap deflection
(b) 15◦ flap deflection (b) 15◦ flap deflection
Figure 13: Velocity distribution at survey plane for with flap Figure 14: Velocity distribution at survey plane for with flap
deflections at 5770rpm deflections at 10000rpm
S EPTEMBER 29th TO O CTOBER 4th 2019, M ADRID , S PAIN 102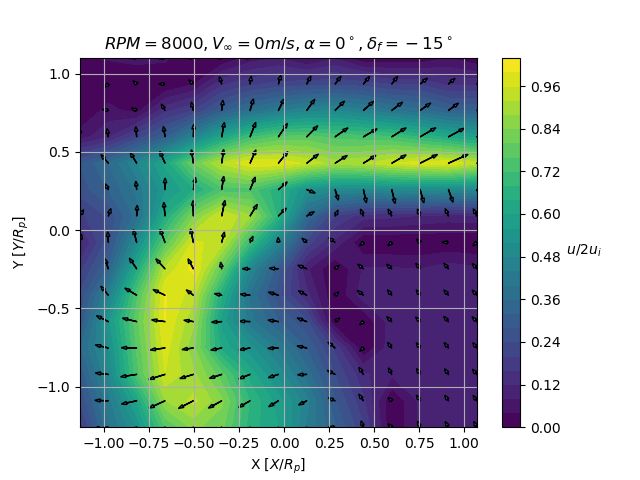
You can also read