ROAD TYPE CLASSIFICATION OF MLS POINT CLOUDS USING DEEP LEARNING
←
→
Page content transcription
If your browser does not render page correctly, please read the page content below
The International Archives of the Photogrammetry, Remote Sensing and Spatial Information Sciences, Volume XLIII-B2-2021
                                                  XXIV ISPRS Congress (2021 edition)

    ROAD TYPE CLASSIFICATION OF MLS POINT CLOUDS USING DEEP LEARNING

                                      Q. Bai1, 2 ∗, R. C. Lindenbergh1 , J. Vijverberg2 , J. A. P. Guelen2
                     1
                         Dept. of Geoscience and Remote Sensing, Delft University of Technology, The Netherlands
                                          - (q.bai@student.tudelft.nl, r.c.lindenbergh@tudelft.nl)
                                2
                                  Cyclomedia Technology - (QBai, JVijverberg, JGuelen)@cyclomedia.com

                                                         Commission II, WG II/3

KEY WORDS: Mobile mapping, point clouds, semantic segmentation, road type, local feature aggregation, deep learning.

ABSTRACT:

Functional classification of the road is important to the construction of sustainable transport systems and proper design of facilities.
Mobile laser scanning (MLS) point clouds provide accurate and dense 3D measurements of road scenes, while their massive data
volume and lack of structure also bring difficulties in processing. 3D point cloud understanding through deep neural networks
achieves breakthroughs since PointNet and arouses wide attention in recent years. In this paper, we study the automatic road type
classification of MLS point clouds by employing a point-wise neural network, RandLA-Net, which is designed for consuming
large-scale point clouds. An effective local feature aggregation (LFA) module in RandLA-Net preserves the local geometry in point
clouds by formulating an enhanced geometric feature vector and learning different point weights in a local neighborhood. Based on
this method, we also investigate possible feature combinations to calculate neighboring weights. We train on a colorized point cloud
from the city of Hannover, Germany, and classify road points into 7 classes that reveal detailed functions, i.e., sidewalk, cycling
path, rail track, parking area, motorway, green area, and island without traffic. Also, three feature combinations inside the LFA
module are examined, including the geometric feature vector only, the geometric feature vector combined with additional features
(e.g., color), and the geometric feature vector combined with local differences of additional features. We achieve the best overall
accuracy (86.23%) and mean IoU (69.41%) by adopting the second and third combinations respectively, with additional features
including Red, Green, Blue, and intensity. The evaluation results demonstrate the effectiveness of our method, but we also observe
that different road types benefit the most from different feature settings.

                         1. INTRODUCTION                                  works can directly consume and model 3D point data. Point-
                                                                          Net (Qi et al., 2017a), the pioneering work among these meth-
Automation of road information extraction is of great signific-           ods, employs a series of shared multi-layer perceptrons (MLP)
ance to economic and social development. Road type, which                 to learn higher-dimensional features for each point. Then these
indicates the function of a road segment, is key to various ap-           per-point features are aggregated by applying a symmetric func-
plications, including autonomous driving, inspections of in-              tion (e.g., max-pooling), ensuring that point cloud processing
frastructures, and decision making of companies and govern-               is irrelevant to the point order. However, PointNet does not
ments (Zhu et al., 2012). LiDAR provides accurate 3D point                consider local structures inside the point cloud, limiting its per-
measurements and is illumination invariant, showing a strong              formance in complex scenes (Qi et al., 2017b). Starting from
ability for mapping. Similar to image recognition, point cloud            PointNet, many networks are proposed combining MLPs with
processing also benefits from the rapid development of deep               local feature aggregation. The local feature aggregation mod-
learning techniques (Liu et al., 2019). However, it is still chal-        ule aims to extract prominent features from a point neighbor-
lenging to interpret 3D point clouds using neural networks due            hood, thereby exploiting wider contextual information around
to their irregular data structure.                                        each point. The choice of input features for local aggregation
                                                                          has a great impact on its effectiveness. PointNet++ uses relat-
Determining the type of each road point is consistent with                ive coordinates in a local region together with additional point
the aim of point cloud semantic segmentation. Recent studies              features (e.g., R, G, B), while DGCNN (Wang et al., 2019) con-
on semantic segmentation of point clouds using deep learning              structs the concatenation of all original and relative features as
mainly consist of two kinds of methods, i.e., projection-based            input. RandLA-Net (Hu et al., 2020), which is adopted in this
and point-based methods. In projection-based methods, point               study, employs more complex encoding for relative coordin-
clouds are first projected onto 2D planes (i.e., images) (Wu et           ates to capture geometric details. The encoded geometric fea-
al., 2018) or converted into voxels (i.e., 3D grids) (Riegler et al.,     ture, together with additional point features, is then used to
2017). Through achieving a regularly aligned data format, 2D              achieve local feature aggregation. Different from PointNet++
or 3D convolutional neural networks (CNN) can be applied. Al-             and DGCNN, which use a symmetric function to aggregate in-
though these methods address the problem of unorganized point             put features indistinguishably, RandLA-Net represents local in-
clouds indirectly, some spatial information is lost and additional        formation as a weighted sum of all neighboring point features,
computational resources are needed during pre-processing.                 making the choice of input features even more crucial for cap-
                                                                          turing the local geometry.
As an active research topic in this area, point-based neural net-
                                                                          Some of the aforementioned methods have already verified their
∗   Corresponding author                                                  model performance on benchmark MLS point cloud datasets

                                                 This contribution has been peer-reviewed.
                  https://doi.org/10.5194/isprs-archives-XLIII-B2-2021-115-2021 | © Author(s) 2021. CC BY 4.0 License.                   115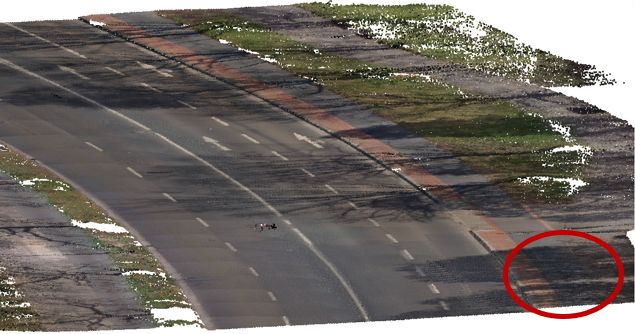
The International Archives of the Photogrammetry, Remote Sensing and Spatial Information Sciences, Volume XLIII-B2-2021
XXIV ISPRS Congress (2021 edition)
like SemanticKITTI (Behley et al., 2019). The labeling of these
datasets covers the whole road scene including road surface,
cars, buildings, etc. However, further research on detailed clas-
sification focusing on different road types is still needed. Some
studies also evaluate different input features of the local aggreg-
ation module (Widyaningrum et al., 2021). It turns out that one
fixed feature combination is not optimal for all datasets (Liu et
al., 2020). To find a proper setting for road type classification,
it is important to conduct more experiments.
The main contributions of this paper are:
• We achieve detailed road type classification in dense urban
areas by applying RandLA-Net.
• We assess how features should be combined to achieve
weights of neighboring points when aggregating local in-
formation in point clouds.
This paper is organized as follows: Section 2 illustrates the
Figure 1. Trajectory of the recording vehicle shown in purple,
dataset employed in this study. Section 3 describe the methodo-
with a length about 16 km. The base map is provided by
logy, including the data pre-processing procedure, details of the
© OpenStreetMap.
neural network, and adopted evaluation metrics. Experiment
results are discussed in Section 4. Finally, Section 5 presents
the drawn conclusions. (see Figure 2d). Also, points belonging to pedestrian area and
others have similar appearance as sidewalk. Considering that
they are detected with the help of other information like a road
2. DATASET AND STUDY AREA sign in practice, pedestrian area and others are merged into the
sidewalk to ease the training.(1)
The MLS point cloud used in this paper is acquired by Cyc-
lomedia’s proprietary recording system (Cyclomedia, 2021), in After pre-processing, the point cloud dataset used for our study
the city of Hannover, Germany. This system is mainly com- has a total number of 74,629,166 points, with 9 attributes, i.e.,
posed of 5 high-resolution cameras and a Velodyne HDL-32E x, y, z, R, G, B, intensity, return number, and number of returns.
LiDAR sensor (Velodyne, 2010). Figure 1 shows the trajectory Besides, the distribution of points in 7 road types is illustrated
of the recording vehicle, which is about 16 km in length. The in Table 1, in which a class imbalance issue can be observed.
original LiDAR point cloud has an average point spacing of 1 Motorway contains a dominant number of points. sidewalk and
cm and is colorized by panoramic images obtained at the same green area are also frequently seen in the data. By contrast, rail
time. track has the least amount of points. The MLS point cloud after
pre-processing is vertically split into 39 tiles, with 29 tiles for
Ground truth annotations of the MLS point cloud contain 9 road training and 10 for testing.
classes: sidewalk, cycling path, rail track, parking area, motor-
way, green area, island without traffic, pedestrian area (car-free sidewalk cycling path rail track parking area
zones) and others. The order of these classes also reveals the 17.27 3.22 0.54 3.92
priority of labeling. For example, if a motorway is crossing a motorway green area island without traffic
rail track in a point cloud, corresponding points will be labeled 32.68 14.12 2.88
as rail track.
Table 1. Number of points (·106 ) in each road type.
3. METHODOLOGY
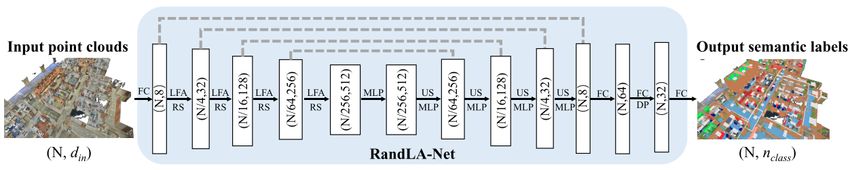
3.2 RandLA-Net
This study investigates the capability of a deep neural net-
We implement RandLA-Net (Hu et al., 2020) for road type clas-
work, i.e., RandLA-Net, for classifying 3D point clouds into
sification in this study. RandLA-Net is a point-wise neural net-
different road types and evaluates the performance of different
work and follows an encoder-decoder hierarchical design (see
feature combinations in the local feature aggregation module.
Figure 3). Given a point cloud with a large number of points,
Our methodology mainly includes data pre-processing, training
the points are progressively downsampled in each encoding
with RandLA-Net, and evaluation.
layer and upsampled again in decoding layers to preserve the
3.1 Data pre-processing original resolution in final predictions. To achieve processing
efficiency, random sampling is chosen as the downsampling
To handle the sheer volume of the acquired MLS point cloud, strategy. Since random sampling drops points non-selectively,
we first downsample it using grid sampling, with a grid size of each neural layer also contains an effective local feature ag-
0.1 m. Figure 2a presents an example of the colorized point gregation (LFA) module to summarize neighborhood informa-
cloud after downsampling. Afterwards, non-road points are tion without losing important point features. The LFA module
removed by a ground filtering approach (Isenburg, 2014), as
shown in Figure 2b. The label of each point is then achieved (1) When using (x, y, z, R, G, B) and the original feature combination in
through overlaying the ground truth annotations, which are the LFA module of RandLA-Net, the mean IoU is improved by 10.97%
polygons stored in the shapefile format, on the road point cloud after merging the labels.
This contribution has been peer-reviewed.
https://doi.org/10.5194/isprs-archives-XLIII-B2-2021-115-2021 | © Author(s) 2021. CC BY 4.0 License. 116
The International Archives of the Photogrammetry, Remote Sensing and Spatial Information Sciences, Volume XLIII-B2-2021
XXIV ISPRS Congress (2021 edition)
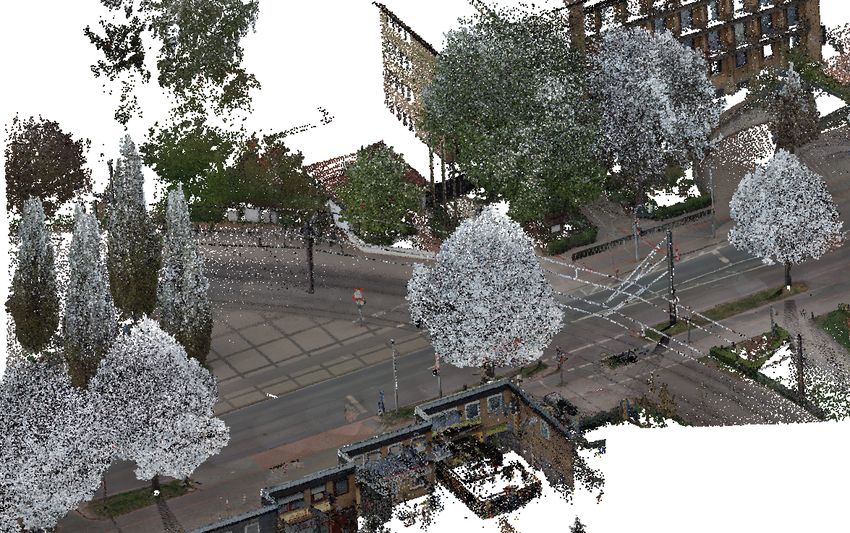
(a) Downsampled point cloud (b) Filtered point cloud
(c) Filtered point cloud (intensity) (d) Labeled point cloud
Figure 2. Downsampled, filtered and labeled point cloud. Circle areas highlight the similarity between some parking areas and
sidewalks.
Figure 3. Overview of the RandLA-Net architecture (Hu et al., 2020). N indicates the number of input points. FC: Fully Connected
layer, LFA: Local Feature Aggregation, RS: Random Sampling, MLP: shared Multi-Layer Perceptron, US: Up-sampling, DP:
Dropout.
Figure 4. Components of an encoding layer in RandLA-Net (Hu et al., 2020). Top: Local Spatial Encoding (LocSE) block which
transforms the input features and Attentive Pooling block which aggregates the local information based on weighing the neighboring
points. Bottom: Two pairs of LoSE and Attentive Pooling blocks are stacked together to increase the receptive field, which forms the
Dilated Residual Block of each encoding layer.
This contribution has been peer-reviewed.
https://doi.org/10.5194/isprs-archives-XLIII-B2-2021-115-2021 | © Author(s) 2021. CC BY 4.0 License. 117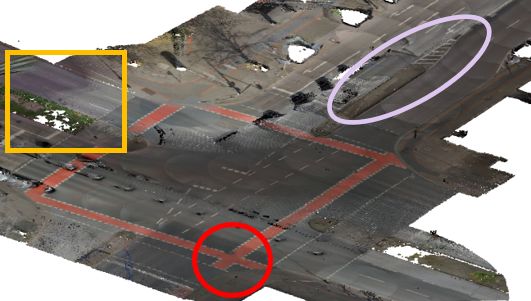
The International Archives of the Photogrammetry, Remote Sensing and Spatial Information Sciences, Volume XLIII-B2-2021
                                                XXIV ISPRS Congress (2021 edition)

is the key to modeling and perceiving the local geometry of            1. rki : Geometric feature vector only.
point clouds. Moreover, the neighborhood around each point is          2. rki ⊕ fik : Geometric feature vector rik concatenated with
selected using K-Nearest Neighbor (KNN) in RandLA-Net.                    additional features fik , which is the original implementa-
                                                                          tion of RandLA-Net.
As shown in Figure 4 (top), the LFA module consists of two             3. rki ⊕ (fi − fik ): Geometric feature vector rik concatenated
components, i.e., Local Spatial Encoding (LocSE) and Attent-              with relative additional features (fi − fik ).
ive Pooling. Within LocSE, coordinates of the input points are
first transformed to a higher dimensional geometric feature vec-
                                                                     We also consider two settings of the additional features fik , i.e.,
tor rik according to:
                                                                     (R, G, B) and (R, G, B, I), with I indicating the intensity. The
                                                                     intensity feature is a more stable attribute compared to RGB
                                                                     values since it is not affected by illumination conditions during
        rik = M LP (pi ⊕ pki ⊕ (pi − pki ) ⊕ kpi − pki k),    (1)
                                                                     recording.

where       MLP = multi-layer perceptrons                            3.3   Evaluation metrics
            i ∈ {1, 2, ..., N }
            N = the total number of points                           To evaluate and compare the performance of different feature
            k ∈ {1, 2, ..., K}                                       combinations illustrated in Section 3.2, we determine the fol-
            K = the number of nearest neighbors                      lowing evaluation metrics in this study, which are commonly
            pi = coordinates of the centered point                   used in the semantic segmentation task:
            pki = coordinates of one neighboring point
            ⊕ = concatenation operation                                • Overall accuracy (OA), which measures the proportion of
            k · k = Euclidean distance                                   correctly classified points among all input points.
                                                                       • Mean Intersection over Union (mIoU), which is the mean
                                                                         value of Intersection over Union (IoU) in each class, with
The geometric feature vector rik and additional features fik (e.g,
                                                                         IoU defined as:
R, G, B) are then concatenated as fˆik , which is the input of
Attentive Pooling.
                                                                                     Overlap of the predicted and ground truth
The aim of Attentive Pooling is to aggregate the enhanced point              IoU =                                             . (2)
                                                                                     Union of the predicted and ground truth
feature fˆik in the neighborhood to achieve local contextual in-
formation for each point. Neural networks like PointNet++ and
DGCNN
P           apply a symmetric function (e.g., max-pooling and                      4. RESULTS AND DISCUSSION
   ) as the aggregation function, which is simple but inevitably
processes the neighboring points indistinguishably, causing a        In this section, we first compare the evaluation results for three
certain loss of geometric information. The Attentive Pooling in      feature combinations in the local feature aggregation module of
RandLA-Net, instead, learns different weights ski of the neigh-      RandLA-Net in Section 4.1. Section 4.2 shows the impact of
boring points through a MLP, as indicated by g(fˆik , W ) in Fig-    adding intensity features on the overall performance, as well as
ure 4 (top). The neighborhood features are subsequently ag-          the results of several specific road types. Finally, we discuss the
gregated by taking a weighted sum. Moreover, RandLA-Net              importance of defining appropriate road classes that represent
applies the LFA module twice in each layer to effectively in-        distinct functions in Section 4.3.
crease the receptive field of the network, as shown in Figure 4
(bottom).                                                            Table 2 and Table 3 summarize the quantitative results of road
                                                                     type classification with different feature combinations in the
In this study, we use a colorized MLS point cloud. Apart from        LFA module.
the geometric vector rik , how to combine additional features
(e.g., R, G, B) to aggregate local information in road scenes                                      fik       OA         mIoU
remains to be discussed. In urban areas, road objects like mo-                       rki                   84.01%      67.05%
torway and green area have totally different appearance. Their                  rki ⊕ fik        RGB       83.58%      64.07%
variation in color can also differ a lot. Additionally, as indic-            rki⊕ (fi − fik )              85.66%      69.17%
ated in Figure 2c, intensity values of the vegetation (green area)                  rki                    85.57%      68.75%
present distinct characteristics. Thus, it might be beneficial to               ri ⊕ fik
                                                                                  k              RGBI      86.23%      68.26%
include these features or even their local differences as addi-              ri ⊕ (fi − fik )
                                                                              k
                                                                                                           86.09%      69.41%
tional information sources to help distinguish road types.
                                                                     Table 2. Comparison of the overall accuracy (OA) and the mean
However, it may happen that the surface material of two adja-         Intersection over Union (mIoU) among different setups in the
cent road segments (e.g., sidewalk and parking area shown in                                  LFA module.
circled areas of Figure 2) are the same, making the appearance
and reflection values of different road objects very similar. In     Figure 5 and Figure 6 also illustrate part of the results in our
this case, it is possible that using only geometric features can     test area. Compared to the ground truth labeling, each fea-
reduce class confusion and acquire more accurate results.            ture setup achieves reasonable predictions in general. How-
                                                                     ever, since RandLA-Net learns and aggregates point features
Based on these assumptions, we compare three feature com-            in a local neighborhood, inaccurate geometric shapes along ob-
binations to calculate neighboring weights in the local feature      ject edges can be observed. Moreover, a feature combination
aggregation module of RandLA-Net, which refer to the choice          that improves the overall accuracy does not ensure performance
of fˆik in g(fˆik , W ):                                             gains on each road type.

                                                This contribution has been peer-reviewed.
                 https://doi.org/10.5194/isprs-archives-XLIII-B2-2021-115-2021 | © Author(s) 2021. CC BY 4.0 License.                118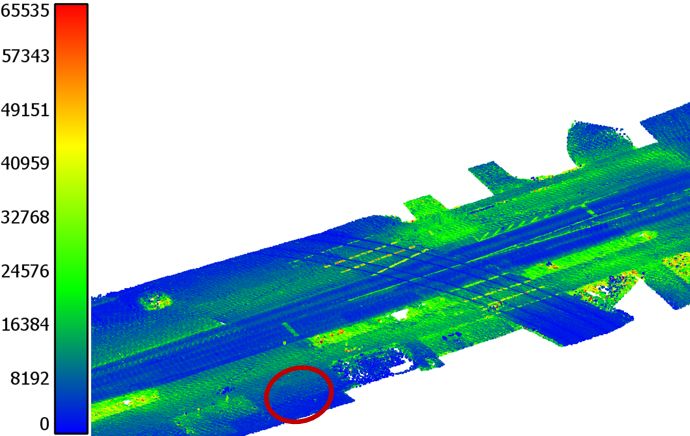
The International Archives of the Photogrammetry, Remote Sensing and Spatial Information Sciences, Volume XLIII-B2-2021
                                                  XXIV ISPRS Congress (2021 edition)

                          fik     sidewalk    cycling path     rail track   parking area      motorway       green area     island without traffic
         rki                       64.7%         50.6%          87.1%          31.2%           82.2%           85.4%               68.2%
     rki ⊕ fik           RGB       63.4%         48.6%          75.7%          32.8%           82.3%           83.5%               62.3%
 rki ⊕ (fi − fik )                 67.5%        57.9%           85.6%          35.2%           83.6%           85.5%               68.9%
         rki                       67.3%         50.4%          82.0%          34.2%           85.1%           87.0%               75.3%
     rki ⊕ fik          RGBI       68.3%        53.5%           82.7%          36.3%           86.0%           85.5%               65.5%
 rki ⊕ (fi − fik )                 67.6%         53.2%          87.0%          34.6%           85.4%           86.9%               71.1%

                           Table 3. IoU of each class among different setups in the local feature aggregation module.

4.1    Comparison between different feature combinations                    and produces a clear outline of the cycling path in Figure 5e.
                                                                            However, both the cycling path and motorway in this figure are
In the case of using RGB features, neighboring weights ob-                  made of asphalt, so involving the local difference of intensity
tained with the combination of geometric feature vector rik and             (i.e., rki ⊕ (fi − fik )) does not bring an advantage compared to
local feature differences (fi − fik ) result in a dominant advant-          using original intensity values (i.e., rki ⊕ fik ), which is also sup-
age in both evaluation metrics. Adding intensity, rki ⊕ (fi − fik )         ported by the IoU results in Table 3.
helps to achieve the best mIoU of 69.41%, but the gap between
it and other feature combinations is much smaller than that                 Moreover, Table 3 demonstrates the effectiveness of using the
shown when only adopting RGB features.                                      geometric feature rik only in the classification of green area and
                                                                            island without traffic. As shown in the boxed area of Figure
                                                                            6h, there is a vegetation stripe next to the southern border of
                                                                            the rail track. Figure 6b indicates difficulties in distinguishing
                                                                            both classes. Due to the illumination condition, the hue of this
                                                                            figure is slightly dark, reducing the contrast in the appearance
                                                                            of green area and rail track. Eliminating the effect of RGB
                                                                            features when weighing neighboring points helps to highlight
                (a) RGB: rk
                          i                  (b) RGBI: rk
                                                        i                   the difference in geometrical shapes of objects (see Figure 6a).

                                                                            For the class island without traffic, using only the geometric
                                                                            vector rik shows a dominant advantage. Island without traffic
                                                                            refers to areas that channel traffic, which is always slightly
                                                                            higher than the surrounding road surface. As shown in the white
                                                                            circled area in Figure 5, the traffic island has a very similar color
           (c) RGB: rk    k               (d) RGBI: rk    k                 as the motorway, which brings confusion in Figure 5c.
                     i ⊕ fi                          i ⊕ fi

                                                                            Also, one can see that only the geometric feature vector does
                                                                            not provide enough information for the network when adjacent
                                                                            objects are made of the same material but have a difference in
                                                                            color, especially for classes (e.g., parking area) that are some-
                                                                            times identified by paintings in specific colors.

        (e) RGB: rk          k
                  i ⊕ (fi − fi )       (f) RGBI: rk          k
                                                  i ⊕ (fi − fi )            However, the segmentation performance on the motorway class
                                                                            is only slightly affected by the feature combination of weighing
                                                                            the neighboring points, which can also be explained by the ob-
                                                                            ject properties. Motorway has the most simple geometric char-
                                                                            acteristics among all these classes and is more invariant than
                                                                            additional features like RGB.

                                                                            4.2   Impact of intensity
               (g) Ground truth           (h) Colorized view
                                                                            Comparisons of mIoU in Table 2 suggest that adding intensity
                                                                            features is beneficial when classifying different road types of
                                                                            3D point clouds. Intensity brings effective information in train-
                                                                            ing the model. Only relying on RGB features is not enough to
 Figure 5. Comparison of road type classification results using             distinguish some classes. First, there exist some traffic islands
different feature combinations to weigh the neighboring points.             that are covered with vegetation (see boxed areas in Figure 5),
    Holes in the dataset are caused by the removal of cars in               resulting in island without traffic misclassified as green area if
 pre-processing. Rectangles, ellipses, and circles highlight the            only RGB features are used to weigh neighboring points.
differences between results with different feature combinations
                      and the ground truth.                                 Also, point colors are easily affected by the change of illumin-
                                                                            ation (see Figure 7a), while intensity values are more stable in
As illustrated in Table 3, the best performance on cycling path             case of shadows (see Figure 7b). Classification results in Figure
is achieved when combining geometric feature vector and color               7c indicates that shadows cause confusions between the side-
difference. The red circled area in Figure 5h shows part of a               walk and cycling path with additional features (R, G, B). Such
cycling path painted in two colors. RGB difference in the local             confusions are largely reduced in Figure 7d, when the intensity
region helps to highlight the color variation within one object             feature is also considered.

                                                    This contribution has been peer-reviewed.
                     https://doi.org/10.5194/isprs-archives-XLIII-B2-2021-115-2021 | © Author(s) 2021. CC BY 4.0 License.                    119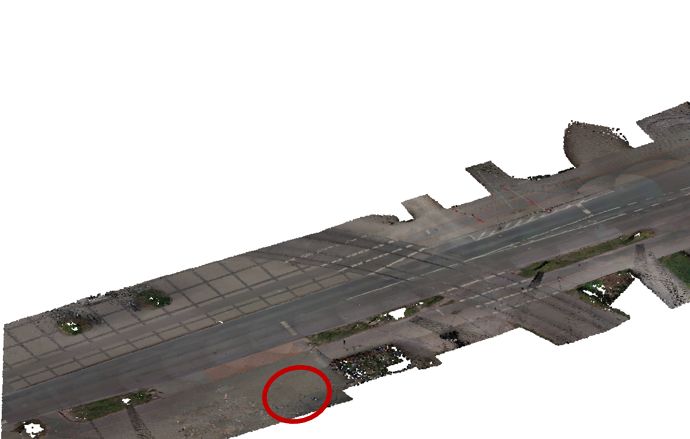
The International Archives of the Photogrammetry, Remote Sensing and Spatial Information Sciences, Volume XLIII-B2-2021
                                            XXIV ISPRS Congress (2021 edition)

       (a) RGB: rk
                 i                     (b) RGB: rk    k
                                                 i ⊕ fi                (c) RGB: rk          k
                                                                                 i ⊕ (fi − fi )
                                                                                                              (d) Ground truth

       (e) RGBI: rk
                  i                    (f) RGBI: rk    k
                                                  i ⊕ fi               (g) RGBI: rk          k
                                                                                  i ⊕ (fi − fi )
                                                                                                             (h) Colorized view

Figure 6. Comparison of road type classification results using different feature combinations to weigh the neighboring points.

                                           This contribution has been peer-reviewed.
            https://doi.org/10.5194/isprs-archives-XLIII-B2-2021-115-2021 | © Author(s) 2021. CC BY 4.0 License.                  120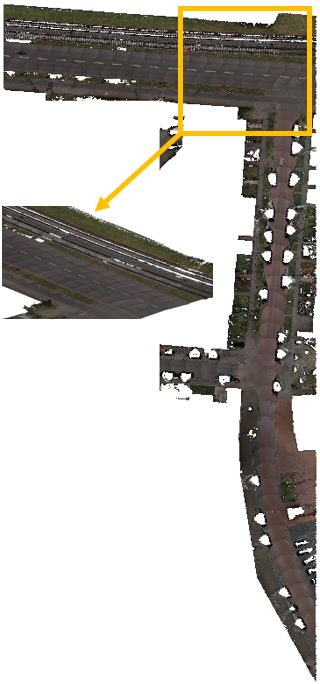
The International Archives of the Photogrammetry, Remote Sensing and Spatial Information Sciences, Volume XLIII-B2-2021
                                              XXIV ISPRS Congress (2021 edition)

                                                                  In the case of sidewalk, parking area, and motorway, the ori-
                                                                  ginal feature combination (i.e., rki ⊕ fik ) in the LFA module of
                                                                  RandLA-Net gives the best result when intensity is also used
                                                                  as input for the network, as indicated in Table 3. This tells us
                                                                  that intensity has a larger impact on the performance of these
                                                                  classes than the choice of feature combination in local inform-
                                                                  ation aggregation.

                                                                  4.3   Definition of road types
                      (a) Colorized view                          As discussed in previous sections, some road classes in our
                                                                  dataset have the same material type or even appearance, which
                                                                  confuses the classification task to some extent. For instance, the
                                                                  vertical motorway in Figure 6 looks very similar to the sidewalk
                                                                  next to it. The horizontal motorway in this figure, on the other
                                                                  hand, has a different color. Moreover, in our dataset there exists
                                                                  a priority list in labeling, e.g., a road object should be classified
                                                                  as sidewalk even though it is also used as motorway (see 5),
                                                                  which is due to the importance of promoting green transporta-
                                                                  tion in large cities nowadays.

                                                                  Indeed, when defining the road type, the usage of a road seg-
                         (b) Intensity
                                                                  ment is the most meaningful for the human being and practical
                                                                  applications like urban planning. However, a road class defini-
                                                                  tion with high complexity might harm the performance of deep
                                                                  neural networks.

                                                                                        5. CONCLUSIONS

                                                                  In this study, a deep neural network designed for the semantic
                                                                  segmentation of large-scale point clouds, RandLA-Net, is em-
                                                                  ployed to classify road types of a colorized MLS point cloud.
                                                                  Considering the key component in RandLA-Net, which is the
                      (c) RGB: rk    k
                                i ⊕ fi                            local feature aggregation (LFA) module, three feature combin-
                                                                  ations used to calculate point weights in a local neighborhood
                                                                  are assessed and compared. The difference in using RGB and
                                                                  RGBI features in road type classification is also discussed.

                                                                  Through our experiments, RandLA-Net is demonstrated to be
                                                                  applicable to the road type classification task. The best mIoU
                                                                  (69.41%) is achieved when combining the enhanced geomet-
                                                                  ric feature vector and local differences of RGBI features. The
                                                                  geometric feature vector adopted by RandLA-Net is powerful
                                                                  in modeling the 3D geometry and learning the local shapes of
                                                                  road objects, especially island without traffic. Using feature
                     (d) RGBI: rk    k
                                i ⊕ fi                            difference instead of the feature itself (which is the original im-
                                                                  plementation of RandLA-Net) makes it easier to detect complex
                                                                  objects in our dataset, like cycling path painted in various col-
                                                                  ors. Moreover, intensity, an important LiDAR feature, adds ef-
                                                                  fective information to the neural network and helps to overcome
                                                                  the negative effect of illumination changes in the environment,
                                                                  which improves the overall performance of RandLA-Net.

                                                                  In the pre-processing step, we apply grid sampling with a grid
                                                                  size of 0.1 m, which helps to avoid the problem of varying
                                                                  densities in point clouds and does not harm the local struc-
                       (e) Ground truth
                                                                  ture of road segments. As future work, more investigation on
                                                                  the effect of downsampling strategies can be conducted. Also,
                                                                  although RandLA-Net aims to process neighboring points in-
                                                                  distinguishably through learning different weights, there is still
                                                                  space in improving the delineation between objects in the clas-
                                                                  sification results. The feasibility of RandLA-Net on larger data-
Figure 7. Comparison of road type classification results with     sets and comparisons to other methods (e.g., image-based meth-
 additional features (R, G, B) and (R, G, B, I). Circle areas     ods) should also be further studied. Additionally, urban scenes
         indicate the impact of the intensity feature.            designed for modern life always show complex characteristics,

                                             This contribution has been peer-reviewed.
              https://doi.org/10.5194/isprs-archives-XLIII-B2-2021-115-2021 | © Author(s) 2021. CC BY 4.0 License.                 121
The International Archives of the Photogrammetry, Remote Sensing and Spatial Information Sciences, Volume XLIII-B2-2021
                                                XXIV ISPRS Congress (2021 edition)

bringing difficulties to the automatic detection of objects like    Zhu, Q., Chen, L., Li, Q., Li, M., Nüchter, A., Wang, J.,
road segments. Definition of the road types determines inform-      2012. 3D LIDAR point cloud based intersection recognition
ation input to deep neural networks and affects how the scene       for autonomous driving. 2012 IEEE Intelligent Vehicles Sym-
is modeled. Dividing the road classes in a balanced way, to         posium, 456–461.
account for both the test accuracy and practical usage, needs a
more detailed discussion in future research.

                       REFERENCES

Behley, J., Garbade, M., Milioto, A., Quenzel, J., Behnke, S.,
Stachniss, C., Gall, J., 2019. SemanticKITTI: A Dataset for Se-
mantic Scene Understanding of LiDAR Sequences. Proc. of the
IEEE/CVF International Conf. on Computer Vision (ICCV).

Cyclomedia, 2021. Capture data from public spaces.
https://www.cyclomedia.com/us/product/data-capture/data-
capture. (Accessed on April 2021).

Hu, Q., Yang, B., Xie, L., Rosa, S., Guo, Y., Wang, Z., Tri-
goni, N., Markham, A., 2020. RandLA-Net: Efficient Semantic
Segmentation of Large-Scale Point Clouds. Proceedings of the
IEEE Conference on Computer Vision and Pattern Recognition.

Isenburg, M., 2014. LAStools - Efficient tools for LiDAR pro-
cessing. http://rapidlasso.com/LAStools. (Accessed on Febru-
ary 2021).

Liu, W., Sun, J., Li, W., Hu, T., Wang, P., 2019. Deep learning
on point clouds and its application: A survey. Sensors, 19(19),
4188.

Liu, Z., Hu, H., Cao, Y., Zhang, Z., Tong, X., 2020. A closer
look at local aggregation operators in point cloud analysis.
European Conference on Computer Vision, Springer, 326–342.

Qi, C. R., Su, H., Mo, K., Guibas, L. J., 2017a. PointNet: Deep
Learning on Point Sets for 3D Classification and Segmentation.
2017 IEEE Conference on Computer Vision and Pattern Recog-
nition (CVPR), 77–85.

Qi, C. R., Yi, L., Su, H., Guibas, L. J., 2017b. PointNet++:
Deep Hierarchical Feature Learning on Point Sets in a Metric
Space. NIPS’17, Curran Associates Inc.

Riegler, G., Osman Ulusoy, A., Geiger, A., 2017. Octnet:
Learning Deep 3D Representations at High Resolutions. Pro-
ceedings of the IEEE Conference on Computer Vision and Pat-
tern Recognition, 3577–3586.

Velodyne, 2010. HDL-32E: High Resolution Real-Time
3D Lidar Sensor. https://velodynelidar.com/products/hdl-32e/.
(Accessed on April 2021).

Wang, Y., Sun, Y., Liu, Z., Sarma, S. E., Bronstein, M. M.,
Solomon, J. M., 2019. Dynamic Graph CNN for Learning on
Point Clouds. ACM Transactions On Graphics (tog), 38(5), 1–
12.

Widyaningrum, E., Bai, Q., Fajari, M. K., Lindenbergh, R. C.,
2021. Airborne Laser Scanning Point Cloud Classification Us-
ing the DGCNN Deep Learning Method. Remote Sensing,
13(5). https://www.mdpi.com/2072-4292/13/5/859.

Wu, B., Wan, A., Yue, X., Keutzer, K., 2018. Squeezeseg:
Convolutional Neural Nets with Recurrent CRF for Real-time
Road-object Segmentation from 3D LiDAR Point Cloud. 2018
IEEE International Conference on Robotics and Automation
(ICRA), IEEE, 1887–1893.

                                               This contribution has been peer-reviewed.
                https://doi.org/10.5194/isprs-archives-XLIII-B2-2021-115-2021 | © Author(s) 2021. CC BY 4.0 License.           122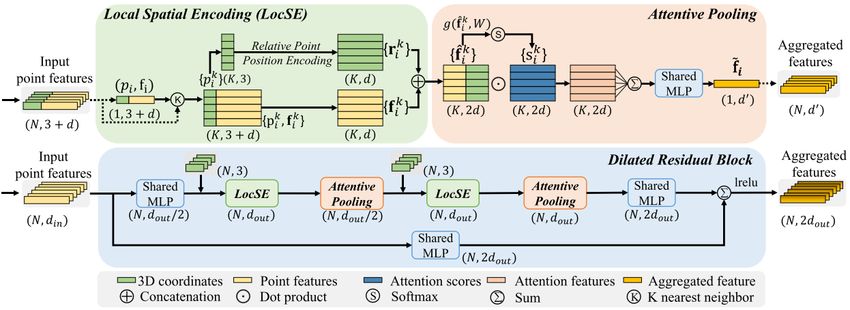
You can also read