Journal of Agricultural Systems, Technology, and Management Volume 31 July 2020 - Journal of Agricultural Systems ...
←
→
Page content transcription
If your browser does not render page correctly, please read the page content below
Journal of Agricultural Systems,
                                                  Technology, and Management

                                                                                     Volume 31
                                                                                      July 2020

     A Model for Teaching Slot Inlet Theory for Ventilation of
                   Animal Housing Structures
                           John P. Chastain1, Hunter F. Massey2
1
    Professor and Extension Agricultural Engineer, Department of Agricultural Sciences, Clemson
    University, 245 McAdams Hall, Clemson, SC 29634-310 email: jchstn@clemson.edu
2
    Senior Lecturer, Department of Agricultural Sciences, Clemson University, 245 McAdams
    Hall, Clemson, SC 29634-310 email: massey4@clemson.edu

Abstract
A model ventilation system was designed and built to provide a way for students to learn
ventilation inlet theory in a practical laboratory setting. The model was designed to provide an
adjustable ceiling and wall slot inlet, several fans to vary the air velocity through the inlet, a
manometer to measure the static pressure drop across the inlet, ports to allow students to
measure inlet velocity using a hotwire anemometer, a thermistor probe to measure air
temperature, and ports along the ceiling of the model to measure the variation of velocity with
respect to distance from the ceiling inlet baffle. The model was used by students to collect
velocity versus static pressure drop data across a wide range of opening widths. A sample data
set and analysis was provided to demonstrate how students used inlet theory to empirically
determine the discharge coefficient for an inlet. Results from six laboratory groups, three ceiling
inlets and three wall inlets, indicated that the average discharge coefficient was 0.50 regardless
of inlet orientation. These results agreed with the literature for a ceiling inlet (0.50) but differed
from the published value of 0.80 for a wall inlet. The reason for the discrepancy with the
published value for the wall inlet was not possible to determine. Data collected by one group
showed that the normalized maximum jet velocity (Vmax/Vinlet) of the ceiling inlet decreased with
respect to distance from the inlet in a curvilinear manner with an R2 of 0.937 as expected based
on inlet theory.

Keywords: ventilation, inlets, education, student learning, laboratory activity

          Chastain, J. P. & Massey, H. F. (2020). A Model for Teaching Slot Inlet                   9
          Theory for Ventilation of Animal Housing Structures. Journal of Agricultural
          Systems, Technology, and Management, 31, 9-25.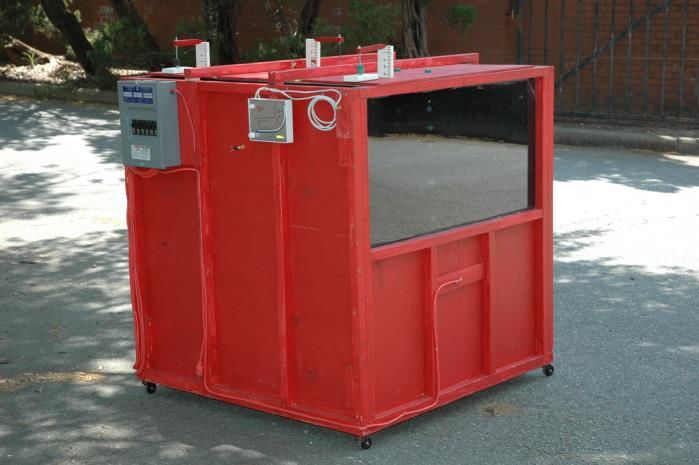
Introduction
A well-designed ventilation system for an agricultural production facility requires three
components in order to function properly: (1) fans to provide the required ventilation rates, (2)
inlets that are sized to provide the desired velocity, and (3) a control system to regulate the
number of fans needed and to control inlet area (Hellickson and Walker, 1983; Albright, 1990;
MWPS, 1990). Experience in extension education by the authors has shown that the function
and design of inlets is often the most neglected and least understood of these three
components by animal producers. Problems such as inadequate ventilation rates or poor air
distribution were common in barns that appeared to have the correct number and sizes of
thermostatically controlled fans. In many cases, the ventilation problems were corrected by
proper inlet adjustment, or provision of an inlet system that was designed to match the airflow
needs of each stage of the ventilation system (MWPS, 1990).

In addition, experience by the authors teaching university students in agricultural mechanization,
agricultural engineering, agricultural education, and animal science also indicated that the fluid
mechanics of an air inlet was one of the more difficult concepts for students to grasp if lecture
was the only method used for instruction. In response to this need, a model ventilation system
was designed and constructed for the purpose of teaching inlet theory as part of a laboratory in
a senior level course in Agricultural Mechanization. In particular, the model ventilation system
was designed to allow students to conduct experiments to empirically determine the discharge
coefficients for a wide range of inlet areas and compare them to published values (Albright
1976, Albright 1990). Knowledge of the correct discharge coefficient was a requirement for
calculation of inlet velocity and was known to vary depending on the cross-sectional geometry of
the inlet and was a measure of the airflow resistance of the inlet (Albright, 1976; Hellickson and
Walker, 1983; Chastain et al., 1987). The model was also constructed to allow students to
obseve the reduction in maximum velocity in the air jet with respect to distance from the inlet
baffle. The decay in maximum air jet velocity was the aspect of inlet theory that was used to
develop recommendations for the number of inlet rows to be used for an animal production
facility based on building width (Hellickson and Walker, 1983; MWPS, 1990).

The goal of this study was to provide a resource for instructors to develop lecture content and a
laboratory scale model ventilation system to teach inlet theory for university level courses that
cover mechanical ventilation of animal housing structures. The objectives of this study were to
provide a summary of inlet theory, describe the design and construction of the model ventilation
system, and to present data and results obtained by students pertaining to the empirical
determination of discharge coefficients, and the decay of air velocity with respect to distance
from a slot inlet.

Summary of Inlet Theory
The adjustable baffled slot inlet was invented by Millier (1950) and was the most commonly
used type of air inlet for exhaust ventilated animal production facilities until manufactured inlets
became available (Albright, 1976; Albright, 1990). Manufactured inlets are now readily available,
and work under the same principles of fluid mechanics. However, the original baffled inlet
design is still widely used (MWPS, 1990).

Originally, baffled inlets were built into the structure to bring fresh air into the building from a
screened inlet below the eaves (Hellickson and Walker, 1983). The most common type of
baffled inlet was constructed to cause the air jet to form along the ceiling, as shown in Figure

         Chastain, J. P. & Massey, H. F. (2020). A Model for Teaching Slot Inlet                   10
         Theory for Ventilation of Animal Housing Structures. Journal of Agricultural
         Systems, Technology, and Management, 31, 9-25.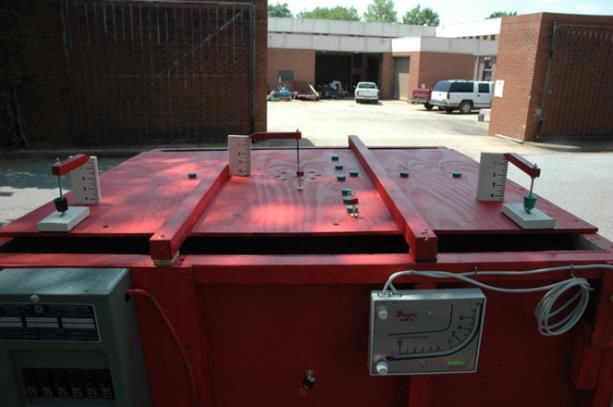
1a. Such an inlet was called a ceiling inlet. If the baffle was installed to direct the air jet down the
wall it was called a wall inlet (Figure 1b). In both cases, the amount of inlet area was adjusted to
provide the area needed to match the ventilation rate provided by the fans by setting the width
of the opening, w, to the correct value. The fluid mechanics to describe these two types of
baffled inlets was the same.

It was common to install a continuous ceiling or wall inlet along both sidewalls of a building
(MWPS, 1990). Such a configuration provided excellent air distribution and mixing within the
ventilated space (Hellickson and Walker, 1983; Albright. 1990). Baffled inlets were generally not
installed along the end walls since they would interfere with the air jets of the sidewall inlets.
Baffled inlets were also not installed over the ventilation fans to prevent air that enters the
building from immediately exiting through the fans.

                 Ceiling Inlet (a)                                    Wall Inlet (b)
    Figure 1. Schematics of ceiling (a) and wall (b) inlets used to ventilate animal production
              facilities (adapted from Hellickson and Walker, 1983; MWPS, 1990).
For a ventilation system to function properly the inlet area must be controlled to match the
airflow rate of the fans while providing a velocity high enough to provide proper air distribution
and mixing. In general, slot inlets work best for inlet velocities in the range of 3.3 to 5.0 m/s (650
to 984 fpm) depending on the season of the year with higher velocities being more desirable for
winter ventilation (Hellickson and Walker, 1983; Albright 1990). In many cases, good air
distribution can be obtained with an inlet velocity on the order of 4.0 m/s (787 fpm).

The total airflow through the baffled inlets (Qinlet) was set equal to the airflow rate to be supplied
by the fans operating for a stage of ventilation. The airflow rate through the entire length of
baffled inlet was calculated from the inlet velocity and the cross-sectional dimensions as:

                                       Qinlet = w L Vinlet.                                        (1)

Where, w was the width of the inlet opening, L was the total length of the slot inlet, and Vinlet was
the velocity of the air as it entered the building (Figure 1a).

As air moved from outside the building, into the constriction of the baffle, and then into the
building the total energy of the moving fluid was constant. Bernoulli’s energy equation was
applied to the airflow assuming an ideal, incompressible fluid at a point outside of the building
and at the point where the airflow entered the building at the inlet baffle (Figure 1a). The
resulting equation was (Hellickson and Walker, 1983):

         Chastain, J. P. & Massey, H. F. (2020). A Model for Teaching Slot Inlet                   11
         Theory for Ventilation of Animal Housing Structures. Journal of Agricultural
         Systems, Technology, and Management, 31, 9-25.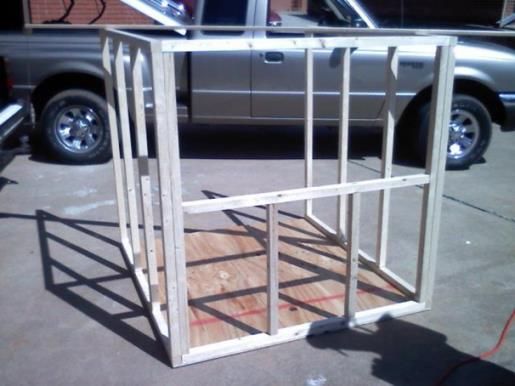
ρoVo2 / 2 + Po = ρVideal2 / 2 + Pi .                              (2)

Where,
 ρoVo2 / 2 =      the velocity pressure outside the building,
 ρo=              density of the air outside the building (kg/m3),
 Vo =             air velocity outside the building (m/s),
 Po=              static pressure outside the building (Pa),
 ρVideal2 / 2 =   the velocity pressure inside the building at the baffle,
 ρ=               density of the airflowing through the inlet (kg/m3),
 Videal =         velocity for an ideal fluid (no friction) at the baffle (m/s), and
 Pi =             static pressure inside the building (Pa).

It was assumed that the air outside the building was still (no wind) which set Vo to zero.
Equation 2 was solved for Videal, with Vo = 0, and yielded the following equation for the ideal
velocity (Hellickson and Walker, 1983):

                                     Videal = [ 2 ΔP / ρ ] 0.5.                                   (3)

Where ΔP was the difference between the outside and inside static pressures, Po – Pi.

The actual inlet velocity (Vinlet) had been observed by previous researchers to be lower than the
ideal velocity due to the effects of fluid friction and flow restrictions related to the geometry of
the inlet (Albright 1976; Hellickson and Walker, 1983; Chastain et al., 1987; Albright, 1990). The
resistance associated with a real fluid was represented by an experimentally determined
discharge coefficient, Cd, and was used to reduce Videal as shown in the following equation:

                                         Vinlet = Cd Videal .                                     (4)

Insertion of equation 3 into equation 4 yielded the following familiar equation for the inlet velocity
(Albright, 1990):

                                    Vinlet = Cd [ 2 ΔP / ρ ] 0.5.                                 (5)

The density of the air (kg/m3) was calculated from the air temperature (T) using the following
correlation that was developed from a standard table of air properties that was available in many
heat transfer texts (e.g. Holman, 1976, Table A-5):

                    ρ = 1.293 – 0.0046 T + 0.00001 T2, 0°C ≤ T ≤ 40°C.                            (6)

The airflow through the inlet was calculated as the product of the inlet velocity and the area of
the inlet (Ainlet = w x L) as:

                                  Q = Ainlet Cd [ 2 ΔP / ρ ] 0.5.                                 (7)

The total length of the ceiling or wall inlets used in an agricultural building (L) will vary
depending on the length of the building. As a result, comparison of the airflow rates between
two continuous slot inlets was made on an airflow per unit length basis (e.g. Hellickson and
Walker, 1983). The relationship for airflow per meter of slot length, L, (Q/L) was:

                                   Q/L = w Cd [ 2 ΔP / ρ ] 0.5.                                   (8)

Previous research has shown that the value of the discharge coefficient can vary from 0.10 to
0.80 depending on inlet geometry and the contribution of friction losses from the airflow path
(Albright, 1976; Helickson and Walker, 1983; Chastain et al., 1987; Albright, 1990). Therefore, it

         Chastain, J. P. & Massey, H. F. (2020). A Model for Teaching Slot Inlet                  12
         Theory for Ventilation of Animal Housing Structures. Journal of Agricultural
         Systems, Technology, and Management, 31, 9-25.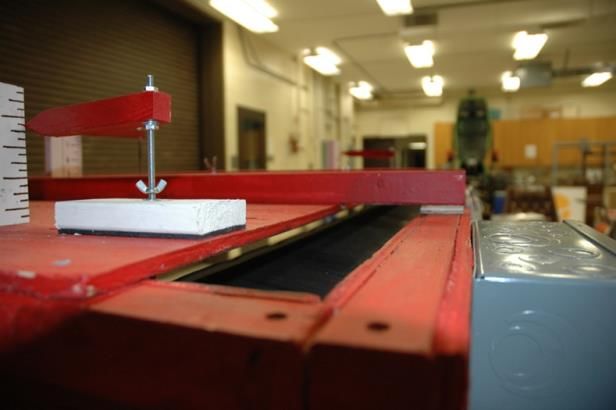
was important that the value of Cd used in the equations for velocity and airflow (equations 5, 7,
8) correspond to the type of inlet used. Previous experimental work has shown that the average
Cd for a ceiling inlet (Figure 1a) was 0.50 for very long slim inlets that are commonly used in
animal facilities (Albright, 1976; Helickson and Walker, 1983). For a wall inlet (Figure 1b), the
average Cd was reported in the literature to be 0.80 (Albright, 1976). The higher discharge
coefficient for the wall inlet was believed to be the result of either the lack of the second bend in
airflow that was required for a ceiling jet, as shown in Figure 1b, or a more rectangular cross-
sectional geometry. However, the exact details concerning the cross-sectional geometry of the
wall inlet tested by Albright (1976) were not provided in the original publication.
Materials and Methods
A model ventilation system was designed and constructed for the purpose of teaching
ventilation inlet theory and performance in a laboratory setting. The design and construction
were carried out by a team of senior students in Agricultural Mechanization and Business as
part of a capstone project under the supervision of the authors. The model included a ceiling
and a wall inlet and five fans to provide a range of airflows and inlet velocities. The model was
instrumented with a manometer to measure the pressure drop across an inlet, and an
anemometer equipped with a thermistor that allowed the measurement of the inlet velocity and
air temperature. The model ventilation system was used in several semesters of a course in
environmental control of animal structures to provide a laboratory learning experience. Data
collected from the model ventilation system was used by students to empirically determine the
discharge coefficient for several inlets and to observe the decay in the inlet velocity with respect
to distance from the inlet.
Design and Construction of the Model Ventilation System
The students who designed the model developed the following specifications under the
supervision of the authors:
The minimum length of the ceiling and wall inlet (L) was to be 1.0 m (3.28 ft).
The model must allow for convenient measurement of Vinlet and ΔP for a practical range
of opening widths (w).
The fans must provide a wide range of velocities up to at least 4 m/s (787 fpm) at static
pressure differences of 2.49 to 40 Pa (0.01 to 0.16 in of H2O).
Ports must be provided in the top of the model to allow observation of the decay in
maximum air jet velocity with respect to distance from the inlet.
The model must be mounted on casters so that it can be moved from storage to the
teaching laboratory.
In order to meet the inlet length and portability requirements the model ventilation
system was constructed as a 1.22 m (48 in) by 1.22 m (48 in) by 1.22 m (48 in) cube
using an external frame made with 3.8 cm by 3.8 cm (1.5 in x 1.5 in) pine. The wooden
frame was lined with 12.7 mm (0.5 in) plywood to provide smooth interior surfaces
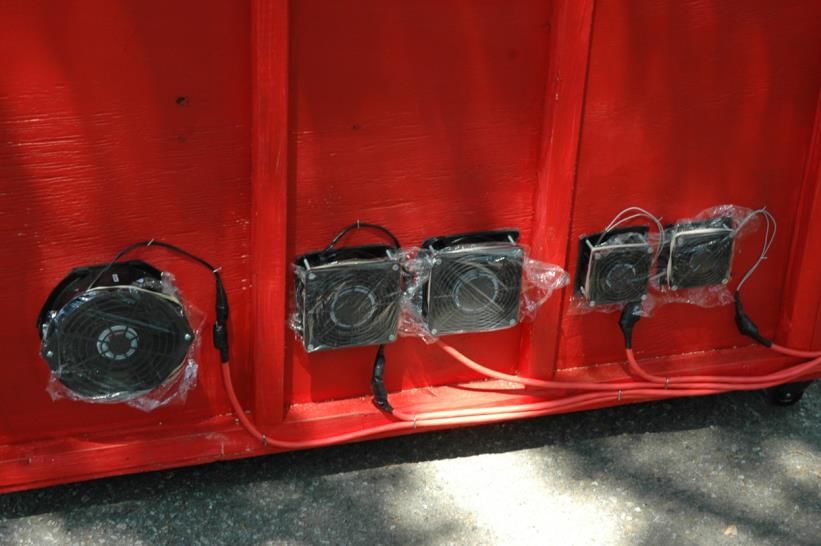
(Figure 2) including an acrylic window and casters (Figure 3). A breaker panel was
mounted on the model to mount switches for a compact fluorescent lamp that was
positioned inside the box and below the window, and for five ventilation fans that were
mounted at the bottom of the wall opposite the window (Figure 2).
Chastain, J. P. & Massey, H. F. (2020). A Model for Teaching Slot Inlet 13
Theory for Ventilation of Animal Housing Structures. Journal of Agricultural
Systems, Technology, and Management, 31, 9-25.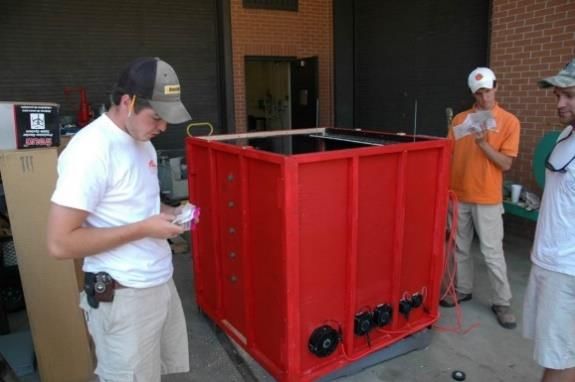
Figure 2. Construction of the model ventilation system by students in Agricultural
                 Mechanization and Business showing fan placement.

  Figure 3. Completed model ventilation system showing the window and the breaker
 panel used to mount switches for the fans and an interior light. Fans were installed on
                            the wall opposite the window.
Five tube axial fans that were normally used to cool computing equipment were selected to
provide a variety of airflow rates for inlet testing. The fan data provided by the manufacturers
was given in Table 1, and the location of the installed fans was shown in Figure 4. Elastic food
container covers, shown on each of the fans in the figure, were used to prevent airflow through
fans that were not in use. For example, when fans 1 and 2 were operated together to provide
the desired airflow rate the plastic covers were placed on fans 3, 4 and 5 to prevent air from
entering the model through those fans. In an actual building, backflow through unused fans
would be prevented using louvered dampers.

Table 1. Rated airflows for the five fans selected for model ventilation system (based on
literature from the manufacturers).
                                                                              Airflow at
               Fan           Fan Diameter        Airflow at ΔP = 0 Pa        ΔP = 25 Pa
              Number              (mm)                  (m3 / s)               (m3 / s)
                1                  79.4                  0.014                  0.010
                2                  79.4                  0.019                  0.014
                3                 119.1                  0.033                  0.024
                4                 119.1                  0.054                  0.039
                5                 171.5                  0.094                  0.067

        Chastain, J. P. & Massey, H. F. (2020). A Model for Teaching Slot Inlet              14
        Theory for Ventilation of Animal Housing Structures. Journal of Agricultural
        Systems, Technology, and Management, 31, 9-25.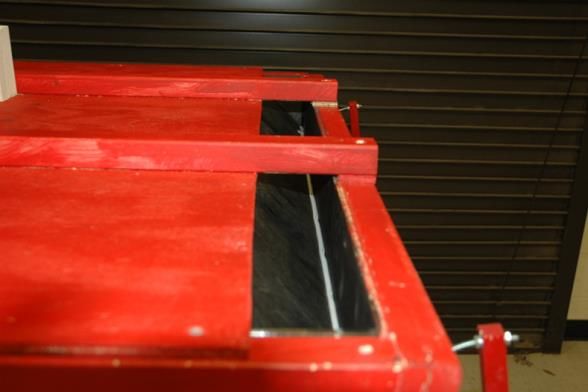
4        3         2     1
                             5

       Figure 4. Location of fans used to provide a range of airflow rates for the model.
The ceiling and wall inlets were built into the structure of the model using baffles made from
12.7 mm (0.5 in) plywood and piano hinges as shown in Figures 5 and 6. Rubber weather-
stripping was attached to the inside edge of the baffles to allow the inlet that was not in use to
be sealed shut. Two long carriage bolts with wing nuts were used to fabricate a simple clamping
mechanism on each end of the baffles (Figure 5). The bolt was used to hold the inlet open at the
desired slot width (w), and to provide the necessary pressure to press the baffle to the interior
plywood wall to form a seal when not in use. Preliminary testing indicated that the clamping
mechanisms provided the desired clamping pressure to support the baffles, but they were not
sufficient to set the slot width to a precise dimension. Rectangular wood strips (plywood and
solid rectangular stock) of varying thickness were cut to lengths of about 4 inches to allow the
slot width to be set to a known value. The thicknesses of the wood strips were measured 6 to 8
times around the perimeter of the strips using a digital caliper. The mean of the 6 to 8
measurements was used as the thickness of the wood strips. The width of the slot inlet opening
was set by clamping two wooden strips of the same thickness on each end of the slot. The slot
length, L, was the distance between the inside edges of the wooden strips.

         Ceiling Inlet – Baffle Closed                     Ceiling Inlet: Baffle Open
Figure 5. Ceiling inlet constructed in the model using a plywood baffle board and a piano hinge.

        Chastain, J. P. & Massey, H. F. (2020). A Model for Teaching Slot Inlet               15
        Theory for Ventilation of Animal Housing Structures. Journal of Agricultural
        Systems, Technology, and Management, 31, 9-25.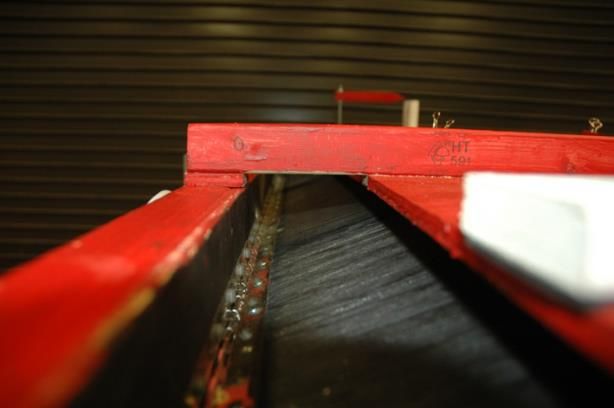
Wall Inlet – Baffle Closed                          Wall Inlet: Baffle Open
 Figure 6. Wall inlet constructed in the model using a plywood baffle board and a piano hinge.
The static pressure drop across an inlet was measured using a liquid filled manometer (Dwyer
MARK II 25®) that could be read to the nearest 2.49 Pa (0.01 in of H2O) and was mounted to
the exterior framing (Figure 7). The low-pressure inside the test box was measured using a
surface-mounted pressure tap installed 12.7 mm (0.50 in) inside the inlet opening in the top of
the model. The high-pressure tap was mounted in a shielded location on the outside of the
model. The taps were constructed from 9.5 mm (0.374 in) brass fittings that had pipe thread on
one end to facilitate mounting and a barb to secure the tubing on the other. The pipe thread was
screwed into a pre-drilled hole in the box plywood wall until the fitting was at the wall surface. A
small piece of plywood was fixed to the corner of the framing on the outside of the test structure.
The brass fitting for the high-pressure tap was screwed into the plywood so as to have the tap
open in the space between the framing and the outside of the box wall.

Figure 7. Liquid-filled manometer used to measure the static pressure drop across an inlet, and
 the ports used to make velocity measurements with respect to distance from the ceiling inlet
                                            baffle.
Velocity and air temperature measurements were taken using a digital hot-wire anemometer
that included a thermistor in the measuring tip (ALNOR CompuFlow® Thermo Anemometer,
model 8525). Each velocity and temperature measurement was the average of at least 10
readings. Velocity measurements were made by inserting the velocity probe into stoppered
ports at the desired distance from the inlet. Another rubber stopper with a hole cut in the center
was placed around the probe of the thermo-anemometer to provide a seal between the wall of
the model and the probe. The rubber stopper around the probe also made holding the
anemometer in the proper position for accurate velocity measurement possible. The stoppered
ports used with the anemometer were shown in Figure 7.

        Chastain, J. P. & Massey, H. F. (2020). A Model for Teaching Slot Inlet                 16
        Theory for Ventilation of Animal Housing Structures. Journal of Agricultural
        Systems, Technology, and Management, 31, 9-25.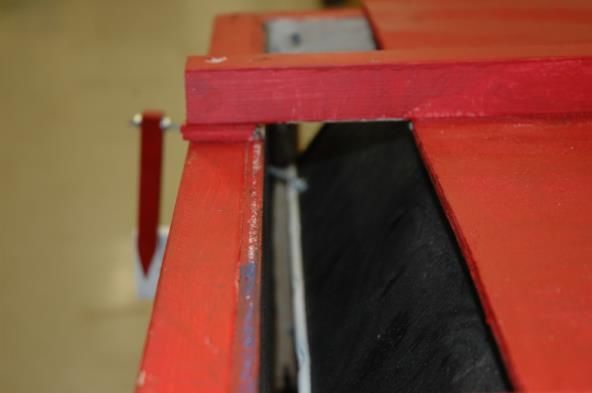
The ports on the top of the model were drilled at distances of 0, 13, 20, 36, 51, and 66 cm (0, 5,
10, 14, 20, and 26 in) from the edge of the ceiling inlet baffle. The port at 0 cm was the location
of the inlet velocity measurement. The ports at 13 to 66 cm were used to observe at least the
beginning of a zone of stable yet decreasing maximum air jet velocity as defined by Albright
(1990). The useful throw distance of an inlet air jet can be about 100 times the inlet width
(Albright, 1990) which would be in the range of 60 to 330 cm for most ceiling inlets that could be
tested with the model (w = 6 to 33 mm or 0.23 to 1.3 in). The distances of the ports from the
inlet baffle were not evenly spaced to allow more maximum jet velocity measurements closer to
the inlet because the beginning of the jet development zone would vary in location with inlet
width (w). The farthest distance from the inlet was set to be a small amount beyond the width of
the model. It was assumed that velocity measurements beyond the middle of the 1.22 m wide
model would be greatly influenced by the presence of the opposite wall. The ventilation model
as constructed was too small to allow reliable measurement of the maximum throw distance of
the air jets.

Experimental Procedures
The model ventilation system was used by students as part of the teaching laboratory for a
course in environmental control of animal facilities. Students were assigned to groups and
conducted one of two types of experiments: (1) determination of the inlet discharge coefficient,
and (2) observation of the decay of the maximum inlet velocity with respect to distance from the
inlet opening. The purpose of this section was to provide details on the procedures and
calculations used by the students.

Collection of Data to Determine the Discharge Coefficient
Students selected an inlet width, w, and collected data to determine the variation of the inlet
velocity (Vinlet) with respect to static pressure drop across the inlet by using the fans in various
combinations to generate as many data points as possible. One of the most critical and tedious
aspects of this experiment was the placement of the velocity probe at the exit of the inlet baffle
(x = 0). Texts on the fluid mechanics of a wall jet (e.g. Albright, 1990) indicated that at this point
the velocity in the air jet was constant at a short distance away from the solid wall where the
velocity was zero. Therefore, care had to be taken to position the probe vertically by moving
away from wall and observing the velocity. As the probe was moved from near the wall to the
center of the air jet the velocity would increase quickly to a maximum value. If the probe was
extended from the wall too much the velocity would fall quickly indicating that the probe was
outside the air jet. The probe was positioned correctly when it was held at a point perpendicular
to the air jet in the region of maximum velocity. Once the probe was set it was held in the correct
position using a laboratory clamp and stand while the data were collected. A rubber laboratory
stopper with a hole cut to fit around the probe was pressed into the ceiling of the model to form
a seal.

The experimental procedure used by the students for determination of the discharge coefficient
of an inlet was as follows.

   1. A pair of wooden strips of the same thickness was selected to set the width of the inlet,
      the thickness was measured 6 to 8 times and the average was calculated to determine
      the slot width, w.
   2. A wooden strip was placed on each end of the baffle board and the nuts on the carriage
      bolts were used to hold the baffle board snuggly against the wooden strips.
   3. The length of the slot inlet, L, was the distance between the inside edges of the wooden
      strips used to set the slot width and was measured using a measuring tape to the
      nearest 1.59 mm (0.0625 in).

        Chastain, J. P. & Massey, H. F. (2020). A Model for Teaching Slot Inlet                   17
        Theory for Ventilation of Animal Housing Structures. Journal of Agricultural
        Systems, Technology, and Management, 31, 9-25.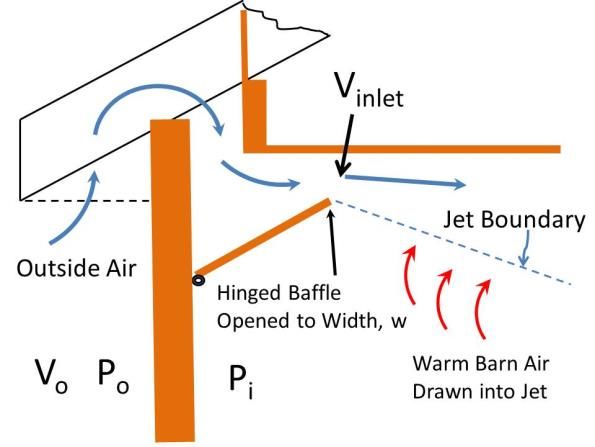
4. Three of the fans were turned on and the airflow was allowed to stabilize for about 1 min
       as indicated by a constant pressure drop reading on the manometer.
   5. The anemometer probe was inserted into the port closest to the inlet baffle (x = 0) and
       held so as to be perpendicular to the wall of the model. The probe was gradually moved
       in or out to determine the position that provided the maximum velocity reading. Once the
       correct position was determined the stopper around the probe was pressed into the port
       to form a seal between the probe and the wall and the probe was held in place with the
       clamp and stand.
   6. After the probe was positioned correctly all fans were turned off and the manometer was
       checked to make sure it read a ΔP of zero. If not, the manometer was re-zeroed. Each
       test was begun by turning on the fan with the smallest airflow (fan 1), while covering all
       other fans with the plastic covers. If the static pressure drop was 2.49 Pa (0.01 in of
       H2O) or more the fan with the smallest airflow was sufficient for the first data point. If the
       ΔP was less than 2.49 Pa then the pressure drop was measured using the fan with the
       next largest airflow as the only fan (fan 2) to determine if the minimum ΔP requirement
       was was met. Once the single fan that provided the minimum ΔP was found the airflow
       was allowed to stabilize for about 1 min before data collection began.
   7. While the airflow was stabilizing, the air temperature was measured using the thermistor
       in the anemometer probe to determine an average based on at least 10 readings.
   8. The ΔP for the airflow was recorded on the data sheet and the inlet velocity was
       measured using the anemometer. The average inlet velocity was recorded on the data
       sheet.
   9. The airflow rate was increased by adding another fan and step 8 was repeated after the
       airflow was allowed to stabilize.
   10. The remainder of the data were collected by repeating steps 8 and 9 using as many fan
       combinations as possible to provide a wide variation of Vinlet and ΔP data points.
   11. After all the data points were obtained the air temperature was measured again.

The students obtained measurements of air temperature, inlet dimensions, velocities and
pressure differences in English units and the first task in the analysis was to make the
appropriate conversions to metric units. After finishing the required unit conversions, the mean
air temperature was determined by averaging the temperatures measured before and after the
velocity measurements. The air density was calculated based on the mean temperature using
equation 6. The ideal velocity was calculated for each data point using the results from
Bernoulli’s Equation given in equation 3 with the measured ΔP for each data point and the air
density. Next, the students calculated Q/L for each data point using the following equation:

                                       Q/L = w Vinlet.                                         (9)

The discharge coefficient was determined by plotting the measured inlet velocities (y-variable)
with respect to the ideal velocities (x-variable) based on the defining equation for Cd given in
equation 4. Linear regression of the data using the regression package in Excel with a forced
zero y-intercept yielded a slope that was the empirically determined Cd for the inlet.

Collection of Data to Observe the Decay of Maximum Air Velocity with Distance
from the Inlet
For this experiment the students selected a slot width and positioned the velocity probe as
described previously in steps 1 through 5. The only difference was that the students selected a
group of fans to provide one airflow rate that was used for the entire experiment. After the
airflow stabilized the first data point was the inlet velocity (x = 0 cm) and it was the average of

        Chastain, J. P. & Massey, H. F. (2020). A Model for Teaching Slot Inlet                  18
        Theory for Ventilation of Animal Housing Structures. Journal of Agricultural
        Systems, Technology, and Management, 31, 9-25.
ten readings as in the previous experiment. Next, the probe was removed from the port and a
rubber stopper was reinserted to seal up the port. The remaining ports on the top of the model
ventilation system were used to determine the maximum velocity in the air jet at the remaining
distances from the inlet baffle (x = 13, 20, 36, 51, and 66 cm). At each distance away from the
baffle the velocity probe was used to measure velocity at several distances down from the
ceiling. The number of points used varied with distance from the inlet baffle as the air jet
expanded. Readings were taken near the wall and the probe was moved downward by
increments of about 25 mm (1 in) until the velocity readings decreased drastically indicating that
the probe was outside the air jet. The maximum velocity reading was selected as the maximum
velocity of the air jet (Vmax). This procedure was repeated for two different slot widths. The data
from all three values of w were normalized as Vmax/Vinlet and were plotted with respect to
distance from the inlet. Linear regression was used to determine if the normalized velocities
(Vmax/Vinlet) had a common correlation with respect to distance from the inlet baffle as was to be
expected from theory (Albright, 1990).
Results
Data sets collected from seven laboratory groups were included in this paper. Three of the data
sets (groups 1 – 3) were focused on determination of the discharge coefficient for the ceiling
inlet and three data sets (groups 4 – 6) empirically determined the discharge coefficient for the
wall inlet. The seventh group of students measured the decay of the maximum velocity of the air
jet with respect to distance from the baffle of the ceiling inlet.
Due to scale and airflow limitations the maximum value of w that could be used with the model
ventilation system was about 33 mm (1.3 in). The practical range of opening widths used for
mechanical ventilation of animal facilities was from 3.18 mm (1/8 in) to 178 mm (7 in), and slot
lengths ranged from 7.3 m (16 ft) to 213 m (700 ft) or more (MWPS, 1990). The range of w-
values used for the experiments was 6.35 to 22.23 mm (0.25 to 0.875 in).
Discharge Coefficient Results
Sample Data and Analysis
A sample data set for a ceiling inlet with an opening width of 8.25 mm (0.325 in) was provided in
Table 2. As was noted previously, the students took the measurements using English units and
converted them to metric prior to analysis. In this case, the length of the slot inlet was 1.026 m
(40.39 in) and the air density was calculated to be 1.198 kg/m3 based on an average air
temperature of 21.6 ºC (71 ºF) using equation 6. Inlet velocities ranged from 0 to 4.553 m/s (0 to
896 fpm) with a corresponding range of pressure differences from 0 to 59.80 Pa (0 to 0.24 in of
H2O) indicating that the model ventilation system designed and constructed by students as part
of their capstone project met the design specifications. The airflow rates per unit length of inlet
were also provided in the table. The total airflow rate (Q) for this inlet ranged from 0.0207 to
0.0283 m3/s (43.8 to 59.9 cfm) for common pressure differences for ventilation of agricultural
buildings (ΔP = 17.44 to 29.90 Pa or 0.07 to 0.12 in of H2O, MWPS, 1990).
Chastain, J. P. & Massey, H. F. (2020). A Model for Teaching Slot Inlet 19
Theory for Ventilation of Animal Housing Structures. Journal of Agricultural
Systems, Technology, and Management, 31, 9-25.Table 2. Sample data set collected for a ceiling inlet with w = 8.25 mm (0.325 in), L = 1.026 m
(40.39 in), T = 21.6 ºC (71 ºF) , and ρ = 1.198 kg/m3 (0.0748 lb/ft3)
ΔP Vinlet Q/L ΔP Vinlet Q/L
(in of H2O) (ft/min) (ft3/min/ft) (Pa) (m/s) (m3/s/m)
0 0 0 0 0 0
0.01 262 7.1 2.49 1.331 0.0110
0.03 357 9.7 7.48 1.814 0.0150
0.07 482 13.0 17.44 2.449 0.0202
0.08 579 15.7 19.93 2.942 0.0243
0.12 659 17.8 29.90 3.349 0.0276
0.17 786 21.3 42.36 3.994 0.0330
0.24 879 23.8 59.80 4.466 0.0369
0.24 896 24.3 59.80 4.553 0.0376
The discharge coefficient of an inlet was determined by plotting the measured inlet velocities
(Vinlet) versus the ideal velocity (Videal). The slope of the regression line was the empirically
determined value of Cd. A sample plot from a student’s laboratory report using the data in Table
2 was provided in Figure 8.
Figure 8. Application of linear regression to the data for the slot with w = 8.25 mm to determine
the discharge coefficient for a ceiling inlet. The discharge coefficient for this data set was 0.47.
For this value of w (8.25 mm) the discharge coefficient was 0.47 and the R2 was 0.9841. The
value of 0.47 was very close to the published average for a ceiling inlet of 0.50 in one of the
original studies (Albright, 1976). Such a high value of R2 was expected since the equation form
used to fit the data was obtained from Bernoulli’s equation. Additionally, any data set with a low
value of R2 was indicative of some systematic error in data collection, such as misreading an
instrument or making an error in recording a velocity or ΔP reading. If such systematic errors
were observed the experiment was required to be repeated. Such systematic errors were
avoided by careful experimental techniques and supervision of the students during each
laboratory period, and did not occur for the data sets included in this study.
Students were also required to provide a scatter plot of their velocity data with a line graph of
the inlet velocity equation (equation 5) using their empirically determined Cd. A sample plot from
Chastain, J. P. & Massey, H. F. (2020). A Model for Teaching Slot Inlet 20
Theory for Ventilation of Animal Housing Structures. Journal of Agricultural
Systems, Technology, and Management, 31, 9-25.a student’s report using the data from Table 2 and a discharge coefficient of 0.47 (from Figure
8) is provided in Figure 9. As was expected, the scatter about the line was nearly uniform.
This part of the laboratory was included to stress two concepts. One was the reliability of the
inlet velocity equation when used with the correct value of Cd. The other was to allow students
to observe scatter associated with small errors that always occur in experimentation. The ability
to visually compare the scatter in the data with the smooth line provided by the inlet equation
along with the elementary statistics used in curve fitting (Figure 8) provided a simple
introductory lesson in data evaluation.
Figure 9. Comparison of measured inlet velocities (Table 2) with velocities predicted using
Equation 5 with the empirically determined discharge coefficient of 0.47 (Figure 8).
Discharge Coefficients of Ceiling Inlets
The empirically determined discharge coefficients for all three values of w selected by the
students for the ceiling inlet were provided in Table 3. In all cases, the data sets provided high
values of R2 that ranged from 0.984 to 0.998. It can also be seen that the discharge coefficients
for all three of these inlets were within - 4% to 6% of the value of 0.50 published by Albright
(1976). Averaging the discharge coefficients for the three inlets gave a value of 0.50 and agreed
with Albright’s value perfectly. Additional data would be required to verify this observation.
Table 3. Empirically determined discharge coefficients for ceiling inlets.
Number of Coefficient of Discharge
Slot Width, w Aspect Ratio Observations Determination Coefficient
(mm) (w/L) Above Zero R2 Cd
8.25 0.0080 8 0.984 0.47
14.20 0.0131 7 0.988 0.52
19.00 0.0173 7 0.998 0.50
Average Cd = 0.50
Chastain, J. P. & Massey, H. F. (2020). A Model for Teaching Slot Inlet 21
Theory for Ventilation of Animal Housing Structures. Journal of Agricultural
Systems, Technology, and Management, 31, 9-25.The aspect ratio (w/L) of an inlet provided a dimensionless measure of the thinness of an inlet.
Inlets with very small aspect ratios have been shown to meet the assumption of being infinitely
long (Chastain et al., 1987). As the aspect ratio increased the inlet became squarer in cross-
section and the discharge coefficient has been observed to increase in previous studies
(Chastain et al., 1987). The value of L was about the same for all three ceiling inlets included in
this study. As a result, the aspect ratio increased from 0.0080 to 0.0173 as the value of w
increased. Based on a wide range of ventilation inlet examples provided by MWPS (1990) it was
determined that the aspect ratio for ceiling slot inlets used in most exhaust ventilated agricultural
buildings were from 0.00046 to 0.00326 depending on building length and the amount of airflow
provided by the fans. In general, winter ventilation rates were much smaller than mild weather or
summer ventilation rates (MWPS, 1990). Therefore, the aspect ratio of continuous baffled inlets
in a building increased as w was increased to accommodate the greater airflow requirements
during warm weather. These data indicated that a discharge coefficient of 0.50 can be used to
calculate velocities for a ceiling inlet with an aspect ratio up to about 0.0173.
Discharge Coefficients of Wall Inlets
Albright (1976) empirically determined that the average discharge coefficient for a wall inlet was
0.80. In order to determine if the wall inlet built into the model ventilation system behaved like
the one studied by Albright three groups of students collected data for three wall inlets that were
similar in size to the ceiling inlets described previously (Table 3). Discharge coefficients were
determined for the wall inlets and the results were given in Table 4. The average discharge
coefficient for the wall inlet was 0.50 and was identical to the ceiling inlet. It was concluded that
inlet orientation had no discernable impact on the discharge coefficient for the inlets constructed
in the model ventilation system.
Table 4. Empirically determined discharge coefficients for wall inlets.
Number of Coefficient of Discharge
Slot Width, w Aspect Ratio Observations Determination Coefficient
(mm) (w/L) Above Zero R2 Cd
8.30 0.0081 8 0.971 0.50
14.32 0.0132 5 0.991 0.49
19.26 0.0179 6 0.985 0.50
Average Cd = 0.50
The wall inlet constructed and tested by Albright (1976) must have been constructed in such a
way as to greatly reduce airflow resistance, or it had may have had a much larger aspect ratio
(w/L). The information provided in the original publication was not sufficient to determine why
the wall inlet that Albright constructed had a much larger discharge coefficient. It was concluded
that a discharge coefficient of 0.50 appears to be the best value to use for ventilation design for
wall or ceiling slot inlets unless other specific information justifies a higher value.
Decay of Maximum Air Jet Velocity with Inlet Velocity with Respect to Distance
A group of students were assigned the task of observing the reduction in the maximum air
velocity in a ceiling jet with respect to distance from the inlet. The students selected slot widths
(w) of 6.35, 15.88, and 22.23 mm. They established steady flow conditions and measured the
Vinlet for each case. They used the ports along the top of the inlet model to determine the
maximum velocity within the ceiling jet at 13, 20, 36, 51, and 66 cm from the inlet baffle. A plot
of the data for the three values of w, provided in Figure 10, indicated that the decay in maximum
velocity in the air jet had a similar shape for all thee cases. This similarity is more clearly seen in
the plot of the normalized velocities (Vmax/Vinlet) in Figure 11. The decay of jet velocity with
Chastain, J. P. & Massey, H. F. (2020). A Model for Teaching Slot Inlet 22
Theory for Ventilation of Animal Housing Structures. Journal of Agricultural
Systems, Technology, and Management, 31, 9-25.respect to distance from the inlet followed a common quadratic equation for all three values of w
with a surprisingly high value of R2 (0.937). The results showed that the maximum jet velocity
decreased to 80% of Vinlet at a distance of 40 cm from the inlet baffle. At 66 cm from the baffle
the maximum jet velocity decreased to 65% of Vinlet, a decay of 35%.
Figure 10. Variation of the maximum velocity in a ceiling jet with respect to distance from the
inlet baffle for three slot widths. Maximum velocity = Inlet velocity at x = 0.
Figure 11. Variation of the normalized maximum velocity in a ceiling jet with respect to distance
from the inlet baffle.
Chastain, J. P. & Massey, H. F. (2020). A Model for Teaching Slot Inlet 23
Theory for Ventilation of Animal Housing Structures. Journal of Agricultural
Systems, Technology, and Management, 31, 9-25.The observed behavior indicated that the zone of stable yet decreasing maximum air jet velocity
was obtained as defined by Albright (1990). The maximum length of stable jet zone was defined
as 100 times w (Albright, 1990) which suggested a jet length of 63.4 cm for the 6.35 mm
opening to 222.3 cm for the 22.23 mm opening. It appeared that the maximum jet length was
realized for the 6.35 mm inlet, but the model ventilation system was not wide enough for the
other two inlets.
Inlet velocities must be in the range of 3 to 4 m/s to provide for adequate mixing and throw
distance in mechanically ventilated animal facilities. If the velocity is too slow the inlet jet will not
have adequate energy for mixing, and cold air will fall quickly to animal level causing harmful
drafts (MWPS, 1990). The results from the model ventilation system were able to demonstrate
the rapid reduction that can occur in maximum jet velocity at distances away from the baffle and
reinforced the need for controlling inlet velocity as a part of ventilation system design.
Summary and Conclusion
A model ventilation system was constructed to provide a practical laboratory exercise to allow
students to learn about inlet theory in a hands-on manner. An adjustable ceiling and wall inlet
were built into the model and five small fans provided several airflow combinations. The design,
construction, and instrumentation of the model was described, and data collection procedures
and results from several student laboratory sessions were presented. The results from the data
collected by the students indicated the following.
The small fans selected were able to provide realistic airflow rates at pressure drops
ranging from 2.49 to 59.8 Pa (0.01 to 0.24 in of H2O), and inlet velocities up to 4.55 m/s
(896 fpm).
The empirically determined discharge coefficients for the ceiling inlet averaged 0.50 for
slot widths in the range of 8.25 to 19.00 mm (0.325 to 0.748 in). This was identical to the
empirical value from the literature for a ceiling inlet.
The average discharge coefficient of the wall inlet was also found to be 0.50 for slot
widths ranging from 8.30 to 19.26 mm (0.327 to 0.758 in). The only difference between
the construction of the ceiling and wall inlets used in these experiments was the 90-
degree difference in orientation. It was concluded that the discharge coefficient was the
same regardless of orientation for the inlets as fabricated. Previous work indicated that a
value of 0.80 was to be expected for a wall inlet which would indicate that the inlet used
in the older study provided less resistance to airflow for some unknown reason.
Three data sets were collected to observe the decay of maximum air jet velocity with
respect to distance from the inlet baffle. The normalized maximum velocity for all three
tests (Vmax/Vinlet) correlated well with distance from the inlet baffle (R2 = 0.937). At 66 cm
from the inlet baffle the maximum jet velocity had decayed by 35%.
Overall, the model ventilation system provided a means for students in Agricultural
Mechanization and Business to learn about inlet theory and ventilation performance in an
experiential manner. Collection and analysis of the data, and presentation of the results
provided students a meaningful application of mathematics, physics, and an introduction to
reporting of technical information. The model and associated instrumentation worked well and
will be used to take additional data for inlets over a wider range of opening values (w) to verify
these results.
Chastain, J. P. & Massey, H. F. (2020). A Model for Teaching Slot Inlet 24
Theory for Ventilation of Animal Housing Structures. Journal of Agricultural
Systems, Technology, and Management, 31, 9-25.Acknowledgements
Logan Hewitt and Eric Julian along with the authors designed and constructed the inlet theory
model as part of the senior capstone course in Agricultural Mechanization and Business (AGM
4720). The students in two semesters of the course Environmental Control in Animal Structures
(AGM 4050) provided data collection and analysis for determination of the discharge coefficient.
References
Albright, L.D. (1990). Environmental Control for Animals and Plants. St. Joseph, Mich.: ASABE.
Albright, L.D. (1976). Airflow through hinged baffle slot inlets. TRANSACTIONS of the ASAE, 19(4):
728-732,735.
Chastain, J.P., D.G. Colliver, and P.W. Winner. (1987). Computation of discharge coefficients for
laminar flow in rectangular and cylindrical openings. ASHRAE Transactions, 93(2B):2259-2283.
Hellickson, M.A., and J.N. Walker. (1983). Ventilation of Agricultural Structures. St. Joseph, Mich.:
ASABE.
Holman, J.P. (1976). Heat Transfer (4th ed.). New York, NY: McGraw-Hill Book Company.
Millier, W.F. (1950). The ventilation of dairy stables with electric fans. Ph.D. diss., Itaca, NY: Cornell
University Libraries.
MWPS (1990). Mechanical Ventilating Systems for Livestock Housing (MWPS-32). Ames, IA: MidWest
Plan Service, Iowa State University.
Chastain, J. P. & Massey, H. F. (2020). A Model for Teaching Slot Inlet 25
Theory for Ventilation of Animal Housing Structures. Journal of Agricultural
Systems, Technology, and Management, 31, 9-25.You can also read