Molecular Transport across Lipid Membranes Controls Cell-Free Expression Level and Dynamics
←
→
Page content transcription
If your browser does not render page correctly, please read the page content below
bioRxiv preprint first posted online Apr. 12, 2019; doi: http://dx.doi.org/10.1101/606863. The copyright holder for this preprint
(which was not peer-reviewed) is the author/funder, who has granted bioRxiv a license to display the preprint in perpetuity.
                              It is made available under a CC-BY-NC-ND 4.0 International license.

   Molecular Transport across Lipid Membranes Controls Cell-Free
   Expression Level and Dynamics

   Patrick M. Caveney1,2, Rosemary M. Dabbs2, William T. McClintic1,2, C. Patrick Collier1, Michael
   L. Simpson*,1,2

   1
     Center for Nanophase Materials Sciences, Oak Ridge National Laboratory, Oak Ridge, TN,
   37831, USA
   2
     Bredesen Center for Interdisciplinary Research and Graduate Education, University of
   Tennessee Knoxville/Oak Ridge National Laboratory, Knoxville, TN, 37996, USA
   *
     Corresponding author: SimpsonML1@ornl.gov

                                                Summary
   Essential steps toward synthetic cell-like systems require controlled transport of molecular
   species across the boundary between encapsulated expression and the external environment.
   When molecular species (e.g. small ions, amino acids) required for expression (i.e. expression
   resources) may cross this boundary, this transport process plays an important role in gene
   expression dynamics and expression variability. Here we show how the location (encapsulated
   or external) of the expression resources controls the level and the dynamics of cell-free protein
   expression confined in permeable lipid vesicles. Regardless of the concentration of
   encapsulated resources, external resources were essential for protein production. Compared to
   resource poor external environments, plentiful external resources increased expression by ~7-
   fold, and rescued expression when internal resources were lacking. Intriguingly, the location of
   resources and the membrane transport properties dictated expression dynamics in a manner
   well predicted by a simple transport-expression model. These results suggest membrane
   engineering as a means for spatio-temporal control of gene expression in cell-free synthetic
   biology applications and demonstrate a flexible experimental platform to understand the
   interplay between membrane transport and expression in cellular systems.

                                                  Keywords
   Cell-free, lipid vesicles, synthetic biology, membrane permeability

                                               Introduction
   Confined cell-free gene expression systems (Karim and Jewett, 2016; Moore et al., 2018;
   Pardee et al., 2016; Shin and Noireaux, 2012; Siegal-Gaskins et al., 2014; Siuti et al., 2011) are
   making strides (Perez et al., 2016) toward cell-like capabilities (Scott et al., 2016; Trifonov,
   2011). Recent reports demonstrate important steps along this path, including genome
   replication (Sakatani et al., 2015), metabolism (Garcia et al., 2018), adaptation (Yoshiyama et
   al., 2018), and growth (Exterkate et al., 2017). However, little work has been reported on one of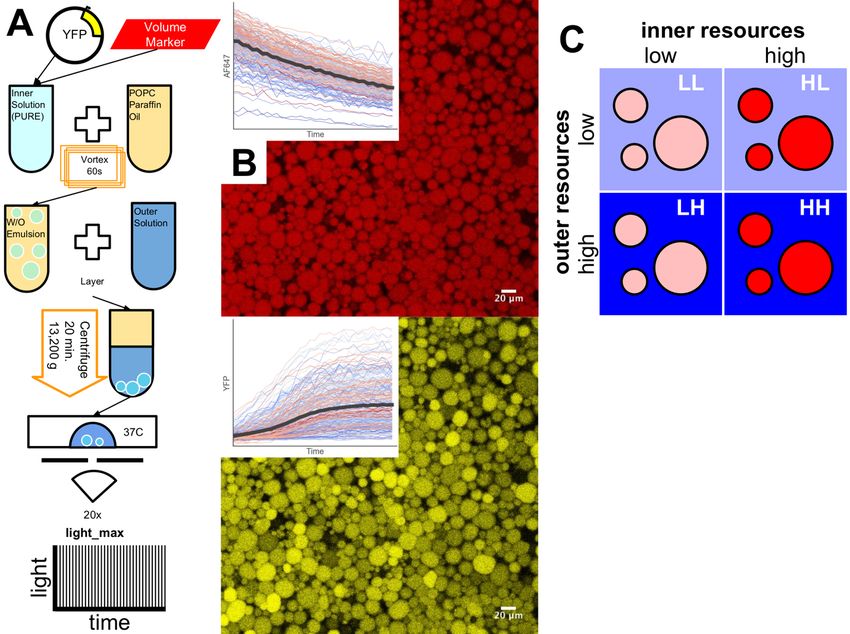
bioRxiv preprint first posted online Apr. 12, 2019; doi: http://dx.doi.org/10.1101/606863. The copyright holder for this preprint
(which was not peer-reviewed) is the author/funder, who has granted bioRxiv a license to display the preprint in perpetuity.
                              It is made available under a CC-BY-NC-ND 4.0 International license.

   the key next steps – controlled molecular interactions with the external environment (Collier and
   Simpson, 2011).

   This communication across the membrane is essential for highly complex cellular functions such
   as chemotaxis (Van Haastert and Devreotes, 2004), symbiosis (Braga et al., 2016), and
   collective action (e.g. biofilm formation (Flemming et al., 2016)). For cell-like systems, essential
   next steps like energy harvesting, require the controlled trafficking of molecules across the
   boundary between cell-like system and the external world. Recent work demonstrates the use of
   pore-forming proteins (Chalmeau et al., 2011; Noireaux and Libchaber, 2004) or optical
   treatment of vesicles (Caveney et al., 2019) to engineer transport across lipid membranes.
   When these transport processes involve molecules that support protein synthesis (e.g. ions,
   nucleotides, amino acids), transport and gene expression dynamics become entwined (Figure
   1A).

   Gene expression in cell-like systems is a function of both encapsulated and external expression
   resources (Figure 1B). Recently, we demonstrated an optical treatment protocol to make vesicle
   membranes uniformly permeable to molecules relevant to protein expression (Caveney et al.,
   2019). This technique reduced vesicle-to-vesicle variability in protein expression by making
   membrane transport properties uniform and by reducing the effects of stochastic seeding of the
   encapsulated resources. However, permeable membranes change the dynamics of gene
   expression by accentuating the role of molecular transport across the membrane. Here we show
   how the location (encapsulated or external) of the expression resources controlled the level and
   the dynamics of cell-free protein expression confined in permeable lipid vesicles. Regardless of
   the concentration of encapsulated resources, external resources were essential for protein
   production, increasing expression levels by ~7-fold. By sourcing essential molecular species,
   resource-rich external environments rescued expression when internal resources were lacking.
   Intriguingly, the location of resources and the membrane transport properties dictated
   expression dynamics in a manner well predicted by a simple transport-expression model. Since
   the membrane transport properties may be controlled in space and time using a simple optical
   treatment (Caveney et al., 2019), these results demonstrate the means for predictive spatio-
   temporal control of gene expression in cell-free synthetic biology applications. Furthermore, the
   experiments described here show a flexible experimental platform to understand the interplay
   between membrane transport and expression in individual cells or in groups of cells working
   cooperatively through cell-to-cell molecular signaling.

                                        Results and Discussion
   To study the dynamics of protein expression in permeable lipid vesicles, we tracked cell-free
   expression of Yellow Fluorescent Protein (YFP) confined in optically-permeabilized (Caveney et
   al., 2019) vesicles (Figure 2A and 2B; Methods). Vesicles were created by the emulsion-transfer
   method described previously (Caveney et al., 2016; Nishimura et al., 2014a; Noireaux and
   Libchaber, 2004). Briefly, an inner solution composed of the PURE system (Shimizu et al.,
   2001), a YFP encoding plasmid, pEToppY, and a fluorescent volume marker, AF647 conjugated
   to transferrin, were vortexed in paraffin oil containing 1-palmitoyl-2-oleoyl-glycero-3-
   phosphocholine (POPC) to create reverse micelles. The reverse micelles were centrifuged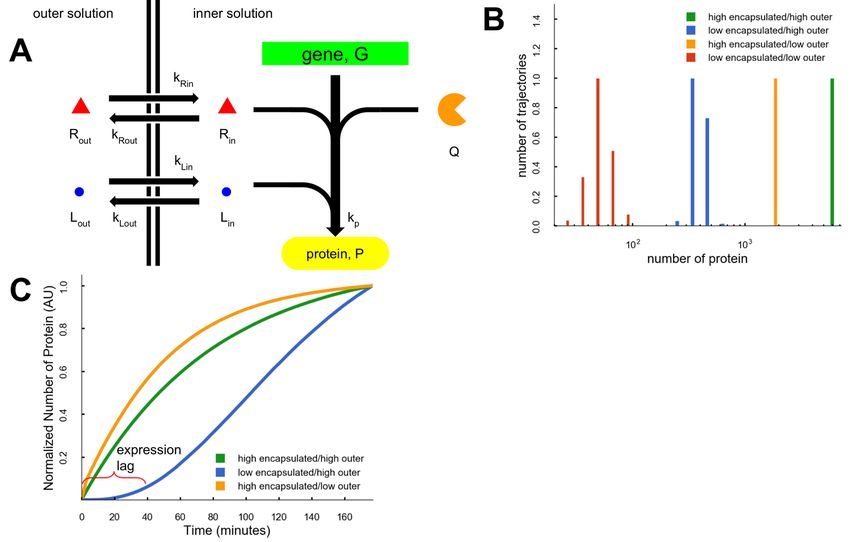
bioRxiv preprint first posted online Apr. 12, 2019; doi: http://dx.doi.org/10.1101/606863. The copyright holder for this preprint
(which was not peer-reviewed) is the author/funder, who has granted bioRxiv a license to display the preprint in perpetuity.
It is made available under a CC-BY-NC-ND 4.0 International license.
through an oil-water interface into the outer solution to create vesicles (Figure 2A). Vesicles
were imaged with z-stacks of 20 slices every 3 minutes for a 3-hour period using a Zeiss, LSM
710 confocal laser scanning microscope. This imaging protocol, light_max, permeabilizes the
lipid membranes, allowing the transport of molecular species (e.g. nucleotides, amino acids)
essential for expression (Caveney et al., 2019). The images of the AF647 at each time point
(Figure 2B, Top) were used to locate individual vesicles possessing distinct boundaries with
minimal overlap with neighboring vesicles. The dynamics of protein expression were inferred
from the time histories (Figure 2B, Bottom Inset) of the measured YFP fluorescence (Figure 2B,
Bottom) from these ROIs.
We performed experiments using protocols defined by the concentrations (high (H) or low (L);
Methods) of resources encapsulated within vesicles and those in the outer solution (Figure 2C).
This led to four types of experiments: (1) Low encapsulated/low outer (LL); (2) High
encapsulated/low outer (HL); (3) Low encapsulated/high outer (LH); and (4) High
encapsulated/high outer (HH). After 2 hours, when protein expression had stopped, the YFP
fluorescence resulting from the LL protocol was nearly indistinguishable from background,
indicating very low gene expression activity (Figure 3A). Conversely, three of these protocols
(HL, LH, and HH) led to significant protein expression activity as indicated by YFP fluorescence
levels measurably above background (Figure 3B-D). These results indicate that if the
expression resources were available, either encapsulated or within the outer solution, gene
expression occurred. Yet, the location of the resources controlled both the level (Figure 3E) and
the dynamics (Figure 3F) of expression.
With the benefit of a full complement of both encapsulated and external resources, the HH
protocol led to the highest level of gene expression (Figure 3D). In agreement with a previous
report (Carrara et al., 2018), high resource concentrations were essential to maximizing protein
production as expression in the HH condition was nearly ~7-fold greater than either of the other
two productive protocols. Intriguingly, HL and LH protocols produced similar levels of total
protein at the 2-hour mark (Figure 3B, C, and E), yet displayed very different expression
dynamics (Figure 3F). Regardless of the outer solution resource concentration, a high
concentration of encapsulated resources led to a rapid onset of expression (Figure 3F).
Conversely, expression in the low encapsulated resource environment was rescued by a high
concentration of external resources, but only after a considerable delay (Figure 3F).
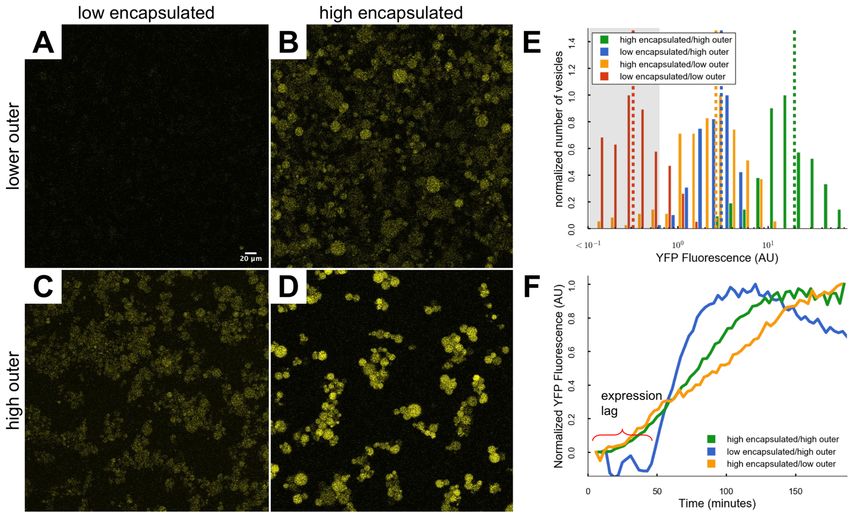
To better understand the dynamics of cell-free gene expression in permeable vesicles, we
constructed a model that accounted for molecular transport across the membrane (Figure 4A).
This model included three types of molecular species important in the expression process: (Q)
encapsulated molecules (e.g. ribosomes, RNAP) that do not cross the membrane (immobile);
(L) highly transportable species (e.g. small ions) that were both encapsulated and in the outer
solution that readily crossed the membrane (highly mobile); and (R) slowly transported species
(e.g. amino acids, nucleotides) that were both encapsulated and in the outer solution (lowly
mobile). In the model, the internal concentration of these three species and the known decay in
expression capacity with time (Caveney et al., 2016; Sun et al., 2013) controlled the rate of
gene expression. The time dependence of expression capacity was modeled as an exponentialbioRxiv preprint first posted online Apr. 12, 2019; doi: http://dx.doi.org/10.1101/606863. The copyright holder for this preprint
(which was not peer-reviewed) is the author/funder, who has granted bioRxiv a license to display the preprint in perpetuity.
It is made available under a CC-BY-NC-ND 4.0 International license.
decay (rate constant kp = 0.00001*e -0.0125*t). The internal concentration of immobile species was
set by the initial conditions (either high or low) and remained constant throughout the simulation
(SI Figure 1D). The internal concentrations of the two mobile species (L) and (R) reached
equilibrium with the external concentration of these species after a delay time set by the
transport rates (SI Figure 1A-C). Since the highly mobile species were expected to equilibrate
with the outer solution very quickly, this rate constant was set high (kLin/out=0.1*t). The lowly
mobile rate constant was found by fitting to the transport transient of fluorescein into vesicles
from the outer solution (Methods, SI Figure 2D). This resulted in time-variant transport process
described by kRin/out=0.00019*t, where transport across the membrane for the lowly mobile
species increased with increased light exposure.
Gillespie simulations (Gillespie, 1977) of expression were run using the model for four
conditions approximating the experimental HH, HL, LH, and LL protocols, and simulation results
reproduced the major experimental behaviors. Similar to experiments, the HH simulations
resulted in the most protein. HL and LH simulations resulted in ~3.4x and 14x less protein than
HH (Figure 4B). Further, the HH and HL simulations (most encapsulated resources), had a rapid
initial rise in protein production while the LH model has a significant time lag (Figure 4C) caused
by the delayed arrival of the lowly mobile species. The variation in the amounts of protein made
in the different modeling conditions was caused by the interplay between the time that
resources arrived in the vesicle and the exponential decay in protein expression capacity.
Perhaps cell and cell-free synthetic biology differ most in the emphasis each place either on
gene circuits or on the environment in which gene circuits reside. Cell-free synthetic biology is
placing ever greater emphasis on controlling the gene circuit environment by manipulating
confinement volume (Caveney et al., 2016), degree of macromolecular crowding (Norred et al.,
2018), and the composition of cell extract (Garcia et al., 2018). A defining feature of the gene
circuit environment in cells is the controlled transport of molecules across membranes. Such
interplay between membrane transport and gene expression in cells play important roles in
expression variability (Hansen et al., 2018a) and complex functionality like probabilistic fate
determination (Hansen et al., 2018b). Furthermore, cells use membrane transport to take in
energy molecules, sense the environment (Van Haastert and Devreotes, 2004), coordinate
population behavior (e.g. quorum sensing (Miller and Bassler, 2001)), and share genetic
material (e.g. horizontal gene transfer (Gogarten and Townsend, 2005)). It is an intriguing
possibility that membrane engineering for controlled molecular transport between encapsulated
and external cell-free expression environments may enable essential next steps toward
synthetic systems that approach cell-like functional complexity.
Methods
Vesicle Preparation
Vesicles were made using the oil-in-water emulsion technique (Noireaux and Libchaber, 2004;
Pautot et al., 2003) (Figure 2A). This method encapsulated a protein expressing inner solution
in vesicles separated from an osmotically balanced outer solution. The inner solution was
prepared using 10 µL Solution A and 7.5 µL Solution B of the PURExpress In Vitro ProteinbioRxiv preprint first posted online Apr. 12, 2019; doi: http://dx.doi.org/10.1101/606863. The copyright holder for this preprint
(which was not peer-reviewed) is the author/funder, who has granted bioRxiv a license to display the preprint in perpetuity.
It is made available under a CC-BY-NC-ND 4.0 International license.
Synthesis Kit from New England Biolabs; 5 µL of sucrose solution (1 M); 0.25 µL of Transferrin-
AlexaFluor 647; 0.125 µL of RNAsin (40 U/µL); 0.418 µL (1.67 nM) of YFP encoding pEToppY
plasmid (Nishimura et al., 2014b) (200 ng; 478.2 ng/µL stock); and nuclease-free water to bring
the total volume of solution to 30 µL. The inner solution was vortexed in 330 µL of paraffin oil
containing 30 mg of POPC for 60 seconds. The resulting emulsion was layered above the outer
solution and centrifuged at 13,000 g for 20 minutes at room temperature. The low concentration
inner solutions were made diluting Solution A and Solution B with nuclease-free water to 1/3
their standard concentrations.
Outer Solution Preparation
The outer solution for vesicles was mixed from frozen stocks before each experiment. 1.5 µL
Amino acid solution, 11.3 µL of ATP (100 mM), 7.5 µL of GTP (100 mM), 0.75 µL of CTP (500
mM), 0.75 µL of UTP (500 mM), 1.8 µL of spermidine (250 mM), 3.75 µL of creatine phosphate
(1 M), 4.5 µL of Dithiothreitol (100 mM), 0.75 µL of Folinic Acid (0.5 M), 24 µL of potassium
glutamate (3.5 M), 11.3 µL of magnesium acetate (0.5 M), 30 µL of HEPES (1 M), 60 µL of
glucose (1 M), and 141.8 µL of autoclaved type I pure water for a total volume of 300 µL. The
low concentration outer solutions were made by diluting the entire outer solution to 1/3 its
standard concentration.
Vesicle Imaging
Fluorescent images were obtained using a confocal microscope to track YFP expression and
AF647 fluorescence for three hours (Figure 2B and 2B inset). The pellet of vesicles was
collected with 100 µL of the outer solution and pipetted onto a no. 1.5 glass bottom petri dish.
The lid was placed on the petri dish to minimize airflow and evaporation of the 100 µL outer
solution and vesicle drop. Vesicles were imaged with the light_max protocol (Caveney et al.,
2019). The petri dish was placed on a Zeiss LSM710 confocal scanning microscope with an
incubation chamber warmed to 37°C and imaged every 3 minutes in a z-stack with a 20x air
objective. Vesicles were imaged with three lasers: a 405 nm, 6.5 mW laser; YFP was excited
with a 488 nm, 6.1 mW laser and fluorescent emission was collected from 515-584 nm; and
AF647 was excited with a 633 nm, 1.67 mW laser and fluorescent emission was collected from
638-756 nm. Z-stacks were made of ~21 slices at 1 µm intervals, and the aperture for each slice
was 1.00 Airy Units (open enough to allow ~1.5 µm depth of light). The time the vesicles sat on
the microscope before imaging was minimized (less than 15 minutes), allowing for imaging for
most of the duration of protein expression.
Data Acquisition and Analysis
Average fluorescent intensities were measured with the FIJI TrackMate (Tinevez et al., 2017)
(v3.8.0) plugin. TrackMate found spots with an estimated blob diameter of 10 µm using the
Laplacian of Gaussian detector. Spots that were found with an estimated diameter 19
µm, or contrast 5µm between frames, or tracked forbioRxiv preprint first posted online Apr. 12, 2019; doi: http://dx.doi.org/10.1101/606863. The copyright holder for this preprint
(which was not peer-reviewed) is the author/funder, who has granted bioRxiv a license to display the preprint in perpetuity.
It is made available under a CC-BY-NC-ND 4.0 International license.
Determining Vesicles Indistinguishable from Background
Background ROIs were determined from the AF647, volume marker, channel. Intensity of these
ROIs was measured in the YFP channel. A sample of vesicles with clearly defined edges by eye
in the AF647 channel but no clear edges by eye in the YFP channel were measured for their
YFP intensity. This value, 0.6147 AU, was slightly above the background value measured and
was used as a cut-off for vesicles that were indistinguishable from background fluorescence.
Measuring the Transient of Membrane Permeability
To investigate the temporal dynamics of membrane transport across the permeabilized
membranes, fluorophores were added to the outer solution instead of the inner solution, detailed
in (Caveney et al., 2019). Three fluorophores were used, fluorescein (~332 Da), AF633 (~1.2
kDa), and AF647 conjugated to transferrin (~80 kDa), to span the range of protein expression
resources, amino acids (~110 Da), nucleotides (~650 Da), proteins (>20 kDa). Fluorescein
crossed the membrane in all vesicles by the end of the experiment (SI Figure 2A). The vesicle in
the black box is representative. AF633 had vesicles with three behaviors (SI Figure 2B) vesicles
in boxes are representative). Behavior (1) vesicles began with high concentrations of AF633
and photobleached. Behavior (2) vesicles started with no AF633 and increased in fluorescence.
Behavior (3) vesicles did not increase in fluorescence throughout the experiment. AF647 did not
cross the membrane during the experiments (SI Figure 2C). These results show all vesicles are
permeable to small molecules but are impermeable to larger molecules.
On average, fluorescence of AF633 and AF647 in vesicles did not increase during the
experiment, however fluorescein increased (SI Figure 2D). The fluorescein curve was fit by
functions derived from different models of membrane permeabilization. The dashed line
assumed first order reaction kinetics, the solid and dotted lines assume permeability increases
with time either linearly or sigmoidally. The fluorescein data were better fit by models where
permeability increases as the vesicles are exposed to more light.
Model of Protein Expression in Permeabilized Vesicles
Protein expression inside permeabilized vesicles was modeled with a Gillespie simulation
(Gillespie 1977). The model had four populations required to make protein: genes, G, that could
not cross the membrane; large resources, Q, that could not cross the membrane; small
molecules, R, that could cross the membrane slowly; and very small molecules, L, that could
rapidly cross the membrane (SI Figure 1A-D). For all simulations G=10. The initial resource
populations, Q, Rin, Lin, Rout, and Lout, in the high concentration conditions were equal to 100.
The initial resource populations, Q, Lin, Rout, and Lout, in the low concentration conditions were
equal to 33. The initial Rin populations in the low concentration conditions were equal to 0 to
model a depletion of inner resources before much protein could be made. The outer solution
concentrations, Rout and Lout, were assumed to be constant (SI Figure 3D) because the outer
solution volume is much larger than the inner solution volume. Each of the four resource
conditions was run for 100 trajectories. Each trajectory was simulated for 180 minutes and
sampled every three minutes just as in the experiments.bioRxiv preprint first posted online Apr. 12, 2019; doi: http://dx.doi.org/10.1101/606863. The copyright holder for this preprint
(which was not peer-reviewed) is the author/funder, who has granted bioRxiv a license to display the preprint in perpetuity.
It is made available under a CC-BY-NC-ND 4.0 International license.
Acknowledgements
This research was conducted at the Center for Nanophase Materials Sciences, which is a DOE
Office of Science User Facility. P.M.C. and S.E.N. also acknowledge Graduate Fellowships from
the Bredesen Center for Interdisciplinary Research and Graduate Education, University of
Tennessee, Knoxville. The authors would like to thank Osaka University and Dr. Tetsuya Yomo
for providing pEToppYB plasmid, and Dr. Maike Hansen and the Dr. Leor Weinberger laboratory
for useful discussions.
Author Contributions
Conceptualization, P.M.C., C.P.C., and M.L.S.; Methodology, P.M.C., C.P.C., and M.L.S.;
Software, P.M.C.; Formal Analysis, P.M.C., M.L.S.; Investigation, P.M.C., R.M.D.; Writing -
Original Draft, P.M.C., W.T.M., and M.L.S.; Writing - Reviewing and Editing, P.M.C. and M.L.S.;
Visualization, P.M.C.; Supervision, C.P.C., M.L.S.; Funding Acquisition, M.L.S.
Declaration of Interests
The authors declare no competing interests.bioRxiv preprint first posted online Apr. 12, 2019; doi: http://dx.doi.org/10.1101/606863. The copyright holder for this preprint
(which was not peer-reviewed) is the author/funder, who has granted bioRxiv a license to display the preprint in perpetuity.
It is made available under a CC-BY-NC-ND 4.0 International license.
References
Braga, R.M., Dourado, M.N., and Araújo, W.L. (2016). Microbial interactions: ecology in a
molecular perspective. Braz. J. Microbiol. 47, 86–98.
Carrara, P., Altamura, E., D’Angelo, F., Mavelli, F., and Stano, P. (2018). Measurement and
numerical modeling of cell-free protein synthesis: combinatorial block-variants of the PURE
system. Data 3, 41.
Caveney, P.M., Norred, S.E., Chin, C.W., Boreyko, J.B., Razooky, B.S., Retterer, S.T., Collier,
C.P., and Simpson, M.L. (2016). Resource Sharing Controls Gene Expression Bursting. ACS
Synth. Biol.
Caveney, P.M., Dabbs, R.M., McClintic, W.T., Norred, S.E., Collier, C.P., and Simpson, M.L.
(2019). Controlling Cell-Free Gene Expression Behavior by Tuning Membrane Transport
Properties. BioRxiv 604454.
Chalmeau, J., Monina, N., Shin, J., Vieu, C., and Noireaux, V. (2011). α-Hemolysin pore
formation into a supported phospholipid bilayer using cell-free expression. Biochim. Biophys.
Acta BBA-Biomembr. 1808, 271–278.
Collier, C.P., and Simpson, M.L. (2011). Micro/nanofabricated environments for synthetic
biology. Curr. Opin. Biotechnol. 22, 516–526.
Exterkate, M., Caforio, A., Stuart, M.C., and Driessen, A.J. (2017). Growing membranes in vitro
by continuous phospholipid biosynthesis from free fatty acids. ACS Synth. Biol. 7, 153–165.
Flemming, H.-C., Wingender, J., Szewzyk, U., Steinberg, P., Rice, S.A., and Kjelleberg, S.
(2016). Biofilms: an emergent form of bacterial life. Nat. Rev. Microbiol. 14, 563.
Garcia, D.C., Mohr, B.P., Dovgan, J.T., Hurst, G.B., Standaert, R.F., and Doktycz, M.J. (2018).
Elucidating the potential of crude cell extracts for producing pyruvate from glucose. Synth. Biol.
3, ysy006.
Gillespie, D.T. (1977). Exact stochastic simulation of coupled chemical reactions. J. Phys.
Chem. 81, 2340–2361.
Gogarten, J.P., and Townsend, J.P. (2005). Horizontal gene transfer, genome innovation and
evolution. Nat. Rev. Microbiol. 3, 679.
Hansen, M.M., Desai, R.V., Simpson, M.L., and Weinberger, L.S. (2018a). Cytoplasmic
amplification of transcriptional noise generates substantial cell-to-cell variability. Cell Syst. 7,
384–397.
Hansen, M.M., Wen, W.Y., Ingerman, E., Razooky, B.S., Thompson, C.E., Dar, R.D., Chin,
C.W., Simpson, M.L., and Weinberger, L.S. (2018b). A post-transcriptional feedback
mechanism for noise suppression and fate stabilization. Cell 173, 1609–1621.
Karim, A.S., and Jewett, M.C. (2016). A cell-free framework for rapid biosynthetic pathway
prototyping and enzyme discovery. Metab. Eng. 36, 116–126.bioRxiv preprint first posted online Apr. 12, 2019; doi: http://dx.doi.org/10.1101/606863. The copyright holder for this preprint
(which was not peer-reviewed) is the author/funder, who has granted bioRxiv a license to display the preprint in perpetuity.
It is made available under a CC-BY-NC-ND 4.0 International license.
Miller, M.B., and Bassler, B.L. (2001). Quorum sensing in bacteria. Annu. Rev. Microbiol. 55,
165–199.
Moore, S.J., MacDonald, J.T., Wienecke, S., Ishwarbhai, A., Tsipa, A., Aw, R., Kylilis, N., Bell,
D.J., McClymont, D.W., and Jensen, K. (2018). Rapid acquisition and model-based analysis of
cell-free transcription–translation reactions from nonmodel bacteria. Proc. Natl. Acad. Sci.
201715806.
Nishimura, K., Matsuura, T., Sunami, T., Fujii, S., Nishimura, K., Suzuki, H., and Yomo, T.
(2014a). Identification of giant unilamellar vesicles with permeability to small charged molecules.
RSC Adv. 4, 35224–35232.
Nishimura, K., Tsuru, S., Suzuki, H., and Yomo, T. (2014b). Stochasticity in gene expression in
a cell-sized compartment. ACS Synth. Biol. 4, 566–576.
Noireaux, V., and Libchaber, A. (2004). A vesicle bioreactor as a step toward an artificial cell
assembly. Proc. Natl. Acad. Sci. U. S. A. 101, 17669–17674.
Norred, S.E., Caveney, P.M., Chauhan, G., Collier, L.K., Collier, C.P., Abel, S.M., and Simpson,
M.L. (2018). Macromolecular Crowding Induces Spatial Correlations That Control Gene
Expression Bursting Patterns. ACS Synth. Biol.
Pardee, K., Green, A.A., Takahashi, M.K., Braff, D., Lambert, G., Lee, J.W., Ferrante, T., Ma,
D., Donghia, N., and Fan, M. (2016). Rapid, low-cost detection of Zika virus using
programmable biomolecular components. Cell 165, 1255–1266.
Pautot, S., Frisken, B.J., and Weitz, D.A. (2003). Production of unilamellar vesicles using an
inverted emulsion. Langmuir 19, 2870–2879.
Perez, J.G., Stark, J.C., and Jewett, M.C. (2016). Cell-free synthetic biology: engineering
beyond the cell. Cold Spring Harb. Perspect. Biol. 8, a023853.
Sakatani, Y., Ichihashi, N., Kazuta, Y., and Yomo, T. (2015). A transcription and translation-
coupled DNA replication system using rolling-circle replication. Sci. Rep. 5, 10404.
Scott, A., Noga, M.J., de Graaf, P., Westerlaken, I., Yildirim, E., and Danelon, C. (2016). Cell-
free phospholipid biosynthesis by gene-encoded enzymes reconstituted in liposomes. PloS One
11, e0163058.
Shimizu, Y., Inoue, A., Tomari, Y., Suzuki, T., Yokogawa, T., Nishikawa, K., and Ueda, T.
(2001). Cell-free translation reconstituted with purified components. Nat. Biotechnol. 19, 751–
755.
Shin, J., and Noireaux, V. (2012). An E. coli cell-free expression toolbox: application to synthetic
gene circuits and artificial cells. ACS Synth. Biol. 1, 29–41.
Siegal-Gaskins, D., Tuza, Z.A., Kim, J., Noireaux, V., and Murray, R.M. (2014). Gene circuit
performance characterization and resource usage in a cell-free “breadboard.” ACS Synth. Biol.
3, 416–425.bioRxiv preprint first posted online Apr. 12, 2019; doi: http://dx.doi.org/10.1101/606863. The copyright holder for this preprint
(which was not peer-reviewed) is the author/funder, who has granted bioRxiv a license to display the preprint in perpetuity.
It is made available under a CC-BY-NC-ND 4.0 International license.
Siuti, P., Retterer, S.T., and Doktycz, M.J. (2011). Continuous protein production in nanoporous,
picolitre volume containers. Lab. Chip 11, 3523–3529.
Sun, Z.Z., Hayes, C.A., Shin, J., Caschera, F., Murray, R.M., and Noireaux, V. (2013). Protocols
for implementing an Escherichia coli based TX-TL cell-free expression system for synthetic
biology. J. Vis. Exp. JoVE.
Tinevez, J.-Y., Perry, N., Schindelin, J., Hoopes, G.M., Reynolds, G.D., Laplantine, E.,
Bednarek, S.Y., Shorte, S.L., and Eliceiri, K.W. (2017). TrackMate: An open and extensible
platform for single-particle tracking. Methods 115, 80–90.
Trifonov, E.N. (2011). Vocabulary of definitions of life suggests a definition. J. Biomol. Struct.
Dyn. 29, 259–266.
Van Haastert, P.J., and Devreotes, P.N. (2004). Chemotaxis: signalling the way forward. Nat.
Rev. Mol. Cell Biol. 5, 626.
Yoshiyama, T., Ichii, T., Yomo, T., and Ichihashi, N. (2018). Automated in vitro evolution of a
translation-coupled RNA replication system in a droplet flow reactor. Sci. Rep. 8, 11867.bioRxiv preprint first posted online Apr. 12, 2019; doi: http://dx.doi.org/10.1101/606863. The copyright holder for this preprint
(which was not peer-reviewed) is the author/funder, who has granted bioRxiv a license to display the preprint in perpetuity.
It is made available under a CC-BY-NC-ND 4.0 International license.
Figure 1. Resource location (internal or external) affects gene expression behavior. (A)
Gene expression is affected by the encapsulated (orange circular sector) and external (red
triangle) molecular resources. (B) The gene expression transient is the sum of two components:
one controlled by the internal resource concentration and one controlled by external resource
concentration. The expression transient due to external resources should experience a delay
(labeled here as expression lag) related to the membrane transport properties.bioRxiv preprint first posted online Apr. 12, 2019; doi: http://dx.doi.org/10.1101/606863. The copyright holder for this preprint
(which was not peer-reviewed) is the author/funder, who has granted bioRxiv a license to display the preprint in perpetuity.
It is made available under a CC-BY-NC-ND 4.0 International license.
Figure 2. Gene expression in permeable lipid membranes with differing location of
expression resources. (A) Method for making and imaging vesicles. Vesicles were imaged
using a protocol, light_max, to cause membrane permeability (Caveney et al., 2019). (B)
Representative images of the AF647 volume marker and YFP fluorescence in vesicles. Insets
show transient behavior of AF647 (photobleaching decay) and YFP fluorescence. (C) Varying
the location of essential gene expression resources by changing inner and outer solution
concentrations.bioRxiv preprint first posted online Apr. 12, 2019; doi: http://dx.doi.org/10.1101/606863. The copyright holder for this preprint
(which was not peer-reviewed) is the author/funder, who has granted bioRxiv a license to display the preprint in perpetuity.
It is made available under a CC-BY-NC-ND 4.0 International license.
Figure 3. Expression resource location controls gene expression level and dynamics. (A)
The t=2 hour image of YFP expressed with the low encapsulated/low outer concentration
condition. (B) The t=2 hour image of YFP expressed with the high encapsulated/low outer
concentration condition. (C) The t=2 hour image of YFP expressed under the low
encapsulated/high outer concentration condition. (D) The t=2 hour image of YFP expressed
under the high encapsulated/high outer condition. (E) Distributions of YFP produced under each
of the four resource concentration conditions. The dashed vertical lines indicate the means of
each distributions. Gray shaded region denotes vesicles with YFP intensities indistinguishable
from the background. (F) Average transient behavior of vesicles under the three conditions that
produced significant amounts of protein.bioRxiv preprint first posted online Apr. 12, 2019; doi: http://dx.doi.org/10.1101/606863. The copyright holder for this preprint
(which was not peer-reviewed) is the author/funder, who has granted bioRxiv a license to display the preprint in perpetuity.
It is made available under a CC-BY-NC-ND 4.0 International license.
Figure 4. Model of protein expression with resources divided by a permeable membrane.
(A) Graphic of the Gillespie simulation. Species G and Q do not cross the membrane while
species R and L cross with different rates, kR and kL. (B) Distributions of final protein for each of
the four conditions. (C) Transients of protein expression for the three conditions that make
significant amounts of protein.You can also read