PT Link Net Tbk Corporate Presentation April 2016

Page created by Roberto Jimenez
 
CONTINUE READING
PT Link Net Tbk Corporate Presentation April 2016
PT Link Net Tbk
Corporate Presentation
April 2016
PT Link Net Tbk Corporate Presentation April 2016
Disclaimer
THE INFORMATION CONTAINED IN THESE MATERIALS IS STRICTLY CONFIDENTIAL AND MAY NOT BE FORWARDED, PUBLISHED OR DISTRIBUTED, DIRECTLY OR INDIRECTLY, TO ANY OTHER PERSON (WHETHER WITHIN
OR OUTSIDE YOUR ORGANIZATION/FIRM) FOR ANY PURPOSE AND MAY NOT BE REPRODUCED IN ANY MANNER WHATSOEVER. ANY FORWARDING, PUBLICATION, DISTRIBUTION OR REPRODUCTION OF THESE MATERIALS
IN WHOLE OR IN PART IS UNAUTHORIZED.

IMPORTANT: You must read the following before continuing. In accessing the attached summary information presentation (this “presentation”), you are agree to be bound by the following terms and conditions.

Confirmation of Your Representation: These materials and their contents may not be viewed by persons within Canada, Japan, the People‟s Republic of China (excluding the Hong Kong Special Administrative Region) or by persons in the United
States. By attending or accessing this presentation, you represent that you are outside the United States, Canada, Japan, or the People‟s Republic of China (excluding the Hong Kong Special Administration Region).

Neither these materials nor any of their contents may be disclosed or distributed or used for any other purpose without the prior written consent of PT Link Net Tbk (the “Company”). All information herein should be regarded as indicative,
preliminary and for illustrative purposes only. Such information reflects prevailing conditions as of the date of this presentation, all of which is subject to change.

The Company does not make any representation or warranty (express or implied) or accepts any responsibility or liability for the accuracy or completeness of these materials or any or all of the information in these materials or otherwise made
available. Accordingly, none of the Company or any other person shall be liable for any direct, indirect or consequential loss or damage suffered by any person as a result of relying on any statement in these materials, and any such liability is
expressly disclaimed. Nothing contained herein or therein is, or shall be relied upon as a promise, representation or warranty, whether as to the past or the future.

You and your Representatives (pursuant to the definition of Law No. 8 of 1995 on Capital Markets (the “Capital Market Laws”)) acknowledge that, in connection with your and their obtainment of this presentation, it is illegal under the Capital
Market Laws for any person who has received non-public material information to deal in securities in violation of the Capital Market Laws or to communicate that information to any other person under circumstances in which it is foreseeable that
such person is likely to deal in such securities in violation of applicable Indonesian laws.

This presentation contains “forward-looking statements”, which are based on current expectations and projections about future events, and include all statements other than statements of historical facts, including, without limitation, any
statements preceded by, followed by or that include the words “targets”, “believes”, “expects”, “aims”, “intends”, “will”, “may”, “anticipates”, “would”, “plans”, “could”, “should”, “predicts”, “projects”, “estimates”, “foresees” or similar expressions or
the negative thereof, as well as predictions, projections and forecasts of the economy or economic trends of the markets, which are not necessarily indicative of the future or likely performance of the Company, and projections and forecasts of
their performance, which are not guaranteed. Such forward-looking statements, as well as those included in any other material discussed at the presentation or in these materials, concern future circumstances and results and involve known and
unknown risks, uncertainties and other important factors beyond the Company‟s control that could cause their actual results, performance or achievements to be materially different from future results, performance or achievements expressed or
implied by such forward-looking statements. Such forward-looking statements are based on numerous assumptions and estimates regarding the Company‟s present and future business strategies, including expansion plans, dividend policy, and
the environment in which they will operate in the future. Forward-looking statements are not guarantees of future performance. These forward-looking statements speak only as at the date of this presentation, and none of the Company or any of
our respective directors, officers, employees, agents, affiliates, advisers or representatives intends or has any obligation or undertakes to supplement, amend, update or revise any forward-looking statements as a result of new information or to
reflect future events or circumstances, except as required under applicable laws.

This presentation includes certain forecasts and projections. By their nature, forecast and projected financial information address a hypothetical situation, and therefore do not represent the actual financial position or results of the Company had
the transactions described therein been completed at the dates assumed or any other date, or in the future and should not be regarded as an indication of the operating results generated by the Company or of the future financial position of the
Company. Given the abovementioned risks, uncertainties and assumptions, you should not place undue reliance on these forecast and projected financial information. Past performance is not necessarily indicative of future performance.

This presentation contains certain non-GAAP measures, including Adjusted EBITDA and EBITDA, that are not audited, not included in the Company's audited financial statements and not presented in accordance with Indonesian Financial
Accounting Standards. The measures have been used by management as a supplemental measure of the Company‟s performance. Although these measures are either contained in or fully reconcilable to line items on the Company's audited
financial statements and/or based on management accounts, they may not be equivalent to similarly named measures used by other companies, and should not be considered as a measure comparable to income statement items for the year in
the financial statements.

This presentation also contains certain statistical data and analyses (the “Statistical Information”) which have been prepared in reliance upon information furnished by the Company and/or third party sources for which the Company has either
obtained or is in the process of obtaining the necessary consents for use. Numerous assumptions were used in preparing the Statistical Information, which assumptions may or may not appear herein. As such, no assurance can be given as to
the Statistical Information‟s accuracy, appropriateness or completeness in any particular context, nor as to whether the Statistical Information and/or the assumptions upon which they are based reflect present market conditions or future market
performance. Moreover, any information from third party sources contained in this presentation may not be used or relied upon by any other party, or for any other purpose, and may not, directly or indirectly, be reproduced, disseminated or
quoted without the prior written consent of such third party. Statistical Information provided by PT Nielsen Audience Management (“Nielsen”) is about demographic trends and not product performance and is aimed at Nielsen clients in the media
space. Such information/data reflects estimates of market conditions based on samples, and is prepared primarily as a marketing research tool for media companies, advertising agencies and advertisers. Nielsen‟s Consumer Confidence
information/data measures consumer sentiment and confidence in the future of the economy, expenditure and saving patterns and major concerns. Such information/data reflects the optimism of consumers of the overall economic condition
which includes future job prospects, and the indication of how consumers will spend and save their money in the next 12 months. This information/data is for general information and research purposes only and should not be viewed as a basis
for investments. Any references to Nielsen should not be considered as Nielsen‟s opinion or endorsement as to the value of any security or the advisability of investing in the Company

This presentation does not purport to be a complete description of the terms of or the risks inherent in any actual or proposed transaction described herein. You should not construe any statements and/or information made in this presentation as
tax or legal advice. The recipient of this presentation must conduct its own investigation and analysis of the proposed transaction and the information and data contained in this presentation and in connection with the proposed transaction should
you proceed. No information set out in this presentation will form the basis of any contract. In furnishing these materials, none of the Company or any other person undertakes any obligation and/or liability to provide any additional information, to
update these materials or to correct any inaccuracies or incompleteness which may become apparent.

This presentation does not constitute or form part of and should not be construed as an offer to sell or the solicitation of an offer to buy securities in any jurisdiction in which such offer or sale would be restricted, prohibited or unlawful.

ANY FORWARDING, DISTRIBUTION OR REPRODUCTION OF THIS PRESENTATION ELECTRONICALLY OR OTHERWISE, IN WHOLE OR IN PART, TO ANY OTHER PERSON IS UNAUTHORIZED. FAILURE TO COMPLY WITH THIS
PARAGRAPH MAY RESULT IN A VIOLATION OF THE SECURITIES ACT, THE CAPITAL MARKETS LAW OR THE APPLICABLE LAWS OF OTHER JURISDICTIONS. IF THIS PRESENTATION HAS BEEN RECEIVED IN ERROR, IT MUST
BE DELETED IMMEDIATELY.
                                                                                                                                                                                                                                                                  2
PT Link Net Tbk Corporate Presentation April 2016
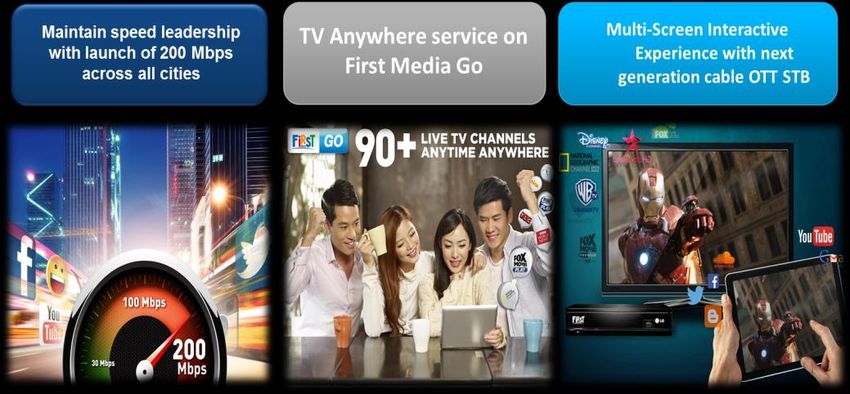
Lippo Group Business Segments

    BANKING &    PROPERTY &       SHOPPING        RETAIL &
     FINANCE     REAL ESTATE       MALLS          STORES
                                    53 Malls       411 Stores

                                                 TECHNOLOGY,
     HOTELS &      HEALTH        UNIVERSITY &
                                                   MEDIA &
     RESORTS        CARE          SCHOOLS
                                                TELECOM (TMT)
                  20 Hospitals

                                                                3
PT Link Net Tbk Corporate Presentation April 2016
Lippo TMT – An End to End Ecosystem

                                                                                          Cable
                              Document                                                Broadband &
                             Management                       Wireless                Optic Network              4G LTE
               Data                                          Broadband                                           Network
              Center                                          (Radio frequency)

                                                                                                                              Satellite
                                                                                                                              Operator

                        TECHNO-                                                      Telecom
 System                Technology
Integrator               LOGY                Technology
                                               Media &                                                          In Building
                                                                                                                 Services
                                              Telecom
                                                                                             VSAT
   IT & BP
Outsourcing &
 E-Payment

                                                                                                    Cable, Digital
                                                                            Media                   & Satellite TV
             Online
             Media

                                          E-Commerce

                                                        Content
                                                       Production
                                                                                    Cinema                   Print & Online
                                                                                                                 Media                    4
Link Net – Key Milestones
                                                                                                     Jun 2011
                                                                                          •   CVC invested in Link Net
                                                                                          •   Link Net acquired certain
                                                                                                                                                 2014 - 2015
                                                                                              network and related assets
                                                                      2007 – 2008             from First Media
                                                                       Launch of
                                                                   broadband services
                                                                      and bundled
                                               2002                    packages
                                         Sole provider to
                                          IDX of remote
                                         trading network
                         2000                                                                                         2013
                                                                                                                                                   2014 - 2015
                    Launch of Internet
                        services                                                                                                       •   2014: Fully marketed secondary
                                                                                                                                           placement (Oct 2014)
                                                                                                                                       •   2015: Shareholding (Dec 2015)
     1999
                                                                                 2011                                                       –   First Media:     33.8%
Launch of Cable                                                                                                    2013                     –   CVC:             33.5%
  TV services
                                                                  2010                                •   1 million homes passed            –   Public:          32.7%
                                                                                                      •   Expanded network to
                                                                                                          Greater Surabaya and
                                                                                                          Bandung
                                                               2010
                                                                                                      •   First to offer 100 Mbps to
1999         2000         2002 2007 – 2008                  Launch of HD                                  the residential sector

             Network ownership under First Media                                          Network ownership under Link Net

                                                                                                                                                                     2015
                                                                                                    2012              2013             2014
                                                        2010             Jun 2011 2011
 Number of homes                                                                                                       1,194
   passed („000)
                                                            506            553          655           933                              1,433                        1,673

                                                                                                                                                                            5
Indonesia – A Large & Exciting (Underdeveloped) TMT Market
                                                                Indonesia today…                    …with a highly compelling macro story
         Large                                                                                      4th largest by population
     population base                      251 million people         (a)
                                                                                                    country(c) in the world
    Young population
                                          54% of Indonesians under 30 years of age            (a)   One of the     youngest(c) populations in the world

     High GDP growth
          CAGR                            5.8% real GDP growth rate        (b)
                                                                                                    One of the     fastest growing economies in
                                                                                                    the world(b)

  Consumption driven
      economy                             Consumption contribute to over         59%(d) of GDP      Consumer class to grow by    90 million(e)

 Urbanization with GDP
 concentration in cities
                                          53%(f) urban population contributed to 74%(f) of          71%(g) urban population to contribute 86%(g)
                                          GDP                                                       of GDP

    Under-penetrated                                                                                Of the highest fixed broadband
      broadband                           6.1% fixed broadband penetration rate         (c)
                                                                                                    growth of 10.8% CAGR(h) in the world
    Under-penetrated                                                                                Fast Pay TV growth of 8.8%
        pay TV                            10.0% pay TV penetration rate           (c)
                                                                                                    CAGR(h)
                                    Indonesia is a large and attractive cable market with faster growth in larger cities
(a)   Based on 2015, Source: Media Partners Asia
(b)   2014 – 19 CAGR, Source: Media Partners Asia and BMI
(c)   Based on 2015, Source: Media Partners Asia
(d)   Based on 2013, Source: Nielsen
(e)   Growth from 2010 to 2030, Source: McKinsey Global Institute
(f)   Based on 2010, Source: McKinsey Global Institute
(g)   By 2030, Source: McKinsey Global Institute
(h)   2014-19 CAGR, Source: Media Partners Asia                                                                                                           6
Source: World Bank, Media Partners Asia, McKinsey Global Institute
Link Net – Leading Provider of Broadband & IP Services
      Driving Adoption of Internet of Things via its NGBB(a) Network
                                                                                                                  …with Link Net as the leading provider of broadband and IP
               Large and fast growing market with strong demand…
                                                                                                                    services driving the adoption of Internet of Things…

% ADSL Subs.                                                                                                                                                200
 of total BB         90%                       89%                       83%                                                        linkNet

                                                                                                                                                           Mbps
                                                                                       2014-19
                                                                                        CAGR
                                                                       1,093
                                                                                       21.4%
                                                                                                                                    speedy
                                                                                                                                                3             100
                                                                                                                                               Mbps          Mbps

                                                                                        9.2%

                                               414
                                                                                                                       …and the anchor provider to affluent AB households
                                                                       5,280                                                in Indonesia‟s top 3 metropolitan cities
                      193
                                              3,400                                                                                           Others (c)                               Homes Passed

                                                                                                                                                                                  Link Net      1.7 Mio
                     1,789
                                                                                                                                                 70k                              TLKM ADSL     10 Mio
                                                                                                                                                                                  & FTTH

                     2011                     2014                     2019                                                                                                       Others         635K
                                                                                                                                                  Subs.
                                                                                                                             457k                market
                                                                                                 3 Key Metropolitan Cities                       share(b)         649k

                                  ADSL        Cable / FTTx
                                                                                                                                                                         Across 15 cities

(a)    NGBB defined as Next Generation Broadband
(b)    Source: TLKM and Link Net based on Company data as of Dec 31, 2015                                                                                                                                 7
(c)    Source: “Others” data based on MPA 1H2015 (MNC Play, Biz Net and My Republic)
First Mover Advantage in an Industry with
Significant Barriers to Entry

                           Link Net has top tier personnel with substantial expertise and track record in
                           quality system roll out, developed over many years of pioneering experience
  In contrast to others…

                           Link Net‟s significant experience in working with community leaders and delivering
                           on its promises lend to difficulties in getting communities approval on the part of
                           new players with unproven track record
                           Link Net‟s quality and superior service creates “sticky” relationships with its
                           customers and community leaders and so these constituencies would be reluctant
                           to switch over and provide access for any new cable construction with its
                           attendant disruptions to daily life.

                           Link Net‟s record for homes passes and household penetration of the AB market;
In combination…

                           Its breadth of content offerings;
                           The solid relationship between price and value for each of its offerings;
                           Its reputation for quality service and customer support,

                           …create significant barriers to entry.

                                                                                                             8
Technologically Resilient State-of-the-Art Network and
Superior Content Delivery – Driver of the Internet of Things
                  Currently capable of high speed internet connectivity of up to 200 Mbps -- fully
                  DOCSIS 3.0 enabled allowing clear path to speeds of up approximately 1 Gbps.

                  Fully owned fiber backbone and last mile(a) – ensuring high quality services and
                  cost control

                  Link Net owns and operates its own fiber lines to Singapore gateway--from there it
                  connects to the rest of the world

                  Supports large number of High Definition channels and Value Added Service (VAS) -
                  Industry leader

                  Low average homes-to-nodes ratio - 360 homes per node(b)

(a)   Limited exceptions for certain last mile owned by property developers
(b)   Source: Media Partners Asia
                                                                                                       9
Targeting the Most Attractive Cities...
                                Operating in provinces with high GDP                                                                                 Operating in cities with high population

  % of                                                                                                                      Total
 national                       13%             12%                   11%                     4%                         population                     10.1          2.5                  3.1                  248
  GDP                                                                                                                     (millions)
            2013 GDP (US$ bn)

                                                                                                                                   Per km2 in 2013
                                 117
                                                 107                                                                                                   15,211
                                                                        99                                                                                           14,386

                                                                                                                                                                                          9,425

                                                                                               31

                                                                                                                                                                                                                130
                                                                                                         (b)
                                Jakarta      East Java(a)          West Java (a)      Rest of Indonesia                                                Jakarta      Bandung             Surabaya           Indonesia

(a)   Key cities in East Java include Gresik, Bangkalan, Mojokerto, Surabaya, Sidoarjo, Lamongan and West Java includes Bandung
(b)   Rest of Indonesia figure is the average of the remaining top 12 provinces as per BPS excluding Jakarta, East Java and West Java                                         Addressable market for Link Net
Source: Media Partners Asia, Biro Pusat Statistik (BPS), Nielsen and Company data                                                                                                                                      10
...and Attractive & Fastest Growing Demographics –
 the Millennials
                                                 Households in Link Net's operating cities(a)                      Link Net‟s target market

                                                     2.9%                            A1                            Increasing proportion of
Monthly expenditure (IDR „000)             (b)       6.3%                                         A1       8.3%
                                                                                     A2                            AB segment since 2010

      A1               10,000                        17.8%                            B           A2       19.6%
                                                                                                                   AB segment less price
                                                                                                                   sensitive

      A2                5,000
                                                     23.2%                            C                             Un-satisfied demand for
                                                                                                  B        35.0%    quality broadband and
       B                3,000                                                                                       premium entertainment
                                                                                                                    experience

       C                2,000                        49.8%
                                                                                                                    Affordable entry level
                                                                                                                    packages also available
                                                                                      D           C        22.8%    for C1 segment customers
       D                1,500

                                                                                                           14.4%    ABC1 growth driven by
                                                                                                  D
                                                                                                                    robust Indonesia macro
                                                                                                                    fundamentals where lower
                                                                                     2010        2015               income CDE HHs moving
                                                                                                                    to affluent AB households
                                                                             AB : 27%           AB : 63%
  (a) Cities include Greater Jakarta, Greater Surabaya and Bandung
  (b) Based on Nielsen 2015, AB HH monthly expenditure updated to Minimal Rp 3 mio
  Source: Nielsen, assuming 4 pax per household                                                                                                 11
Significant Room to Grow in Existing Cities
                                                                                                                          Total addressable AB HH‟s: 4.9 Mio
                                                                  Greater Jakarta                                         Total LN homes passed: 1.675 Mio
                                                     •    Addressable households(a): 3,644k                               Total cable length: 22,958 km
                                                     •    Homes passed: ~1.3m
                                                     •    Estimated coverage ratio: ~36%
                                                     •    Cable length: ~19,366km

                       Bandung
  •    Addressable households(a): 318k
  •    Homes passed: ~80k
  •    Estimated coverage ratio: ~25%
                                                                                       Greater Surabaya                        Bali
                                                                            •    Addressable households(a): 909k     •   Cable length: ~100km
  •    Cable length: ~875km
                                                                            •    Homes passed: ~295k                 •   Focus on hotels
                                                                            •    Estimated coverage ratio: ~32%
                                                                            •    Cable length: ~2,617km

                   Link Net NGBB player of SCALE, operating in the most attractive metropolitan areas of Indonesia

(a) Based on addressable market of AB SES households as defined by Nielsen (2015 definition of SES classification)
Source: Company data (As of FY 2015), World bank, Media Partners Asia
                                                                                                                                                             12
Winning Price-Value Range of Broadband and Video
 Content Packages
   Catering to a large addressable market from a large C population to a fast growing AB segment

                    1                              2                               3                            4                             5                               6                            7

                Family                         D‟Lite                           Elite                      Supreme                        Maxima                         Ultimate                      Infinite
       •   Entry-level package        •   Basic package               •   Incremental add-on        •   Package targeted for      •   Designed for heavy          •   Highest tier packages, offering the highest speed
           offering for                   offering for                    packages which                consumers who are             users of high speed             possible combined with dedicated premium
           subscribers with basic         subscribers with basic          deliver faster Internet       looking for full access       internet who require full       customer and technical service for users that
           Internet and TV                Internet and TV                 and more TV channel           to high speed Internet        access to all channels          demand the best service available
           Channel needs                  channel needs                   genres                        and all channels                                                                             200 Mbps
                                                                                                                                                                                                    162 channels
                                                                                                                                                                                                       3,119
                                                                                                                                                                                                      (US$233)

                                                                                                                                                                        100 Mbps
                                                                                                                                                                       162 channels
                                                                                                                                                                           2,175
                                                                                                                                         50 Mbps                         (US$162)
                                                                                                                                       162 channels
                                                                                                                                            1,649
                                                                                                                                         (US$123)

                                                                                                            25 Mbps
                                                                                                          162 channels
                                                                             12 Mbps                          849
                                              6 Mbps                       134 channels                     (US$63)
           2 Mbps                           112 channels                       549 (b)
IDR „000 92 channels
(US$)(a)
                                                339    (b)
                                                                              (US$41)
                 199 (b)
                                              (US$25)
                (US$15)

                        Profitability margins are similar across all packages from entry-level to most premium tier package
   (a)        US$1 : IDR13,400 exchange rate was assumed
   (b)        Wireless Wi-fi STB for FAMILY and D’LITE & D3 Modem for ELITE
   Source: Company data as of Jan. 2016                                                                                                                                                                                   13
   All price is including CPE rental All price exclude 10% VAT
Combo Packages of Video and Broadband Services
  Deliver Added Value to Customers
  Package price(a)

                                                              12 Mbps
                                                            134 channels

                                                                 549
                                                                                                                                                              50 Mbps
                                                                ($41)                ($41) 7 Mbps                                 10 Mbps                    47 channels
                           6 Mbps                                                                                                               10 Mbps
                                                                                             67 channels                         45 channels   78 channels
                         112 channels
                                                                                                                                                                409
                                                                                                   354                                350         350          ($31)
                               339
                                                                                                  ($26)            ($26)             ($26)       ($26)
                              ($25)
IDR „000
 (US$)(b)

(a)   For comparison across products, packages analysed offer 2, 6 & 12 Mbps for Link Net vs. others similar mbps Internet package
(b)   USDIDR exchange rate of 13,400
Source: Company data, Corporate websites of service providers as of 1 Jan 2016
                                                                                                                                                                           14
Consistent ARPU Growth based on Proven Track
Record of Package Enhancements and Upselling
                 Continuous innovations to stay ahead of the game               Successful upselling through focused marketing efforts

                                                                                                  No. of upgrade transactions each year

                                                                                                                                              265,560

                                                                                                                       162,981
                                                                                 127,290               133,710

                                                                                  2012                  2013            2014                   2015

         Combo Product Retail Price Movement(a)
        (IDR „000s)
                            FAMILY               DLITE                  ELITE            SUPREME                       MAXIMA          Q4 2012 to Q1 2015
                                                                                                                                           CAGR. (%)
                                                                                                                               1,649
                                                          1,479                       1,479                                                  6%

                                                                                                                                849          16%
                                                                                         669
                                                           609
                             550                                                                                               549           12%
                                                                                           449
                                380                          409
                                                                                                                                       359   9%
                                 280                              309                            339
                               150                         159                             169                            199                10%

                           Q4 2012                       Q3 2013                    Q1 2014                                Q1 2015
                                                                                                                                                            15
(a) 2015 Combo repackage
Source: Company data
Key Highlights – FY 2015
   Delivered profitable growth, amidst external pressures
      Revenue of IDR 2,564 billion, up 20% yoy
      EBITDA of IDR 1,450 billion, up 18% yoy
      NPAT of IDR 640 billion, up 15% yoy

   Strengthened foundation for further growth in 3 key coverage areas
       1.67 million homes passed, added 240k in 2015
       456,876 broadband RGUs, added 65k in 2015
       432,889 cable TV RGUs, added 70k in 2015
       95% bundling rate, up 2% from FY14

   Sustained premium ARPU at IDR 415k, reflecting strong brand equity

   Continued growth momentum in enterprise business, with major strategic wins across
   broad range of client businesses

   For the 5th time since 2011, received the “2016 SWA Customer Loyalty Award Net
   Promoter Leader” in both Broadband/Fixed ISP and Pay TV categories, a testament to
   our customer-focused strategy
                                                                                        16
Solid Operating Performance despite External Pressures
     Homes Passed („000)      RGUs („000) and Churn %                          ARPU (IDR „000)

                              2.2%                  2.3%
                    1,673
                                                                                                 415
                                                                        402
    1,433

                                                    433

                               363

                                                    457
                               392

     2014            2015     2014                  2015                2014                    2015

                            Broadband    Cable TV          Churn Rate            Blended ARPU

                                                                                                       17
Consistent Revenue Growth across All Areas of Business
                             Revenue (IDR bn)

                                                        2,564

                                                2,136

       586            678

       4Q14           4Q15                      2014    2015
Continued Margin Improvement in Constant Currency Terms
                                  EBITDA (IDR bn)                                                                           Net Profit (1) (IDR bn)

                                                            58.4% (2)                                                                                      27.3% (2)

              57.6%                                         56.5%
                                                                                                              26.1%                                        25.0%

                                                            1,450
                                                                                                                                                           640
                                                                                                                 558
                   1,231

                    2014                                     2015                                                2014                                      2015
                                                                              EBITDA and Net profit margins

 (1) Finance  costs in FY 2015 P&L include net foreign exchange translation losses of IDR 30 billion and financing and payment channel charges of IDR 43 billion.      19
 (2)   Represents approximate pro-forma margins in constant currency terms
Free Cash Flow Positive while Continuing to Expand Network
                           CAPEX Breakdown(1) (IDR bn)                                           Net Cash with Large Leverage Capacity(2) (IDR bn)

                                        Total Capex
               Network-related CAPEX
                   includes approx.
                 IDR 140bn spent on
                subsea cable running
                 through Singapore,
                 Batam, Bangka and
                    Jakarta (B2JS)

                                                                    1,291

                                                                                                      325                101
                        777
                                                                                                                                            224

                       2014                                         2015                          Total Cash          Total Debt         Net Cash

 (1)Capital   expenditure (CAPEX) represents additions to property, plant and equipment (PPE).
 (2)Cash   and debt position as of December 31, 2015. Debt mainly comprises vendor financing.
Key Investment Highlights
                                                               Indonesia most underpenetrated and fastest growing broadband market globally(a,b)
                Large and attractive                   1       Link Net focus on large & fast growing affluent core households, in most important
                      market                                    metropolitan cities
                                                               Large residential consumer base and untapped enterprise upside

                                                               The leading provider of broadband and IP services driving the adoption of the Internet of
               Pioneer NGBB player                              Things via its Next Generation Broadband Network (NGBB)
                     of scale                          2       Dominant NGBB & Cable TV player in Indonesia, with proven track record
                                                               Natural entry barriers(c) from first mover advantage

                                                               Technologically resilient and highly redundant network
                    State-of-the-art                   3       Future Proof -- Highly upgradable network
                       network                                 Abundant Link Net owned fiber trunks to support future international bandwidth and data
                                                                growth

                 Superior product                              Differentiated product packages offering significant value to customers
                offerings & services
                                                       4       High take-up of bundled packages
                                                               Best-in-class services

                   Strong financial                    5       Highly attractive financial profile with visible strong growth trajectory and operating outlook
                    performance                                High margins despite continued expansion

              Deep and experienced
                                                      6        Complementary skills and expertise with strong domestic and international track record
               management team

(a) Most underpenetrated and fastest growing broadband market globally out of the top 20 largest global economies
(b) Source: Based on 2013 data from MPA                                                                                                                           23
(c) Source: Media Partners Asia
Thank you
You can also read