Opportunities from Electric Vehicles, Future Mobility & New Transportation Technology - An Overview of the KraneShares Electric Vehicles & Future ...
←
→
Page content transcription
If your browser does not render page correctly, please read the page content below
KARS
                                 12/31/2018

Opportunities from Electric
Vehicles, Future Mobility &
New Transportation
Technology
An Overview of the KraneShares
Electric Vehicles & Future
Mobility ETF (Ticker: KARS)

info@kraneshares.com                      1
Introduction to KraneShares

About KraneShares
Krane Funds Advisors, LLC is the investment manager for
KraneShares ETFs. Our suite of China focused ETFs
provides investors with solutions to capture China’s
importance as an essential element of a well-designed
investment portfolio. We strive to provide innovative, first
to market strategies that have been developed based on
our strong partnerships and our deep knowledge of
investing. We help investors stay up to date on global
market trends and aim to provide meaningful
diversification. Krane Funds Advisors, LLC is majority
owned by China International Capital Corporation (CICC).

                                                               2
Investment Strategy:

     KARS                             KARS seeks to measure the performance of Solactive Electric Vehicles and Future Mobility Index. The Index is designed to track the
                                      performance of companies engaged in the production of electric vehicles and/or their components, or engaged in other initiatives that may
                                      change the future of mobility. The Index includes issuers engaged in the electric vehicle production, autonomous driving, shared mobility,
KraneShares                           lithium and/or copper production, lithium-ion/lead acid batteries, hydrogen fuel cell manufacturing and/or electric infrastructure businesses.

Electric Vehicles &                   KARS features:
Future Mobility ETF                   •    Access to global companies that operate in all areas of new transportation methods, passenger and freight, including electric vehicles,
                                           autonomous vehicles and shared mobility.
                                      •    Exposure to companies that lead the development of vehicle connectivity like Internet of Vehicles (IoV) and Intelligent Mobility.
                                      •    Exposure to the growth brought on by increased demand for lithium-ion battery and non-ferrous metals like lithium due to electric vehicle
                                           adoption.
                                      •    Exposure to equities listed in Mainland China, currently the world’s largest electric vehicle market.
                                      Future Mobility Sector Highlights
                                      •    55% of new car sales and 33% of the global car fleet are projected to be electric by 2040.1
                                      •    The global electric vehicle market is projected to command $2.7 trillion of total investment before 2040.2
                                      •    Autonomous vehicles and the resulting “passenger economy” are projected to generate a cumulative $8 trillion in global service revenues
                                           by 2050.3

1.   Data from Bloomberg New Energy Finance as of 05/21/2018, retrieved 12/31/2018.
2.   Morgan Stanley Research. “The EV Infrastructure 55: A Diversified Way to Play a Critical Enabler in the EV Theme.” Morgan Stanley. 17 October 2017
3.   Lanctot, Roger. “Accelerating The Future: The Economic Impact of the Emerging Passenger Economy.” Strategy Analytics. June 2017.                                                  3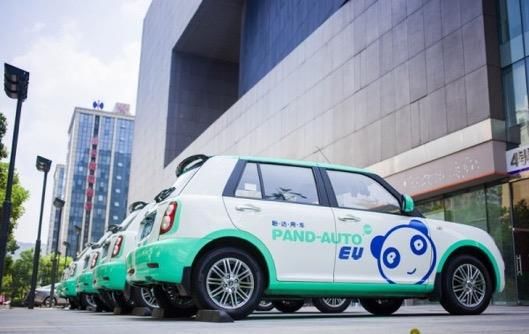
Future Mobility – We are entering an electrified, connected, autonomous, and shared future.

                                                                                                 Definition

                      Electric Vehicles      Electric vehicles (EV) are vehicles which use one or more electric motors for propulsion.

                   Battery and Non-Ferrous   Adoption of electric vehicles dramatically increases demand for lithium-ion battery and non-ferrous metals such
                            Metals           as lithium and copper.

                                             Vehicle connectivity has three main characteristics: the presence of sensors, vehicle connectivity to networks,
                     Vehicle Connectivity
                                             and the ability to rapidly compute incoming data.

                                             Autonomous vehicles, also called driverless cars or self-driving cars, are vehicles that are capable of sensing the
                     Autonomous Driving
                                             environment and navigating without human input.

                                             Shared mobility allows passengers to share transportation includes carsharing, e-hailing, ridesharing and
                       Shared Mobility
                                             carpooling.

                                                                                                                                                                   4
Future Mobility Ecosystem

                      Vehicle       Autonomous
Electric Vehicles   Connectivity      Driving

                           Shared Mobility

  Batteries and
  Non-Ferrous
     Metals

                                                 5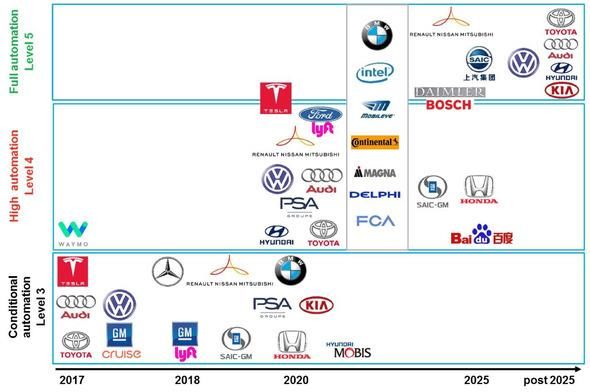
Electric Vehicles

Electric vehicles (EV) are becoming increasingly widespread and economical.
                                                                                                                                                                        Annual global light duty vehicle sales1
• 55% of new car sales and 33% of the global car fleet are projected                                                                                       120

  to be electric by 2040.1                                                                                                                                 100

                                                                                                                                        million vehicles
                                                                                                                                                            80                                                                     55%
• China currently accounts for about 50% of global EV sales and is                                                                                                                                                   43%
                                                                                                                                                            60
  estimated to comprise half of the global EV market until 20251                                                                                                                                  28%
                                                                                                                                                            40                       11%
• Rising average mileage per vehicle brought on by ride sharing                                                                                             20
                                                                                                                                                                        3%

  platforms may result in electric vehicles becoming more cost                                                                                               0
                                                                                                                                                                 2015    2020           2025            2030               2035          2040
  competitive than vehicles with traditional internal combustion
                                                                                                                                                                                      EV Sales          ICE Sales
  engines (ICE).
                                                                                                                                                                             Global light duty vehicle fleet1
• The low environmental impact of electric vehicles means that                                                                                        1,800

  governments may be more motivated to promote their manufacture                                                                                      1,600

                                                                                                                    million cars on the road
                                                                                                                                                      1,400
  and many have already introduced subsidies for electric vehicles.2                                                                                  1,200
                                                                                                                                                      1,000
                                                                                                                                                           800                                                                     33%

                                                                                                                                                           600                                                             20%
                                                                                                                                                           400                                           9%
                                                                                                                                                           200                             3%
                                                                                                                                                                                1%
                                                                                                                                                             0
                                                                                                                                                                 2015    2020            2025           2030                2035          2040
                                                                                                                                                                                       EV Fleet          ICE Fleet
1.   Data from Bloomberg New Energy Finance as of 05/21/2018, retrieved 12/31/2018
2.   Moss, Trefor. “China, With Methodical Discipline, Conjures a Market for Electric Cars.” Wall Street Journal. 2 October 2017.
                                                                                                                                                                                                                                                 6
Batteries and Non-Ferrous Metals

Batteries and Non-Ferrous Metals are an ideal avenue for capturing the potential value of electric vehicle
markets.
                                                                                                                                                            Projected global EV lithium-ion battery demand5
                                                                                                                                      1,400                                                                                   1,294
• Widespread adoption of electric vehicles may dramatically increase
                                                                                                                                      1,200
  demand for lithium-ion battery and non-ferrous metals such as lithium

                                                                                                         Gigawatt hours
                                                                                                                                      1,000
  and copper.
                                                                                                                                        800
• Global lithium-ion battery demand is projected to grow 3750% by                2030.1                                                 600
                                                                                                                                                                                                          409
                                                                                                                                        400
• The revenue pool for lithium, an indispensable component of electric
                                                                                                                                        200                                    123
  vehicle batteries, is expected to grow 450% by 2025.2                                                                                              19
                                                                                                                                             0
                                                                                                                                                    2015                       2020                       2025                2030
• Copper demand for electric cars may rise nine-fold by 2027.3
                                                                                                                                            China      US     Rest of Europe    Rest of World     Japan   Germany   UK   France

• Mining companies have already begun to increase production capacity to
                                                                                                                                                    Projected global metals and materials demand from EV lithium-ion
  meet the impending demand. Galaxy Resources recently purchased a                                                                                                              batteries1
  mining area in South America’s “Lithium Triangle” home to around 60                                                               2,500
  percent of the world’s reserves.4

                                                                                                             Thousand metric tons
                                                                                                                                    2,000

                                                                                                                                    1,500

                                                                                                                                    1,000

                                                                                                                                     500
 1.   Data from Bloomberg New Energy Finance as of 05/21/2018, retrieved 12/31/2018.
 2.   Desjardins, Jeff. “The Massive Impact of EVs on Commodities in One Chart.” Visual Capitalist. 15
      September 2017.                                                                                                                  0
                                                                                                                                              2018 2019 2020 2021 2022 2023 2024 2025 2026 2027 2028 2029 2030
 3.   Reuters. “Copper demand for electric cars to rise nine-fold by 2027: ICA” Reuters. 13 June 2017.
 4.   Ben Creagh, “Galaxy raises $61 million for development of lithium projects”, Feb 8 2017.                                                                                  Copper          Lithium
 5.   Data from Bloomberg New Energy Finance as of 07/06/2017, retrieved 12/31/2018.                                                                                                                                                  7
Connectivity

Connectivity technology like Internet of Vehicles (IoV) connects cars to each other and outside world.
                                                                                                                   Share of new cars sold that are connected to the Internet
• Nearly all new vehicles sold in China, European Union, and United                                                             worldwide from 2015 to 20251

  States are projected to be internet connected by 2022.1                                                                                       98%                   100%
                                                                                                          100%
• The growth of Internet of Vehicles (IoV) may potentially produce $273
                                                                                                           75%
  billion in revenue by 2026, according to a report by GSMA.2
                                                                                                           50%
                                                                                                                          35%
• Companies like NVIDIA and NXP Semiconductor provide connectivity
                                                                                                           25%
  solutions including Artificial Intelligence (AI), Vehicle-to-Vehicle (V2V)
  and Vehicle-to-Everything (V2X).                                                                          0%
                                                                                                                          2015                  2020                  2025
• Connectivity in personal vehicles and all types of transport is projected
  to increase, creating a larger role for data services companies like
  Alphabet and Baidu in the mobility space.

                                                                                                     IoV is designed to improve
                                                                                                     traffic management and
                                                                                                     enhance safety by connecting
                                                                                                     cars and signals to each other.

1.   PwC, “The 2017 Strategy& Digital Auto Report", September 2017.
2.   GSMA, “GSMA Highlights US$1.8 Trillion IoT Revenue Opportunity for Mobile Network Operators”,
     September 7, 2017                                                                                                                                                               8
Autonomous Driving
Autonomous vehicles could dramatically change the Nature of the transportation market.
• By 2035, cars with autonomous vehicle features are projected to Autonomous vehicle launch timelines based on public announcements5
capture 25% of the new car market and more than 30 million
autonomous vehicles are projected to be sold per year globally.1
• The assisted driving market, a precursor to full autonomy, may
potentially double by 2021.2
• Alphabet’s Waymo has developed autonomous vehicles that are
already being regularly used in California, Wyoming, Arizona and
Texas, achieving 10 million “self-driven” miles.3
• Baidu’s Apollo Program is the first open source simulator for
autonomous vehicle developers and has already partnered with
over 200 partners including Nvidia and Infineon.4
1. Boston Consulting Group,” Autonomous Vehicle Adoption Study”, APRIL 10, 2017
2. Choi, Seunghkyuk. “Advanced Driver-Assistance Systems: Challenges and Opportunities Ahead.”
McKinsey & Company. February 2016.
3. Data from Waymo website, “On The Road”, retrieved 12/31/2018
4. Data from Apollo.auto, retrieved 12/31/2018.
5. Data from Bloomberg New Energy Finance as of 07/06/2017, retrieved 12/31/2018. 9Shared Mobility
Shared mobility is revolutionizing transport systems.
• The rapid rises of ride sharing platforms such as Uber laid the foundation for
the major paradigm shift in transportation to a “passenger economy,” which is
projected to add $8 trillion to the global economy by 2050.1
• Ride sharing companies are capturing market share at an extremely fast pace.
There are already 437 million users of ride sharing platforms and that number
is projected to increase to 697 million by 2022.2
• Car sharing platforms are also on the rise. These platforms allow users to rent
and drive a car for short periods of time. Examples include Baidu’s Pand-auto,
GM’s Maven, Daimler’s Car2Go, and BMW’s ReachNow. Ride Sharing Platform User Projections4
• Baidu’s Pand-auto has the world’s first fully electric fleet of shared mobility 800
697.1
vehicles. The company has over 15,000 electric cars and over 2,100,000 700 660.8
617
registered users as of Nov 2017.3 564.9
600
Millions
504.6
• The combined trend of Shared Mobility and Autonomous driving has the 500 436.8
potential to disrupt vehicle ownership and insurance as transportation
400 364.4
becomes a pay as you go service in many cases.
300
2016 2017 2018 2019 2020 2021 2022
1. Lanctot, Roger. “Accelerating The Future: The Economic Impact of the Emerging Passenger Economy.”
Strategy Analytics. June 2017.
2. Statistica, “Ride Sharing Platform User Projections”, September 2017
3. Abnewwire, “Pand-Auto is the Premier Car Sharing Operations in the Area”, Dec 12, 2017
4. Data from Statistica as of 9/2018. Retrieved on 12/31/2018. 10Global EV Sales1
2,200
China possesses unique advantages in future mobility 2,000
Thousands of Vehicles
development. 1,800
1,600 1,166
1,400
• China is the world’s largest electric vehicle (EV) market with 533,290 EV sold in 1,200
1,000 733
2017, more than US, Europe and the rest of the world.1
800
600 480
• China already built 320,900 charging stations1 and the number is projected to be
400 308 533
4.8 million by 20202 200 213
130 285
0
• The Chinese government already offers subsidies of $15,000 per electric vehicle 2012 2013 2014 2015 2016 2017
produced, twice those offered by the US. Beijing’s municipal government has China Europe U.S. Rest of world
earmarked $1.3 billion to replace 70,000 city taxicabs with electric models. 2
Global cumulative number of public EV charging points installed1
• China’s urban development provides an opportunity to build exterior infrastructure
for autonomous vehicles from the ground up. 600 582
500
• Chinese auto maker BYD (Build Your Dreams) is one of the world’s largest electric
Thousand Outlets
vehicle manufacturers and has sold vehicles for use as public buses to the cities of 400 377
London and Long Beach, CA. 68
300
238
• Warren Buffett invested $230 million into BYD in 2008.3 44
200 143
102 321
152 31
100 214
112
47 70
0 1
2012 2013 2014 2015 2016 2017
China United States Germany Netherlands Japan United Kingdom Others
1. Data from Bloomberg New Energy Finance as of 05/21/2018, retrieved 12/31/2018.
2. Moss, Trefor. “China, With Methodical Discipline, Conjures a Market for Electric Cars.” Wall Street
Journal, 8/2/2017.
3. Justine Lau, ”Buffett buys BYD stake”, September 29 2008 11KARS constituents contribute to all components of future vehicles.
Batteries and Raw materials Connectivity and Autonomous Capability
Electrical Grid
Entire Vehicle
Manufacturers
12Example Holdings of the KraneShares Electric Vehicles and Future Mobility ETF:
Holding weight in KARS
Theme Example Holdings Future Mobility Service
(as of 12/31/2018)*
Tesla 3.46% Tesla designs and manufactures the Model S electric sedan and the Model X electric SUV.
Electric
Vehicles BYD 1.41% BYD designs and manufactures electric sedans, buses, taxis and coaches.
Alphabet 3.69% Alphabet Waymo’s self-driving cars has achieved millions of miles self-driven.
Autonomous
Driving Baidu’s Apollo provides an open, reliable and secure software platform for its partners to develop
Baidu 3.40%
their own autonomous driving systems.
Nvidia’s Artificial Intelligence (AI) technology gives cars the power to see, think, and learn and to
Nvidia 3.27%
Vehicles drive themselves eventually.
Connectivity NXP’s Vehicle-to-Everything (V2X) technology enables cars to communicate with their
NXP 1.94%
surroundings.
Pand-auto, owned by Baidu, cooperate with Apollo Project and operates electric vehicles
Baidu 3.40%
carsharing business in China.
Shared Mobility
Car2Go, an subsidiary of Daimler, offers exclusively Smart Fortwo and Mercedes-Benz vehicles
Daimler 3.57%
and features one-way point-to-point rentals.
Lithium-ion Samsung SDI 2.22% Samsung SDI manufactures Lithium-ion batteries for electric vehicles.
Battery Guoxuan High-tech 1.10% Guoxuan High-tech is a Chinese company manufacturing lithium-ion batteries.
Albemarle became a major lithium producer by owning lithium mines in South America and by
Lithium and Albemarle 1.50%
acquiring lithium companies in China and globally.
other Non-
Ferrous Metals Southern Copper Southern Copper Corp. is one of the largest integrated copper producers in the world. They
2.03%
Corp. produce copper, molybdenum, zinc, lead, coal and silver.
*Data from Bloomberg as of 12/31/2018. See page 16 for the Fund’s top 10 holdings 13China, the United States, and Germany are leading the world in future mobility
Germany
• New Electric Car Sales World Ranking (2017): 4th1 China
• Electric Vehicle Stock (2017): 109,5601 • New Electric Car Sales World
• Fund weight: 14.33%2 Ranking (2017): 1st1
• Electric Vehicle Stock (2017):
1,227,7701
• Fund weight: 22.31%2
United States
• New Electric Car Sales
World Ranking (2017): 2nd1
• Electric Vehicle Stock (2017):
762,0601
• Fund weight: 39.83%2
1. International Energy Agency. “Global EV Outlook 2018.” retrieved
12/31/2018.
2. Data from Bloomberg as of 12/31/2018.
14KARS is diverse in sector coverage, size, and geography in an attempt to capture value wherever it is being
created.
KARS Sector Breakdown KARS Market Cap Breakdown KARS Country Breakdown
Germany
14.33% Chile
Information 3.04%
Technology China
Materials Others*
38.12% Small Cap 22.31% South Korea
10.09% 7.71%
18.50% 2.23%
Communication
Services Taiwan
7.10% Large Cap 2.21%
Mid Cap
Industrials 70.99% 10.50% Switzerland
7.69%
2.12%
Ireland Peru
Consumer United States
1.99% 2.03%
Discretionary 39.83%
36.73% Netherlands
1.94%
* Others include Canada, Sweden, Austria, Japan, Australia, United Kingdom
Data from Bloomberg as of 12/31/2018.
15Fund Details As of 12/31/2018 Top Ten Holdings as of 12/31/2018 % of
The Fund’s Holdings Are Subject to Change. Fund
Primary Exchange NYSE
ALPHABET INC-CL A 3.69
KraneShares Electric Vehicles & Future Cusip 500767827 TEXAS INSTRUMENTS INC 3.62
Mobility ETF Total Annual Fund Operating
0.70% DAIMLER AG-REGISTERED SHARES 3.57
Expense
Investment Strategy:
ANALOG DEVICES INC 3.56
KARS seeks to measure the performance of Solactive Electric Inception Date 1/18/2018
Vehicles and Future Mobility Index. The Index is designed to BAYERISCHE MOTOREN WERKE AG 3.53
track the performance of companies engaged in the Distribution Frequency Semiannually
VOLKSWAGEN AG-PREF 3.51
production of electric vehicles and/or their components, or
engaged in other initiatives that may change the future of Solactive Electic Vehicles TESLA INC 3.46
Index Name
mobility. The Index includes issuers engaged in the electric and Future Mobility Index
vehicle production, autonomous driving, shared mobility, BAIDU INC - SPON ADR 3.40
lithium and/or copper production, lithium-ion/lead acid Index Ticker Bloomberg: SOLKARSN
NVIDIA CORP 3.27
batteries, hydrogen fuel cell manufacturing and/or electric
infrastructure businesses. Number of Holdings (ex Cash) 57 FORD MOTOR CO 3.26
KARS Performance History as of 12/31/2018
Cumulative % Average Annualized %
3 Mo 6 Mo Since Inception 1 Yr 3 Yr Since Inception
Fund NAV -16.45% -18.14% -27.41% – – -27.41%
Closing Price -17.24% -18.91% -27.90% – – -27.90%
Index -16.06% -18.11% -28.37% – – -28.37%
The performance data quoted represents past performance. Past performance does not guarantee future results. The investment return and principal value of an investment will fluctuate so that an
investor's shares, when sold or redeemed, may be worth more or less than their original cost and current performance may be lower or higher than the performance quoted. For performance data
current to the most recent month end, please visit www.kraneshares.com
Index returns are for illustrative purposes only. Index performance returns do not reflect any management fees, transaction costs or expenses. Indexes are unmanaged and one cannot invest directly
in an index.
16Important Notes
Carefully consider the Funds' investment objectives, risk factors, charges and expenses before investing. This and additional information can be found in the Funds' full &
summary prospectus, which may be obtained here: KARS. Read the prospectus carefully before investing.
Investing involves risk, including possible loss of principal. There can be no assurance that a Fund will achieve its stated objectives. ETF shares are not redeemable with the
issuing fund other than in large Creation Unit aggregations. Instead, investors must buy or sell ETF Shares in the secondary market with the assistance of a stockbroker. In doing
so, the investor may incur brokerage commissions and may pay more than net asset value when buying and receive less than net asset value when selling. The NAV of the Fund’s
shares is calculated each day the national securities exchanges are open for trading as of the close of regular trading on the New York Stock Exchange (“NYSE”), normally 4:00
p.m. Eastern time (the “NAV Calculation Time”). Shares are bought and sold at market price (closing price) not NAV. Market price returns are based on the midpoint of the
bid/ask spread at 4:00 pm Eastern Time (when NAV is normally determined).
The Fund is subject to political, social or economic instability within China which may cause decline in value. Fluctuations in currency of foreign countries may have an adverse
effect to domestic currency values. Emerging markets involve heightened risk related to the same factors as well as increase volatility and lower trading volume Narrowly
focused investments typically exhibit higher volatility.
The ability of the fund to achieve its objective is dependent, in part, on the continuous availability of A Shares and the ability to obtain, if necessary, additional A Shares quota. If a
Fund is unable to obtain sufficient exposure to limited availability of A Share quota, the Fund could seek exposure to the component securities of the Underlying Index by
investment in other types of securities. The fund may in invest in derivatives, which are often more volatile than other investments and may magnify the Funds’ gains or losses.
The fund is non-diversified.
Indices are unmanaged and do not include the effect of fees. One cannot invest directly in an index.
The KraneShares ETFs are distributed by SEI Investments Distribution Company (SIDCO), 1 Freedom Valley Drive, Oaks, PA 19456, which is not affiliated with Krane Funds
Advisors, LLC, the Investment Adviser for the Fund.
17Important Notes (continued)
Although Krane Funds Advisors LLC and its affiliates (“Krane”) shall obtain data from sources that Krane considers reliable, all data contained herein is provided “as is” and
Krane makes no representation or warranty of any kind, either express or implied, with respect to such data, the timeliness thereof, the results to be obtained by the use
thereof or any other matter. Krane expressly disclaims any and all implied warranties, including without limitation, warranties of originality, accuracy, completeness,
timeliness, non-infringement, merchantability and fitness for a particular purpose.
Forward-looking statements (including Krane’s opinions, expectations, beliefs, plans, objectives, assumptions, or projections regarding future events or future results)
contained in this presentation are based on a variety of estimates and assumptions by Krane. These statements generally are identified by words such as “believes,” “expects,”
“predicts,” “intends,” “projects,” “plans,” “estimates,” “aims,” “foresees,” “anticipates,” “targets,” “should,” “likely,” and similar expressions. These also include statements
about the future, including what “will” happen, which reflect Krane’s current beliefs. These estimates and assumptions are inherently uncertain and are subject to numerous
business, industry, market, regulatory, geo-political, competitive, and financial risks that are outside of Krane’s control. The inclusion of forward-looking statements herein
should not be regarded as an indication that Krane considers forward-looking statements to be a reliable prediction of future events and forward-looking statements should not
be relied upon as such. Neither Krane nor any of its representatives has made or makes any representation to any person regarding forward-looking statements and neither of
them intends to update or otherwise revise such forward-looking statements to reflect circumstances existing after the date when made or to reflect the occurrence of future
events, even in the event that any or all of the assumptions underlying such forward-looking statements are later shown to be in error. Any investment strategies discussed
herein are as of the date of the writing of this presentation and may be changed, modified, or exited at any time without notice.
This material represents an assessment of the market environment at a specific point in time and is not intended to be a forecast of future events, or a guarantee of future
results. This information should not be relied upon by the reader as research or investment advice regarding the funds or any stock in particular.
18You can also read