Enhanced Traffic Management Procedures of Connected and Autonomous Vehicles in Transition Areas - TransAID
←
→
Page content transcription
If your browser does not render page correctly, please read the page content below
Proceedings of 8th Transport Research Arena TRA 2020, April 27-30, 2020, Helsinki, Finland

                      Enhanced Traffic Management Procedures of
          Connected and Autonomous Vehicles in Transition Areas
           Sven Maerivoeta*, Anton Wijbengab, Jaap Vreeswijkb, Evangelos Mintsisc,

          Dimitrios Koutrasc, Xiaoyun Zhangd, Robbin Blokpoeld, Alejandro Correae,

                          Leonhard Lückenf, Robert Almsf, Yun-Pang Flötterödf

                                                  a
                                                    Transport & Mobility Leuven, Belgium
                                                 b
                                                  MAP traffic management, The Netherlands
                                         c
                                           Hellenic Institute of Transport (CERTH/HIT), Greece
                                                         d
                                                           Dynniq, The Netherlands
                                             e
                                                 Universitas Miguel Hernández (UMH), Spain
                                               f
                                                 German Aerospace Center (DLR), Germany

Abstract

In light of the increasing trend towards vehicle connectivity and automation, there will be areas and situations on
the roads where high automation can be granted, and others where it is not allowed or not possible. These are
termed ‘Transition Areas’. Without proper traffic management, such areas may lead to vehicles issuing take-over
requests (TORs), which in turn can trigger transitions of control (ToCs), or even minimum-risk manoeuvres
(MRMs). In this respect, the TransAID Horizon 2020 project develops and demonstrates traffic management
procedures and protocols to enable smooth coexistence of automated, connected, and conventional vehicles, with
the goal of avoiding ToCs and MRMs, or at least postponing/accommodating them. Our baseline simulations
confirmed that, e.g., a coordinated distribution of takeover events can prevent drops in traffic efficiency, which
in turn leads to a more performant, safer, and cleaner traffic system, when taking the capabilities of connected
and autonomous vehicles into account.

Keywords: Traffic management; connected and autonomous vehicles (CAVs); V2X; transition areas

*
    Corresponding author. Tel.: +32-16-317733;
    E-mail address: sven.maerivoet@tmleuven.be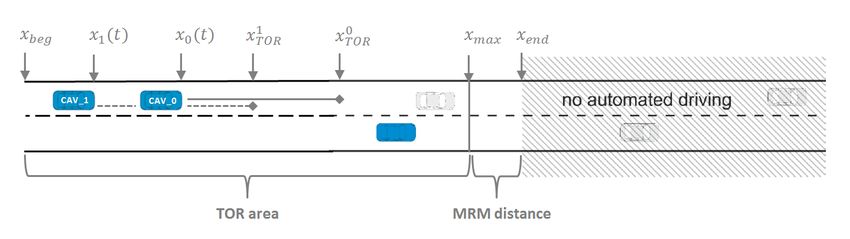
Maerivoet, Wijbenga, Mintsis, Zhang, Correa, Lücken et al. / TRA2020, Helsinki, Finland, April 27-30, 2020

1.1.1. Nomenclature

ADS               Automated driving systems
(C)AV             (Connected and/or) autonomous vehicle
MCM               Minimum-risk manoeuvre
NAD               No automated driving
ODD               Operational design domain
OEM               Original equipment manufacturer
OREM              Operational road environment model
SAE               Society of Automotive Engineers
TA                Transition area
ToC               Transition of control
TOR               Take-over request
TransAID          Transition areas for infrastructure-assisted driving
V2X               Vehicle-to-anything

2. Introduction

As the introduction of automated vehicles becomes feasible, even in urban areas, it will be necessary to
investigate their impacts on traffic safety and efficiency. This is particularly true during the early stages of
market introduction, where automated vehicles of all SAE levels, connected vehicles (able to communicate via
V2X) and conventional vehicles will share the same roads with varying penetration rates.

There will be areas and situations on the roads where high automation can be granted, and others where it is not
allowed or not possible due to missing sensor inputs, highly complex situations, etc. Moving between those
areas, there will be areas where many automated vehicles will change their level of automation. We refer to these
areas as ‘Transition Areas’.

Without proper traffic management, such areas may lead to vehicles issuing take-over requests (TORs) to their
drivers, which in turn can trigger transitions of control (ToCs) towards these drivers, or even minimum-risk
manoeuvres (MRMs) by the vehicles themselves. In this respect, the TransAID Horizon 2020 project
(‘Transition Areas for Infrastructure-Assisted Driving’) develops and demonstrates traffic management
procedures and protocols to enable smooth coexistence of automated, connected, and conventional vehicles, with
the goal of avoiding ToCs and MRMs, or at least postponing/accommodating them.

3. Outline of the traffic management framework

3.1. Techniques for traffic management

In first instance, TransAID compiled an outline of the state-of-the-art of traffic management, putting the focus
first on general approaches, including coordinated network-wide traffic management, using KPIs, layered
architectures spanning the range from top-down regulation over self-organisation to full bottom-up regulation,
and even Traffic Management-as-a-Service. We also looked at the trend towards more cooperative systems
which is well-suited for enhanced traffic management, making the systems smarter by targeting
(cooperative/connected) vehicles individually. Moreover, we looked at the expected impacts that machine
learning techniques and artificial intelligence in general would have on traffic management. Note however that
as of yet there do not exist (readily available) implementations of these more advanced traffic management
schemes. Finally, we also reviewed the existing procedures and protocols for traffic management, how to adhere
to standards and policies (on the strategical, tactical, and operational/technical levels), and to integrate these with
existing road-side systems, explained the link between goals, policies, and strategies, considered the EC
perspective via its ITS Directive, C-ITS platform, and SUMPs.

                                                                                                                          1
Maerivoet, Wijbenga, Mintsis, Zhang, Correa, Lücken et al. / TRA2020, Helsinki, Finland, April 27-30, 2020

In itself, all these solutions are very fine and usable. However, there are no (readily available) integrated traffic
management experiments or setups, taking higher degrees of vehicle automation into account. Nor do they allow
the interplay between all the various solutions to lead to a better system performance. This is where TransAID
makes the difference by creating a traffic management framework. Fleet managers of connected and/or
autonomous vehicles (CAVs), as well as road authorities, both operate backend centres to manage their fleets
and traffic networks, respectively. A more encompassing solution is needed to manage all these transition areas,
as well as the different stakeholders.

3.2. TransAID in the role of an intermediary service provider

Automated vehicles of different makes with different levels of automation will each be designed to operate in a
particular domain. Such a domain is characterised by static and dynamic attributes which range from road type
and layout to traffic conditions, weather and many attributes in between. In general, we call these domains
‘operational design domains’ (ODD), which are defined by Czarnecki (2018) as the operating conditions under
which a given driving automation system or feature thereof is specifically designed to function, including, but
not limited to, environmental, geographical, and time-of-day restrictions, and/or the requisite presence or
absence of certain traffic or roadway characteristics. An ODD may put limitations on (i) the road environment,
(ii) the behaviour of the automated driving systems (ADS)-equipped subject vehicle, and (iii) the state of the
vehicle. Furthermore, an operational road environment model (OREM) is a representation of the relevant
assumptions about the road environment in which an ADS will operate the ADS-equipped vehicle (e.g., a two-
lane rural road). An ODD of an ADS implies a set of operational environments in which the ADS can operate the
ADS-equipped vehicle. These environments can be specified using a set of OREMs, which can be in- or out-of-
scope of the ODD.

When the ODD of an AV ends, it will handover the control of the vehicle to the human driver or in case the
driver does not respond, initiate an MRM. The location of such an event is referred to as the TA. However, due
to the stochastic nature of traffic (take the occurrence and impacts of incidents for example) and the diversity of
automated vehicle makes and their capabilities, it is impossible to perfectly predict where, when, and why the
ODD ends and consequently TAs are located. Nonetheless, the existence of TAs affects both AV-fleet managers
and road authorities due to reduced performance of the vehicle and the traffic network respectively. Here,
TransAID develops infrastructure support measures for situations which normally would imply the end of the
ODD. However, as part of these support measures, AVs receive additional information and/or guidance needed
to enable them to proceed in automation mode.

AV-fleet managers and road authorities both operate backend centres to manage their fleets and traffic networks,
respectively. To effectively and systematically manage TAs on a large scale and for multiple AV fleets and
multiple road authorities, we propose a trusted third party (and where possible mandated) intermediary service. It
will then act as the single-point-of-contact for road authorities and traffic participants (or indirectly, via their
OEMs). Based on status and disengagement information from AV fleet managers and traffic management plans
from road authorities, this intermediary service acts as a delegated traffic manager who digitally implements the
TransAID infrastructure support measures. With support of the right tools, an operator continuously monitors in
real-time the traffic system and disengagement reports, based on triggers and scenarios, identifies TAs, and
finally selects the appropriate measure. An advantage of this service is that measures taken by AV-fleet
managers and road authorities can be coordinated and harmonised across multiple AV fleets and geographical
areas (managed by different road authorities). Moreover, smaller and/or rural road authorities, which may not
have backend centres or not a suitable operational overview of the road and traffic flow dynamics, can benefit
from an intermediary service that can perform this task for them. The concept of the intermediary service
approach adopted within TransAID’s traffic management scheme is depicted in Figure 1.

                                                                                                                          2
Maerivoet, Wijbenga, Mintsis, Zhang, Correa, Lücken et al. / TRA2020, Helsinki, Finland, April 27-30, 2020
Figure 1: Schematic overview of TransAID’s intermediary service approach.
4. TransAID’s services and use cases
4.1. General overview
Within TransAID we defined five different use cases where disruptions of traffic flow are expected to be most
severe as a result of transition between automation levels. The initially selected use cases were:
Service 1 (Use case 1.1): Prevent ToC/MRM by providing vehicle path information
Service 2 (Use case 2.1): Prevent ToC/MRM by providing speed, headway and/or lane advice
Service 3 (Use case 3.1): Prevent ToC/MRM by traffic separation
3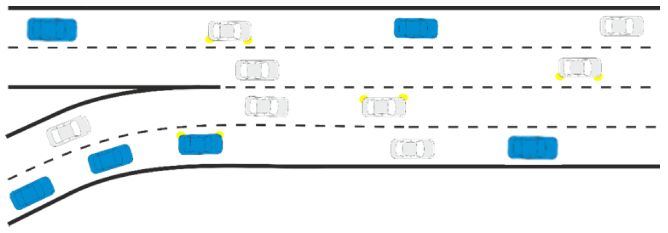
Maerivoet, Wijbenga, Mintsis, Zhang, Correa, Lücken et al. / TRA2020, Helsinki, Finland, April 27-30, 2020
Service 4 (Use case 4.2): Manage MRM by guidance to safe spot (urban & motorway)
Service 5 (Use case 5.1): Distribute ToC/MRM by scheduling ToCs
In addition, we elaborated all use cases with general descriptions, timelines, road networks, and requirements on
the vehicle capabilities, vehicle numbers, and traffic compositions. For each of these use cases, we listed when
(i.e. for which Level of Service and vehicle mix), where (what is the spatial extent of the transition area, and at
which location should the system inform vehicles/drivers?), and how (what specific traffic management
measures should be taken?) traffic management measures should be applied.
4.2. Used traffic conditions and vehicle mixes
The ‘right’ traffic management measures are dependent on traffic conditions and the vehicle mix. The following
Tables 1, 2, and 3 give an overview of their values:
Definition of the levels of service (LOS) A through C (HCM, 2010)
Distribution of passenger vehicles versus LGV and HGV
Overview of the different vehicle types, aggregated into classes of actors
Artificial vehicle mixes for baseline simulations
Table 1: Vehicles/hour/lane for Level of Service A, B and C in urban, rural, and motorway conditions.
LOS A LOS B LOS C
Urban (50km/h) – 1500 veh/h/l 525 825 1155
Rural (80 km/h) – 1900 veh/h/l 665 1045 1463
Motorway (120 km/h) – 2100 veh/h/l 735 1155 1617
Intensity / Capacity (IC) ratio 0.35 0.55 0.77
Table 2: Classification of actors (vehicle types).
Class Name Class Type Vehicle Capabilities
– Legacy Vehicles
Class 1 Manual Driving
– (C)AVs/CVs (any level) with deactivated automation systems
– AVs/CVs capable of Level 1 and 2 automation
Partial
Class 2 – Instant TOC (uncontrolled driving in case of distracted driving)
Automation
– No MRM capability
– (C)AVs capable of Level 3 automation (level 3 systems activated)
Conditional – Basic ToC (normal duration)
Class 3
Automation – MRM capability (in the ego lane depending on speed and a predetermined desired
MRM deceleration level)
– (C)AVs capable of Level 4 automation (automation activated)
High – Proactive ToC (prolonged duration)
Class 4
Automation – MRM capability (in the rightmost lane depending on speed and a predetermined
desired MRM deceleration level)
4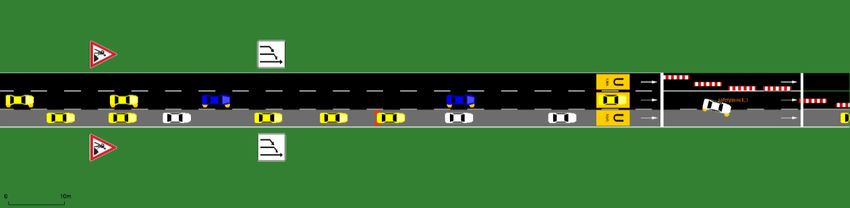
Maerivoet, Wijbenga, Mintsis, Zhang, Correa, Lücken et al. / TRA2020, Helsinki, Finland, April 27-30, 2020
Table 3: Artificial vehicle mixes for baseline simulations during 1st project iteration.
Vehicle Class 1 Class 1 Class 2 Class 2 Class 3 Class 3 Class 4 Class 4
Mix (Conn.) (Conn.) (Conn.) (Conn.)
1 60% 10% - 15% - 15% - -
2 40% 10% - 25% - 25% - -
3 10% 10% - 40% - 40% - -
4.3. Simulation and analysis methodology
The initial proof-of-concepts of traffic management measures were implemented using the SUMO microscopic
traffic simulator for a realistic representation of traffic, and the Python programming environment to code the
traffic management procedures. We are currently in the process of porting these to the iTETRIS simulation
platform which additionally includes the ns-3 simulator to achieve realistic communication capabilities and
collective sensing. They are calibrated and validated using predefined sets of KPIs/metrics. For each use case,
we compare the cases with and without (i.e. base line) active traffic management measures. They are evaluated
on their impacts on traffic efficiency (network-wide in terms of average speeds and throughput, and local in
terms of tempo-spatial diagrams), traffic safety (by means of the number of events where a time-to-collision
lower than 3 seconds occurred), and the environmental impacts (considering CO2 emissions as calculated by
SUMO’s PHEMlight emissions model).
Figure 2: Detail view of the merging area in SUMO for scenario 1. The grey lane is usually reserved for public transport but opened
temporarily to provide a possibility to pass the construction works stretching over the two main lanes. Vehicle colours indicate the vehicle
type (yellow for legacy vehicles, blue for CAVs, and white for CVs).
5. Example Service 5 / Use case 5.1
5.1. Introduction
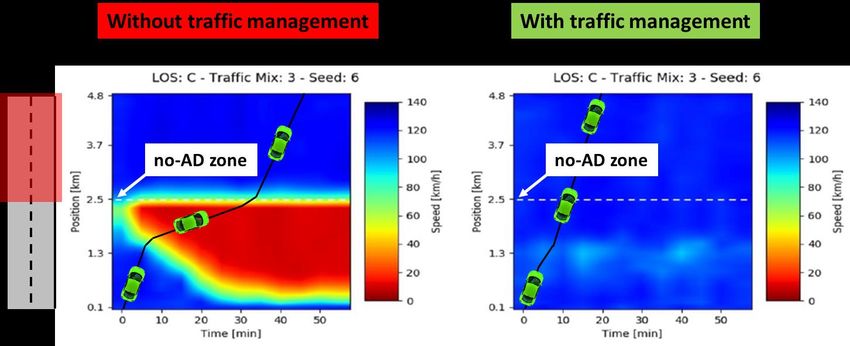
As an example, we look at Service 5 / Use case 5.1, i.e. Distribute ToC/MRM by scheduling ToCs. Here,
external reasons might determine if automated driving will be forbidden in certain traffic areas (which we call
‘no automated driving’ (NAD) zones). Service 5 aims to inform approaching C(A)Vs in order to initiate
transitions to manual driving in a coordinated manner. In absence of additional guidance and coordination we
expected to have an accumulated occurrence of transitions at specific locations, which can lead to adverse effects
regarding traffic safety and efficiency. Thus, Service 5 implements a scheme for the distribution of TORs sent to
C(A)Vs ahead of the NAD zone within a dedicated TOR area (as shown in Figure 3).
Figure 3: Schematic distribution area for TORs within a transition area.
5Maerivoet, Wijbenga, Mintsis, Zhang, Correa, Lücken et al. / TRA2020, Helsinki, Finland, April 27-30, 2020
5.2. Traffic management setup
In Figure 4 the principle control logic of Service 5 is presented as a flow chart. The TMC monitors the area
upstream of the NAD zone and regularly obtains positions and speeds from each C(A)V. Furthermore,
information about the traffic distribution in the monitored area is derived from collective perception and road
side detectors.
Figure 4: Traffic management block diagram for use case 5.1.
Consecutive C(A)Vs are pooled into groups at the entrance to the monitored area, and their transitions are
supervised and coordinated algorithmically. The traffic management algorithm assigns a TOR schedule for every
vehicle depending on the estimated density within the TOR area, the current position, and speed of the vehicle,
and its position within the corresponding vehicle group. It takes in-group coordination into account, and aims to
prevent the compounding of braking efforts. Generally speaking, the timeline of events for Service 5 is given as
follows:
6Maerivoet, Wijbenga, Mintsis, Zhang, Correa, Lücken et al. / TRA2020, Helsinki, Finland, April 27-30, 2020
5.3. Simulation results
Within TransAID, we simulate the different use cases first as a baseline using the earlier mentioned parameters,
and then with the activation of the chosen traffic management service. For Service 5, we can see for example
how, given the network, activation of the traffic management system leads to a higher average network speed
compared to the baseline for Level of Service C, as shown in the graphs in Figure 5.
Figure 5: Average network speeds for use case 5.1 (motorway network) simulation experiments (varying the LOS and vehicle mixes).
Different bar colours correspond to baseline and traffic management simulations.
Figure 6 illustrates the speed losses and reduced flows for the sample of LOS C, vehicle mix 3, seed 6. The NAD
zone starts at a position of 2.5 km. For the baseline we observe a breakdown of average speed triggered by
perturbances arising from several simultaneous ToCs at close locations. Such disruptions leading to a stationary
bottleneck located at the NAD zone entry occur in most simulations runs sooner or later within the one hour
simulation interval. Once developed, the bottleneck hardly dissolves if demand is not low (LOS B and C). In the
depicted example the bottleneck emerges already after approximately five minutes and congestion rapidly grows
filling the simulated area after approximately 25 minutes (cf. the red area in the upper left plot of the Figure).
These phenomena vanish in the presence of a coordinated distribution of TORs. Even if local disruptions are
present (i.e. the lighter spots in upper left plot of the Figure), the prevention of locally concentrated series of
ToCs allows them to dissolve such that a smooth flow is re-established (cf. the green-yellow areas in lower right
plot of the Figure).
Figure 6: Example tempo-spatial diagrams for measured speeds for use case 5.1 (LOS C, vehicle mix 3, seed 6). The left diagram
corresponds to the baseline and the right one to the applied traffic management Service 5 simulations. The white dashed line marks the entry
position of the NAD zone.
7Maerivoet, Wijbenga, Mintsis, Zhang, Correa, Lücken et al. / TRA2020, Helsinki, Finland, April 27-30, 2020
6. Main results
6.1. Results for all the use cases
A complete overview of the results can be found in (TransAID D4.2, 2019). In the following paragraphs, we
summarise the main results:
In the first service, path information was provided to AVs to circumvent road works via a bus lane.
Simulation results indicated that overall traffic efficiency and CO2 emissions remained unchanged,
while traffic safety was improved significantly. Safety critical events were reduced ranging from 45%
to 70%, depending on the level of service and traffic composition. The reduction was larger in case of
less traffic and more AVs.
The second service was applied to a motorway merge area where AVs are given speed advice to merge
onto the motorway (see also Blokpoel, 2019). The service slightly increased average network speed and
slightly decreased CO2 emissions, especially in case of higher demand (LOS C). The impact on safety
was more pronounced with a reduction of critical events around 75%.
The third service was applied to a merging situation where two two-lane motorways merge into one
four-lane motorway. The idea is to harmonise traffic by assigning the outer lanes to AVs, thereby
reducing close interactions between non-automated vehicles and AVs in the merging area. Only in case
of higher shares of AVs (> 25% level 2, > 25% level 3) in combination with LOS B or C, improvements
were observed in throughput at the cost of slightly lower average network speeds and a decrease in
safety. In short, rearranging traffic to dedicated lanes shows largely similar performance to
‘uncontrolled merging’ (i.e. no measures). However, we hypothesise that separating traffic can
outperform uncontrolled merging when cooperative manoeuvring is applied.
For Service 4 both an urban and motorway scenario were studied with similar network layouts. On a
two-lane road we created safe spots upstream of a road works zone on the left lane for AVs to stop in
case they reach the limit of their operational design domain. In this case the open right lane remains
unblocked. As expected, traffic, safety and environmental benefits are realised. Only in case of
congestion, when traffic is already moving slowly, the improvement diminishes.
Finally, a no automated driving zone was simulated along the downstream part of a two-lane motorway
for the fifth service. The zone can represent different situations (e.g., road works, geofences, weather,
accidents, …) that prevent AVs from staying in automated driving mode. It is assumed that AVs
increase their headway before handing over control to the driver. When this happens in a concentrated
fashion just before the no-AD zone, traffic flow is impacted. We therefore distribute these handovers in
time and space upstream of the zone. It was found that this service greatly smoothens out the
disturbances caused by the handovers and improves traffic efficiency, as also elaborated upon Section
0.
6.2. Next steps and new use cases
The infrastructure-assisted management solutions are developed and tested in two iterations, each taking half of
the project total duration. During the first iteration, the focus lay on studying aspects of transition of control and
transition areas through basic scenarios. To this end, we developed and adopted realistic models for automated
driving and ToC. Using the basic scenarios, we ran many simulations and focused in detail on the relatively new
aspects of ToC, transition areas and measures mitigating negative effects of TAs. The goal of the first iteration
was to gain experience with all aspects relevant to TAs and the mitigating measures. During the second iteration
which has just started, all of the previous experience is used to improve/extend the measures while at the same
time increasing the complexity/realism of the scenarios and/or selecting different (more complex) scenarios.
Moreover, it is used to enhance AV and driver models to accurately capture the effects of ToCs/MRMs on
safety, traffic efficiency, and the environment.
8Maerivoet, Wijbenga, Mintsis, Zhang, Correa, Lücken et al. / TRA2020, Helsinki, Finland, April 27-30, 2020
To this end, we will also focus on the following new scenarios: Scenario 1.3 (Queue spillback at exit ramp),
Scenario 2.3 (Intersection handling due to incident), and Scenario 4.1 + Service 5 (4.1-5) (Distributed safe spots
along an urban corridor).
Scenario 1.3 Scenario 2.3 Scenario 4.1 + Service 5
These new scenarios partly focus on new situations and others combine multiple measures (services) into one
scenario. It is expected the hierarchical approach of applying multiple services (i.e. speed and lane advice, safe
spot reservation, and ToC requests) in parallel or sequential will result in improved mitigation of the negative
impact of transition areas. In addition, we will research ideas to improve on vehicle modelling (i.e. lane change
behaviour and ToC/MRM behaviour). Moreover, enhanced cooperative manoeuvring (merging) will be also
investigated. Furthermore, to focus on more realistic scenarios, each scenario will be extended with opposite
traffic to create realistic communication traffic and support the evaluation of possible congestion of the
communication channels. Also, other types of vehicles will be used to create a more realistic traffic mix (i.e.
adding light good vehicles and heavy good vehicles), aside from the already proposed mixes of vehicles
encompassing different communication and automation capabilities.
7. Conclusions
It is clear that advanced traffic management procedures lead to a more performant, safer, and cleaner traffic
system, when taking the capabilities of connected and autonomous vehicles into account. As an example of a
traffic management service, our baseline simulations confirmed the hypothesis that a coordinated distribution of
takeover events can prevent a drop in traffic efficiency in areas where an accumulated occurrence of transitions
may be expected. For the assessment we assumed that in absence of a managed TOR coordination the takeover
events will be concentrated closer to the area, where no automated driving is possible. Our simulation results
encourage the pursuit of the approach of ToC distribution. As the main reason for the effectiveness of this we
identified the prevention of compounding braking efforts occurring if a sequence of CAVs performs transitions
to manual driving simultaneously.
Acknowledgements
This project has received funding from the European Union’s Horizon 2020 research and innovation programme
under grant agreement No 723390.
References
Blokpoel, R. et al. (2019). Motorway merging assistant for automated vehicles, in proceedings of the 13th ITS European Congress,
Brainport, The Netherlands, 3—6 June 2019
Czarnecki K. (2018). Operational Design Domain for Automated Driving Systems: Taxonomy of Basic Terms, Waterloo Intelligent Systems
Engineering (WISE) Lab, University of Waterloo, Canada
TransAID (2018-2019). Deliverable D4.1: Overview of Existing and Enhanced Traffic Management Procedures / Deliverable D4.2:
Preliminary simulation and assessment of enhanced TM measures
Maerivoet S. et al. (2019). Enhanced Traffic Management Procedures in Transition Areas, in proceedings of the 13th ITS European Congress,
paper number ITS-TP1971, Brainport, The Netherlands, 3—6 June 2019
National Research Council (U.S.) (Ed.). (2010). Highway Capacity Manual. Washington, D.C.: Transportation Research Board, National
Research Council
9You can also read