Access to mass rapid transit in OECD urban areas
←
→
Page content transcription
If your browser does not render page correctly, please read the page content below
arXiv:2009.03700v1 [physics.soc-ph] 8 Sep 2020

                                                    Access to mass rapid transit in OECD urban
                                                                       areas
                                                                Vincent Verbavatz1,2 , Marc Barthelemy1,3*
                                                                                September 9, 2020

                                                 1. Université Paris-Saclay, CNRS, CEA, Institut de physique théorique, 91191,
                                                 Gif-sur-Yvette, France.
                                                 2. Ecole des Ponts ParisTech, Champs-sur-Marne, France.
                                                 3. Centre d’Etude et de Mathématique Sociales, CNRS/EHESS, 54 Boulevard
                                                 Raspail, 75006 Paris, France.
                                                 *corresponding author: Marc Barthelemy (marc.barthelemy@ipht.fr)

                                                                                       Abstract
                                                           As mitigating car traffic in cities has become paramount to abate cli-
                                                       mate change effects, fostering public transport in cities appears ever-more
                                                       appealing. A key ingredient in that purpose is easy access to mass rapid
                                                       transit (MRT) systems. So far, we have however few empirical estimates
                                                       of the coverage of MRT in urban areas, computed as the share of people
                                                       living in MRT catchment areas, say for instance within walking distance.
                                                       In this work, we clarify a universal definition of such a metrics - People
                                                       Near Transit (PNT) - and present measures of this quantity for 85 urban
                                                       areas in OECD countries – the largest dataset of such a quantity so far.
                                                       By suggesting a standardized protocol, we make our dataset sound and
                                                       expandable to other countries and cities in the world, which grounds our
                                                       work into solid basis for multiple reuses in transport, environmental or
                                                       economic studies.

                                                 Background & Summary
                                                 Motorized transport currently accounts for more than 15% of world greenhouse
                                                 gas emissions 1 . As most humans live in urban areas and two-thirds of world
                                                 population will live in cities by 2050 2 , mitigating car traffic in cities has be-
                                                 come crucial for limiting climate change effects 3–6 . Daily mitigating is the main
                                                 driver for passenger car use - about 75% of American commuters drive daily 7
                                                 - while alternative transport modes such as public transportation networks are
                                                 unevenly developed among countries and cities 8 .
Over the last decades, various attempts to assess the environmental impact
of car use in cities have emerged from multiple fields, ranging from econometric
studies to physics or urban studies 13,9–12 . A seminal result of transport the-
ory, by Newman and Kenworthy 12 , correlated transport-related emissions with
a determinant spatial criterion: urban density. Alternatively, Duranton and
Turner 13 claimed that public transport services were to unsuccessful in reduc-
ing traffic, as transit riders lured off the roads are replaced by new drivers on
the released roads. Such results, however, crucially lack both theoretical and
empirical foundations 14,16,15,17 and new research 18 shows that the two main
critical factors that control car traffic in cities are urban sprawl and access to
mass rapid transit (MRT).

    More generally, understanding mobility in urban areas is fundamental, not
only for transport planning, but also for understanding many processes in cities,
such as congestion problems, or epidemic spread 19,20 for example. But what is
a good measure of access to transit? Studies have mainly focused on the num-
ber of lines or stops 21–23 , length of the network or graph analysis 24–26 . Few
works 27,28,18 , however, have considered investigating catchment areas of MRT
stations, i.e. looking at the share of population living close to MRT stations,
for instance within walking distance. Such conditions have however proved to
be essential in explaining commuting behaviours and mobility patterns 18 .

    The most detailed definition of such catchment metrics is the People Near
Transit (PNT), and originates from a 2016 publication from the Institute for
Transportation and Development Policy (IDTP) 27 . It produces a rigorous
dataset of the share of population living close to transit (less than 1 km) for 25
cities in the world (12 in OECD countries). However, definitions of urban areas
and rapid transit systems in that dataset are multiple and need to be refined
while the number of cities must be expanded.

   Hence, in order to expand our global knowledge of urban mobility, we need
a common, unified and universal definition of access to public transit as well as
sound measures of such a quantity. In this paper, we clarify its definition and
propose what is to our knowledge the largest dataset of PNT globally.

    Our analysis uses functional urban areas (FUA) in OECD countries, a con-
sistent definition of cities across several countries 29 . We restrict our measures
to mass rapid transit, usually referring to high-capacity heavy rail public trans-
port, to which we added light rails and trams. In our sense, mass rapid transit
thus encompasses:
   • Tram, streetcar or light rail services.
   • Subway, Metro or any underground service.

   • Suburban rail services.
Buses are not comprised in that definition. In contrast with 27 , we do not exclude
any form of commuting trains based on station spacing or schedule criteria. As
we detail it in the Method section, we identify services and corresponding stops
with the General Transit Feed Specification (GTFS), a common format for pub-
lic transportation schedules and associated geographic information 30 .
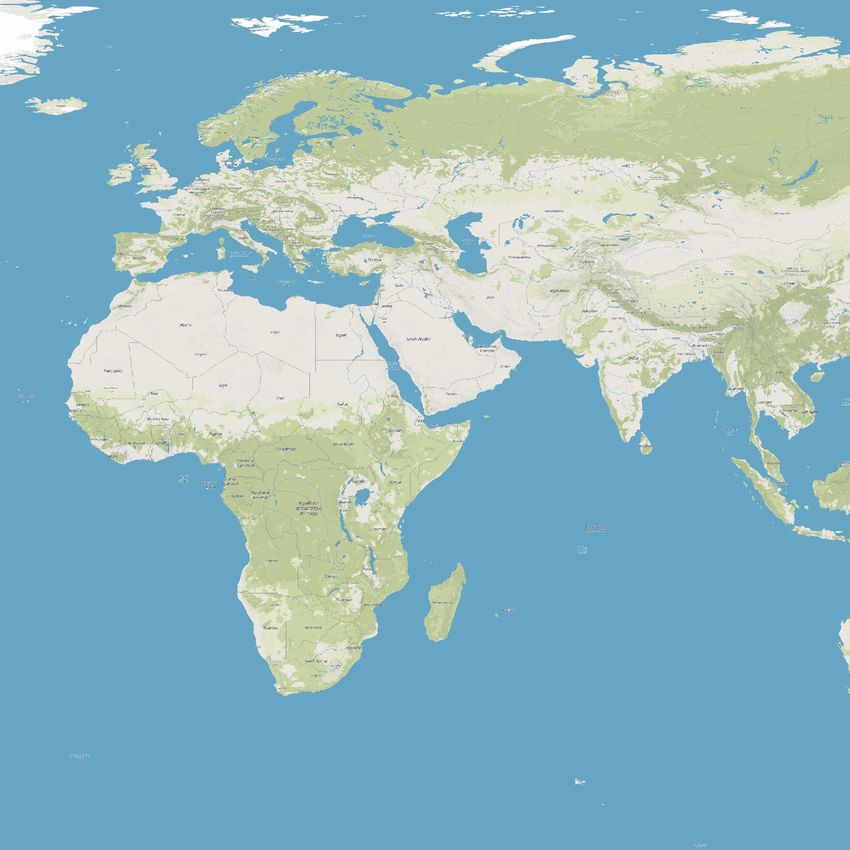
Crossing open-access information from public transport agencies in OECD
urban areas with population-grid estimates of world population 31 , we publish
here a list of 85 OECD cities (see Fig. 1) for which we were able to compute
the People Near Transit (PNT) levels defined as the share of urban population
living at geometric distances of 500 m, 1,000 m and 1,500 m from any MRT
station in the agglomeration:
population s. t. cartesian minimum distance < d
PNT(d) = (1)
total population
where d = 500, 1000, 1500.
We display on Tables 1 and 2 the 5 cities with easiest access to MRT (largest
PNT) and the 5 cities with scarcest access to MRT (smallest PNT).
We also provide for each city the population grid-maps with corresponding
MRT access level, i.e. grid-maps of MRT catchment areas at different distances
with population in each grid. As an example, Fig. 2 shows the 1000 m catch-
ment area of MRT stations in Paris.
Methods
Residential populations for FUA
Our analysis relies on the 2015 residential population estimates mapped into
the global Human Settlement Population (GHS-POP) project 31 . This spatial
raster dataset depicts the distribution of population expressed as the number
of individuals per cell on a grid of cells 250 m long. Residential population
estimates for the target year 2015 are provided by CIESIN GPWv4.10 39 and
were disaggregated from census or administrative units to grid cells.
We downloaded population tiles that cover land on the globe in the Moll-
weide projection (EPSG:54009) and in raster format (.tif files). These raster
data are made of pixels of width 250 m with associated value the number of peo-
ple living in the cell. We processed the downloaded tiles with Python 3.7.6 37
and package gdal 3.0.2 38 to convert the raster files into vectorized shapefiles.
The resulting shapefiles are comprised of polygons with field value the popula-
tion in each polygon. Since the polygonization process merges adjacent pixels
with common value into single polygons, populations for each polygon must be
recomputed from polygon area and density through the simple following rule:
                                               Areapolygon
                     Poppolygon = Poppixel ×                                (2)
                                                Areapixel

where Areapixel = 250 × 250 = 62 500 m2 . This leaves us with a list of 224
shapefiles of population that cover land area on earth.

   By intersecting the resulting shapefiles with OECD shapefiles delineating
Functional Urban Areas (FUA) in OECD countries 29 (reprojected into Moll-
weide projection), we can build a population-grided dataset of cities in OECD
countries.

   These resulting files are the population substrates used for measuring pop-
ulation living close to MRT stations.

Extracts of MRT stations from GTFS files
A common and de facto standard format for public transportation schedules
and associated geographic information is the General Transit Feed Specification
(GTFS) 30 .

   A GTFS feed is a collection of at least six CSV files (with extension .txt)
contained within a .zip file. It encompasses general information about transit
agencies and routes in the network, schedule information such as trips and stop
times and geographic information for stops (geographic coordinates).

   The three main objects we require are:
   • Routes: distinct routes in the network of a certain type. A route is a
     (one-direction) regular line, for instance a metro or bus line. The route
     types we use are 30 :
        – Tram, Streetcar, Light rail. Any light rail or street level system
          within a metropolitan area.
        – Subway, Metro. Any underground rail system within a metropolitan
          area.
        – Rail. Used for intercity or long-distance travel.
        – Cable tram. Used for street-level rail cars where the cable runs be-
          neath the vehicle, e.g., cable car in San Francisco.
     Our definition of MRT excludes bus and ferry types:

        – Bus. Used for short- and long-distance bus routes.
        – Ferry. Used for short- and long-distance boat service.
• Trips: trips are associated to a route and define a particular and scheduled
     trip between specific stations. For instance, the first train of the day is a
     trip.
   • Stops: stops are geographic locations of the stops, stations and their
     amenities within the transit system. Stops are organized into a parent
     station and their amenities (e.g. platforms or exits).
Joining in this order the four tables routes.txt, trips.txt, stop_times.txt
and stops.txt lets us bind stops with their associated route types. We can
thus discriminate between bus stops and metro stops and thereby limit to our
definition of MRT.

   In a nutshell each GTFS file can be processed to produce localized and
route-typed stops.

Measure of People Near Transit (PNT)
In order to measure PNT within urban areas, we must bind transit systems with
their respective FUAs. We need to retrieve - and merge - all available GTFS
files pertaining to a specific urban area and make sure that no rapid transit
agency is excluded in the process.

    Most GTFS files for cities in the world are collected by the OpenMobility-
Data platform 32 . For each city in our dataset, we cross-checked the OpenMobil-
ityData with Wikipedia local network information 8 to ensure that we considered
all agencies of rapid transit within the urban area.

   For some European countries (Germany, France), GTFS files were not availaible
on OpenMobilityData and have been retrieved from other sources 33,34 . We also
note that GTFS format is not common in South Korea, Japan and in the United
Kingdom where we only found GTFS data for Manchester area on OpenMobil-
ityData 32 while we directly used station coordinates for London 40 .

    We were thus left with a list of 85 urban areas in the world for which we
had complete, reliable and extensive data. From route-typed stop coordinates
within that dataset, we can extract MRT stops (excluding buses and ferries) and
buffer - still using gdal - catchment areas for several distance thresholds: 500 m,
1 000 m and 1 500 m. Intersecting the resulting buffers with the population-
grided shapefiles gives us the total population living within catchment areas,
that can be expressed as a share of the total urban area population resulting in
the value of the PNT metric. Our results are shown in Online-only Table 3.

Code availability
Detailed code generating the database can be accessed from the source code
hosted via Gitlab 35 .
Data Records
The Data Record of PNT in OECD urban areas is available online on Figshare 36 .
PNT levels at distance thresholds: 500 m, 1 000 m and 1 500 m for the 85
Functional Urban Areas are shown on the Online-only Table 3. The list of transit
agencies for each city is online along with PNT statistics (mrt_access.csv) 36 .
We also provide, for each city, grid-maps of population at different distances
from MRT(pops_close_to_MRT.zip) 36 .
The Tables read as follows: Basel urban area has 528811 inhabitants, of
which 57.78% live within 500 m of a MRT station, 80.15% within 1 000 m and
86.96% within 1 500 m.
Technical Validation
The most thorough and exhaustive measure of PNT in urban areas in existing
literature is a 2016 report from the Institute for Transportation and Develop-
ment Policy 27 . To validate our results and our methodology, we compared them
with those results.
Out of the 12 OECD cities considered in 27 , 11 are in our dataset: 5 in the
United States, 2 in Spain, 1 in Canada, 1 in France, 1 in the United Kingdom
and 1 in the Netherlands (see Table 4). Unfortunately, we found no data in the
remaining city: Seoul.
Out of these 11 cities, we had at first glance similar results for only two
cities: Chicago (13% for both) and Vancouver (19% vs 23%). The discrepan-
cies observed for the other cases stem from different definitions of cities and
from the different transit systems that were taken into account. While we work
with Functional Urban Areas (FUA) only, the authors of 27 mix two different
definitions of cities: FUA and urban cores. By applying our method to urban
cores and not functional urban areas, we found the same or similar results for
Barcelona, Madrid, Rotterdam and Washington (see Table 4).
Also, the authors of 27 considered a definition of the LRT (Light Rail Tran-
sit) and Suburban Rail that depends on station spacing and schedule criteria.
We didn’t choose this definition and for Boston and New York, we had therefore
to exclude suburban trains - while keeping the definition of FUA - in order to
retrieve results similar to those of Table 4. In contrast, the study 27 took into
account the Bus Rapid Transit for Los Angeles, that we decided to exclude.Finally, in Paris the authors of 27 considered that the so-called RER trains were
comprised in Suburban Rail, but not Transilien trains, while we included both
systems in our analysis.
The conclusion here is that for similar definitions for cities and transit sys-
tems, we obtain similar results, validating our method and calculations. To
facilitate comparison across future studies, we would recommend using the defi-
nition of cities given by Functional Urban Areas since it is very commonly used
and already unified for OECD countries. Concerning transit systems, we think
that it is more relevant and also verifiable to consider transit systems based on
their types (Rail versus Road) rather that on spacing and schedule criteria that
are specious and less universal. Hence, in comparing our results with results
from the IDTP report 27 and after checking on Table 4 that our methodology is
correct, we decided to keep our unmodified estimations for the considered cities,
despite the discrepancies with 27 .
For other cities in the dataset we have unfortunately found no existing data
to compare with. Thus, we hope for future research to test and expand our
estimations and results.
Usage Notes
Easy code and hints are given on Gitlab 35 .
We strongly recommand using GDAL 38 to handle geographic data with Python.
Acknowledgements
VV thanks the Ecole nationale des ponts et chaussées for their financial support.
This material is based upon work supported by the Complex Systems Institute
of Paris Ile-de-France (ISC-PIF).
Author contributions
VV and MB designed the study, VV acquired the data, VV analyzed and inter-
preted the data, VV and MB and wrote the manuscript.
Competing interests
The authors have no competing interests.References
[1] Herzog, T. World greenhouse gas emissions in 2005. World Resources Insti-
tute (2009).
[2] United Nations, Department of Economic and Social Affairs, Population
Division. World Urbanization Prospects: The 2014 Revision. Highlights
ST/ESA/SER.A/352 (2014).
[3] Dodman D. Blaming cities for climate change? An analysis of urban green-
house gas emissions inventories. Environment and Urbanization 21, 185-201
(2009).
[4] Glaeser E. L. & Kahn M. E. The greenness of cities: Carbon dioxide emis-
sions and urban development. Journal of Urban Economics 67, 404-418
(2010).
[5] Oliveira E. A., Andrade Jr. J. S. & Makse H. A. Large cities are less green.
Scientific Reports 4, 13-21 (2014).
[6] Newman P.G. The environmental impact of cities, Environment and Urban-
ization 18, 275-295 (2006).
[7] U.S. Department of Transportation, Bureau of Transportation Statistics,
National Transportation Statistics. Table 1-41 at http://www.bts.gov
(2016).
[8] Wikipedia contributors. List of Metro Systems, Wikimedia Foundation
https://en.wikipedia.org/wiki/List_of_metro_systems (2020).
[9] Creutzig F. et al. Global typology of urban energy use and potentials for
an urbanization mitigation wedge. Proceedings of the National Academy of
Sciences 112.20, 6283-6288 (2015).
[10] Pumain D. Scaling laws and urban systems (2004).
[11] Barthelemy M. The structure and dynamics of cities. Cambridge University
Press (2016).
[12] Newman P. G. & Kenworthy J. R. Cities and automobile dependence: An
international sourcebook (1989).
[13] Duranton G. & Turner M. A. The fundamental law of road congestion: Ev-
idence from US cities. American Economic Review, 101(6), 2616-52 (2011).
[14] Buchanan M. The benefits of public transport. Nat. Phys. 15, 876 (2019).
[15] Anderson M. L. Subways, strikes, and slowdowns: The impacts of public
transit on traffic congestion. American Economic Review 104(9), 2763-96
(2014).[16] Litman T. Evaluating rail transit benefits: A comment. Transport Policy
14(1), 94-97 (2007).
[17] Baum-Snow N., Kahn M. E. & Voith R. Effects of urban rail transit expan-
sions: Evidence from sixteen cities, 1970-2000. Brookings-Wharton papers
on urban affairs, 147-206 (2005).
[18] Verbavatz V. & Barthelemy M. Critical factors for mitigating car traffic in
cities. PLoS one 14(7) (2019).
[19] Dalziel B.D., Pourbohloul B. & Ellner S.P. Human mobility patterns pre-
dict divergent epidemic dynamics among cities. Proceedings of the Royal
Society B: Biological Sciences 280, 20130763 (2013).
[20] Balcan D., Colizza V., Gonçalves B., Hu H., Ramasco J.J. & Vespignani A.
Multiscale mobility networks and the spatial spreading of infectious diseases.
Proceedings of the National Academy of Sciences, 106, 21484-21489 (2009).
[21] Fouracre P., Dunkerley C. & Gardner G. Mass rapid transit systems for
cities in the developing world. Transport Reviews 23(3), 299-310 (2003).
[22] Gallotti R. & Barthelemy M. Anatomy and efficiency of urban multimodal
mobility. Scientific reports 4, 1-9 (2014).
[23] Gallotti R. & Barthelemy M. The multilayer temporal network of public
transport in Great Britain. Scientific Data 2, 1-8 (2015).
[24] Musso A. & Vuchic V. R. Characteristics of metro networks and methodol-
ogy for their evaluation. National Research Council, Transportation Research
Board (1988).
[25] Gattuso D. & Miriello E. Compared analysis of metro networks supported
by graph theory. Networks and Spatial Economics 5(4), 395-414 (2005).
[26] Derrible S. & Kennedy C. The complexity and robustness of metro net-
works. Physica A: Statistical Mechanics and its Applications 389(17), 3678-
3691 (2010).
[27] Marks M., Mason J. & Oliveira, G. People near transit: Improving accessi-
bility and rapid transit coverage in large cities, Institute for Transportation
and Development Policy (2016).
[28] Singer G. & Burda C. Fast Cities: A comparison of rapid transit in major
Canadian cities (2014).
[29] Dijkstra L., Poelman H. & Veneri P. The EU-OECD definition of a func-
tional urban area. OECD Regional Development Working Papers, 2019/11,
Éditions OCDE, Paris (2019).
[30] GTFS Static Overview. https://developers.google.com/transit/gtfs
(2020).[31] Florczyk A. J. et al. GHSL Data Package 2019. Publications Office of the
European Union, Luxembourg, ISBN 978-92-76-13186-1 (2019).
[32] OpenMobilityData https://transitfeeds.com (2020).
[33] GTFS für Deutschland https://gtfs.de/ (2020).
[34] Open platform for French public data https://www.data.gouv.fr (2020).
[35] Verbavatz, V. Source code. Gitlab https://gitlab.iscpif.fr/
vverbavatz/mrt-access-project (2020).
[36] Verbavatz, V. & Barthelemy, M.: People Near Transit (PNT). Figshare
Dataset https://doi.org/10.6084/m9.figshare.12013020.v4 (2020).
[37] Python Software Foundation. Python Language Reference, version 3.7.6
available at http://www.python.org.
[38] GDAL/OGR contributors. GDAL/OGR Geospatial Data Abstraction
software Library, Open Source Geospatial Foundation https://gdal.org
(2020).
[39] Center for International Earth Science Information Network
(CIESIN)—Columbia University. Gridded population of the world,
version 4 (GPWv4): population density. (2016).
[40] Transport for London. TFL Station Locations available at https://data.
london.gov.uk/dataset/tfl-station-locations (2020).
[41] MapTiler, OpenStreetMap contributors. MapTiler Basic and MapTiler
Topo. https://www.maptiler.com (2020).Figure 1: The 85 OECD cities for which we found data are mostly found in Europe and in North America 41 .
Figure 2: 1000 m catchment areas of MRT stations (in orange) in Paris func-
tional urban area (boundaries are in black) 41 .
500 m          1000 m            1500 m
  City        Country        Population
                                             PNT (%)        PNT (%)           PNT (%)
  Basel      Switzerland        528811         57.78          80.15             86.96
 Bilbao         Spain           986042         56.84          76.79             83.52
 Geneva      Switzerland        592893         50.44          74.68             85.07
 London    United Kingdom      11754700        43.09          72.56              85.8
 Zurich      Switzerland       1329898         42.7           68.18             82.09

Table 1: Population Near Transit values: Share of population living within
catchment area from a MRT station at thresholds 500 m, 1 000 m and 1 500 m.
Top 5 cities with easiest (1000 m) access to MRT.
500 m 1000 m 1500 m
City Country Population
PNT (%) PNT (%) PNT (%)
Winnipeg Canada 846133 0 0 0
Detroit United States 4263202 0.1 0.18 0.31
Houston United States 6706227 0.98 2.28 3.54
Miami United Sates 5964846 1.26 3.51 5.65
Dallas United States 7294931 1.18 4.05 7.64
Table 2: Population Near Transit values: Share of population living within
catchment area from a MRT station at thresholds 500 m, 1 000 m and 1 500 m.
5 cities with poorest (1000 m) access to MRT.500 m 1000 m 1500 m
City Country Population
PNT (%) PNT (%) PNT (%)
Adelaide Australia 1368481 11.43 27.9 40.79
Amsterdam Netherlands 2766282 21.4 39.14 52.66
Athens Greece 3667934 41.73 63.26 74.43
Barcelona Spain 4838161 41.65 65.24 77.82
Basel Switzerland 528811 57.78 80.15 86.96
Berlin Germany 4953645 38.39 63.02 76.13
Bilbao Spain 986042 56.84 76.79 83.52
Bordeaux France 1176238 21.94 41.5 53.34
Boston United States 4167892 13.4 30.69 44.69
Bremen Germany 1253514 21.64 38.37 50.62
Brisbane Australia 2307430 9.27 25.63 37.82
Brussels Belgium 2632048 34.35 43.43 46.6
Budapest Hungary 2972657 34.3 48.55 55.79
Calgary Canada 1492971 5.7 18.93 31.15
Chicago United States 9608320 5.91 13.34 18.45
Cologne Germany 1960557 30.43 55.07 68.99
Cracow Poland 1392519 22.36 34.41 41.95
Dallas United States 7294931 1.18 4.05 7.64
Denver United States 2738183 3.03 9.53 17.91
Detroit United States 4263202 0.1 0.18 0.31
Dresden Germany 1317454 35.47 56.14 66.95
Dublin Ireland 1866112 15.96 35.23 50.17
Dusseldorf Germany 1541332 33.01 55.86 69.01
Edmonton Canada 1324949 3.6 10.8 17.26
Florence Italy 770710 15.22 25.25 31.03
Frankfurt am Main Germany 2579579 28.35 56.11 72.33
Geneva Switzerland 592893 50.44 74.68 85.07
Genoa Italy 699462 11.3 26.02 36.9
Hamburg Germany 3191585 16.6 39.5 55.71
Hanover Germany 1272611 30.89 54.79 65.58
Helsinki Finland 1451912 24.39 45.22 56.88
Houston United States 6706227 0.98 2.28 3.54
Kaunas Lithuania 380048 37.79 51.5 58.29
Lausanne Switzerland 410089 32.63 65.0 80.17
Leipzig Germany 972864 42.76 60.57 69.03
Lille France 1360801 26.07 48.25 61.46
Lisbon Portugal 2831367 18.17 41.66 55.96
London United Kingdom 11754700 43.09 72.56 85.80
Los Angeles United States 17712325 2.26 8.56 15.91
Luxembourg Luxembourg 577309 16.1 39.06 55.64
Lyon France 1963944 29.56 50.85 63.87
Madrid Spain 6615767 33.94 59.62 70.89500 m 1000 m 1500 m
City Country Population
PNT (%) PNT (%) PNT (%)
Manchester United Kingdom 3298781 16.34 43.57 64.61
Marseille France 1779703 17.58 31.23 42.23
Melbourne Australia 4466894 23.27 40.75 54.65
Mexico City Mexico 20578866 8.8 20.6 28.89
Miami United States 5964846 1.26 3.51 5.65
Milan Italy 4966888 28.26 48.99 63.0
Montreal Canada 4478991 10.88 25.82 37.75
Munich Germany 2825789 36.74 62.44 75.31
Nancy France 477056 16.42 36.16 52.43
Nantes France 908423 21.41 40.08 50.82
New York United States 19694439 27.02 45.35 56.68
Nice France 848591 20.2 39.87 53.29
Oslo Norway 1332133 30.16 47.59 53.67
Ottawa Canada 1500455 2.18 7.46 12.03
Paris France 12012223 37.16 62.7 77.56
Perth Australia 1930198 4.88 15.66 27.01
Philadelphia United States 6432106 4.55 14.34 23.81
Portland United States 2262652 6.64 15.61 24.75
Prague Czech Republic 2251032 35.21 59.46 73.52
Rennes France 720142 10.18 23.61 35.69
Rome Italy 4161006 25.93 46.97 58.33
Rotterdam Netherlands 1823101 20.8 41.13 56.04
San Francisco United States 6273368 10.92 25.15 37.74
Santiago Chile 7182609 13.0 34.01 49.49
Seattle United States 3620117 2.83 6.45 10.12
Stockholm Sweden 2221640 34.96 60.65 72.73
Strasbourg France 779704 27.56 51.27 63.81
Stuttgart Germany 2662983 27.57 51.06 64.64
Sydney Australia 4903571 13.91 34.98 50.88
Thessaloniki Greece 1076231 1.38 5.62 11.54
Toronto Canada 7123826 13.21 23.06 33.72
Toulouse France 1330243 14.27 30.02 42.65
Turin Italy 1741546 38.38 52.55 61.3
Utrecht Netherlands 882821 16.21 38.68 54.86
Valencia Spain 1686890 31.04 56.66 71.73
Vancouver Canada 2539976 8.52 22.55 34.37
Venice Italy 557955 13.98 22.21 27.76
Vienna Austria 2779253 44.63 68.02 78.94
Vilnius Lithuania 691221 28.55 38.33 43.84
Warsaw Poland 3099687 26.7 42.78 50.95
Washington United States 8899517 3.12 8.42 12.89
Winnipeg Canada 846133 0.0 0.0 0.0
Zurich Switzerland 1329898 42.7 68.18 82.09
Online-only Table 3: Population Near Transit values: Share of population living
within catchment area from a MRT station at thresholds 500 m, 1 000 m and
1 500 m for 85 OECD Functional Urban Areas.Our
PNT
PNT Our
Share
Types Share PNT Comments
City Country Population in 27 (%)
in 27 (%) Share about 27
with 27
in 27 (%)
crite-
ria
Urban core and
not FUA;
Metro +
Barcelona Spain 3200000 76 65 74 suburban trains
LRT
are de facto
included in 27
Metro + Excludes
Boston US 4650000 15 31 17
LRT suburban trains
Chicago US 9500000 Metro 14 13 13 /
Metro +
Some suburban
LRT +
London UK 10000000 61 73 / trains are
Suburban
excluded in 27
Rail
Metro +
We exclude Bus
Los Angeles US 13000000 LRT + 11 9 /
Rapid Transit
BRT
Urban core and
not FUA;
Metro +
Madrid Spain 5500000 76 60 72 suburban trains
LRT
are de facto
included in 27
Metro + Excludes
New York US 19800000 35 45 34
LRT suburban trains
Metro +
Some tramlines
Tram +
Paris France 12000000 50 63 / are excluded
Suburban
in 27
Rail
Urban core and
not FUA;
Metro +
Rotterdam Netherlands 1200000 55 41 50 suburban trains
LRT
are de facto
included in 27
Vancouver Canada 2300000 Metro 19 23 23 /
Urban core and
Washington US 5800000 Metro 12 8 12
not FUA
Table 4: Comparison of MRT Share from the IDTP report 27 with our estima-
tions for 11 OECD cities. Discrepancies at first glance can be explained by
different delineations of cities or transit systems. Applied on the same entities,
results are similar.You can also read