Continent-Wide Analysis of COVID 19: Total Cases, Deaths, Tests, Socio-Economic, and Morbidity Factors Associated to the Mortality Rate, and ...
←
→
Page content transcription
If your browser does not render page correctly, please read the page content below
International Journal of
               Environmental Research
               and Public Health

Article
Continent-Wide Analysis of COVID 19: Total Cases, Deaths,
Tests, Socio-Economic, and Morbidity Factors Associated to the
Mortality Rate, and Forecasting Analysis in 2020–2021
Muhammad Nauman Zahid † and Simone Perna *,†

                                          Department of Biology, College of Science, University of Bahrain, Sakhir 32038, Bahrain; nzahid@uob.edu.bh
                                          * Correspondence: simoneperna@hotmail.it
                                          † The two authors contributed equally to this work.

                                          Abstract: Background: The severe acute respiratory syndrome coronavirus 2 (SARS-CoV-2) was
                                          first reported in China in December 2019 and has become a pandemic that resulted in more than
                                          one million deaths and infected over 35 million people worldwide. In this study, a continent-wide
                                          analysis of COVID-19 cases from 31st December 2019 to 14th June 2020 was performed along with
                                          socio-economic factors associated with mortality rates as well as a predicted future scenario of
                                          COVID-19 cases until the end of 2020. Methods: Epidemiological and statistical tools such as linear
                                          regression, Pearson’s correlation analysis, and the Auto Regressive Integrated Moving Average
                                          (ARIMA) model were used in this study. Results: This study shows that the highest number of cases
                                          per million population was recorded in Europe, while the trend of new cases is lowest in Africa. The
                                          mortality rates in different continents were as follows: North America 4.57%, Europe 3.74%, South
                                          America 3.87%, Africa 3.49%, Oceania and Asia less than 2%. Linear regression analysis showed that

                                   hospital beds, GDP, diabetes, and higher average age were the significant risk factors for mortality in
Citation: Zahid, M.N.; Perna, S.          different continents. The forecasting analysis since the first case of COVID-19 until 1st January 2021
Continent-Wide Analysis of COVID          showed that the worst scenario at the end of 2020 predicts a range from 0 to 300,000 daily new cases
19: Total Cases, Deaths, Tests,           and a range from 0 to 16,000 daily new deaths. Conclusion: Epidemiological and clinical features of
Socio-Economic, and Morbidity             COVID-19 should be better defined, since they can play an import role in future strategies to control
Factors Associated to the Mortality       this pandemic.
Rate, and Forecasting Analysis in
2020–2021. Int. J. Environ. Res. Public   Keywords: COVID-19; continents; epidemiology; infection; deaths; risk factors
Health 2021, 18, 5350. https://
doi.org/10.3390/ijerph18105350

Received: 16 September 2020
                                          1. Introduction
Accepted: 15 October 2020
Published: 18 May 2021
                                               Coronavirus disease 2019 (COVID-19) is an ongoing pandemic that resulted in global
                                          health, economic, and social crises [1]. It has created the worst health challenges since the
Publisher’s Note: MDPI stays neutral
                                          Spanish flu in 1918 and the largest worldwide recession since the Great Depression [2].
with regard to jurisdictional claims in
                                          This pandemic has led to the abandonment of all religious, political, sporting, cultural, and
published maps and institutional affil-   educational activities worldwide [3]. According to a report, 98.6% of students are affected
iations.                                  globally due to the closure of schools, colleges, and universities [4]. According to the World
                                          Health Organization (WHO), this disease has already killed 1,042,344 people and affected
                                          35,437,479 people worldwide by 29th September 2020 [5].
                                               The World Health Organization (WHO) was informed on 31 December 2019 by China
Copyright: © 2021 by the authors.
                                          about many cases of pneumonia in Wuhan, China [6]. Initial cases of such pneumonia
Licensee MDPI, Basel, Switzerland.
                                          patients were reported on 8th December 2019 in Wuhan, China, and most of them were
This article is an open access article
                                          linked to the local Huanan South China seafood market of wild animals [7]. The cause of
distributed under the terms and           that pneumonia was identified on 7th January 2020 as a novel coronavirus (2019-nCoV),
conditions of the Creative Commons        which was renamed as severe acute respiratory syndrome coronavirus 2 (SARS-CoV-2) and
Attribution (CC BY) license (https://     the disease was termed as coronavirus disease 2019 (COVID-19) by the WHO [5].
creativecommons.org/licenses/by/               The sudden intrusion of COVID-19 in our life has shifted the focus of the world
4.0/).                                    community, especially scientists, toward this virus. Despite rigorous efforts in microbiology,

Int. J. Environ. Res. Public Health 2021, 18, 5350. https://doi.org/10.3390/ijerph18105350                    https://www.mdpi.com/journal/ijerph
Int. J. Environ. Res. Public Health 2021, 18, 5350                                                                            2 of 10

                                        medicine, and pathology, many questions are still unanswered. With the help of a precise
                                        prediction of the further course of development, important countermeasures can be taken in
                                        risk management and communication [8]. In this study, epidemiological and statistical tools
                                        were being used to elaborate the current situation of COVID-19 patients and death rates in
                                        the different continents as well as forecasting analysis of COVID-19 cases enabling further
                                        understanding of the gravity of this pandemic. This work contributes to the academic
                                        world in two ways. First, a novel analysis of the new cases and deaths rate in different
                                        continents has been developed. Second, a forecasting analysis is applied to predict the new
                                        cases and the trend from 14th June 2020 to 1st January 2021.

                                        2. Materials and Methods
                                             The data were obtained from the European Centre for Disease Prevention and Control
                                        https://data.europa.eu/euodp/en/data/dataset/covid-19-coronavirus-data (accessed on
                                        14 October 2020) and https://www.who.int/healthinfo/statistics/data/en/ (accessed on
                                        14 October 2020). The time-series analysis in this study was based on the daily number
                                        of laboratory-confirmed cases reported from 31st December 2019 to the 14th of June 2020.
                                        The selected outcomes were the number of new and cumulative daily cases, deaths, rate
                                        of deaths, and number of population continent-wide. This study collected the following
                                        outcomes:
                                             Total number of cases and deaths worldwide
                                        •      Diabetes Prevalence
                                        •      Stringency Index
                                        •      Median Age
                                        •      Handwashing Facilities
                                        •      GDP Per Capita
                                        •      Female Smokers
                                        •      Extreme Poverty
                                        •      Male Smokers
                                        •      Cardiovascular Diseases Death Rate
                                        •      Hospital Beds

                                        Statistical Analysis
                                              The statistical analysis and reporting of this study were conducted in accordance
                                        with the consolidated standards of reporting epidemiological studies guidelines [9]. De-
                                        scriptive statistics reporting the daily number of new cases, daily deaths, and daily tests
                                        were performed and displayed in figures with line charts. Confounding variables were
                                        test “a priori” with Spearman correlation analysis. The primary risk factors associated
                                        with mortality rate in percentage were calculated with meta-regression stepwise analysis
                                        after testing for the linear and additivity of predictive relationships for independence
                                        (lack of correlation) of errors, testing for homoscedasticity (constant variance) of errors,
                                        and testing for normality of the error distribution. For the baseline variables, summary
                                        statistics employed frequencies and proportions for categorical data as well as mean for
                                        continuous variables represented in a graph. In this study, the Auto Regressive Integrated
                                        Moving Average (ARIMA) model, an advanced time series forecasting technique, was
                                        employed [10]. The data from all the countries were analyzed in the following manner:
                                        (a)    Inspection for stationarity using sequence charts and correlograms
                                        (b)    Differencing to transform non-stationary data to stationary
                                        (c)    Creation of ARIMA models based on the autocorrelation function (ACF) and partial
                                               autocorrelation functions (PACF)
                                        (d)    Determination of ARIMA (p,d,q) model fit
                                        (e)    Forecasting the time series for next few months i.e., until 31st December 2020
                                            For the data analysis, an IBM SPSS Version 25.0 software (IBM SPSS statistics for
                                        windows version 20, Armonk, NY, USA) was used [11].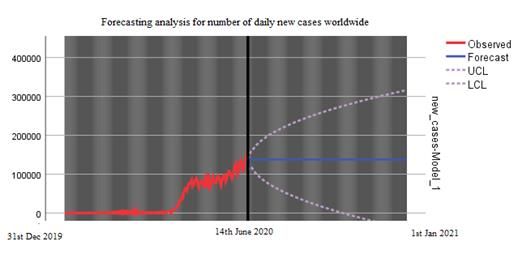
Int. J. Environ. Res. Public Health 2020, 17, x
For the data analysis, an IBM SPSS Version 25.0 software (IBM SPSS statistics for win
version 20, Armonk, NY, USA) was used [11].
Int. J. Environ. Res. Public Health 2021, 18, 5350 3 of 10
Statement for Ethical Approval: As this study is based on database and it did not involve h
or animal experiments, therefore, ethical approval was not required for this study.
Statement for Ethical Approval: As this study is based on database and it did not involve
3. Resultshuman or animal experiments, therefore, ethical approval was not required for this study.
From3. 31st December 2019 to 14th June 2020, the outbreak of coronavirus disease 2019 (CO
Results
19) caused 7,984,067
From 31stconfirmed
Decembercases 2019 toand 435,181
14th deaths
June 2020, the in the world.
outbreak After standardizing
of coronavirus disease th
of COVID-19 positive cases
2019 (COVID-19) caused per millionconfirmed
7,984,067 population,
cases the
and highest number
435,181 deaths ofworld.
in the cases After
were record
standardizing
Europe, while the one
the lowest data was
of COVID-19
recordedpositive cases (Figure
in Oceania per million population,
1). The cases inthe highest
South America s
number of cases were recorded in Europe, while the lowest one was recorded in Oceania
to rise in the beginning of May 2020 and as shown in Figure 1, it is still rising steeply. North Am
(Figure 1). The cases in South America started to rise in the beginning of May 2020 and as
also showedshown a in
trend of1,escalation
Figure in steeply.
it is still rising the number of casesalso
North America in showed
the first weekof of
a trend May 2020. In
escalation
continents, cases
in the are of
number gradually
cases in theincreasing
first week ofas well
May but
2020. In at a slower
other rate
continents, than
cases areneighboring
gradually cou
(Figure 1).increasing as well but at a slower rate than neighboring countries (Figure 1).
Figure 1. Trend of cumulative new cases standardized for population (per million) by continent.
Figure 1. Trend of cumulativethe
After standardizing new cases
data standardized
of deaths for population
per million population,(per
the million) by continent.
highest number
of deaths were recorded in Europe followed by North America. The number of deaths
Afterinstandardizing
other continentsthe
is also increasing
data gradually
of deaths from mid-May
per million 2020, especially
population, the highestin South
number of
America (Figure 2).
were recorded in Europe followed by North America. The number of deaths in other contin
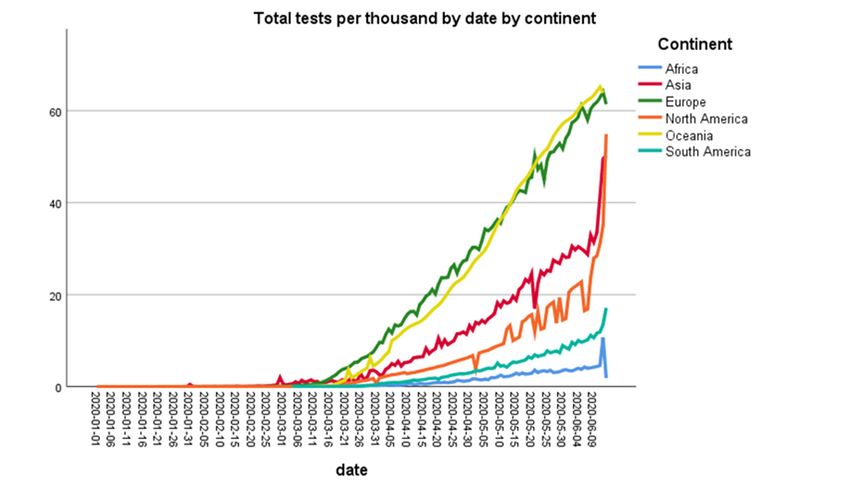
Figure 3 shows the number of tests performed by continents per thousand population.
also increasing
Oceaniagradually fromcountries
and European mid-May 2020, especially
performed in South
the highest numberAmerica (Figure
of tests per 2).
thousand
population followed by Asia and North America.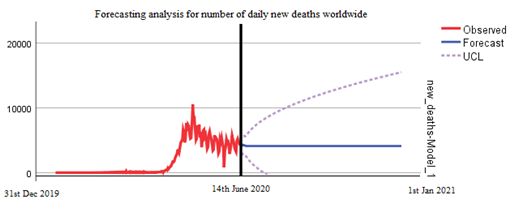
Int. J. Environ. Res. Public Health 2020, 17, x                                                               4 of 11
Int. J. Environ. Res. Public Health 2021, 18, 5350                                                                                     4 of 10

                         Int. J. Environ. Res. Public Health 2020, 17, x

                                       Figure 2. Trend of cumulative new deaths standardized for population (per million) by continent.

                                     Figure 3 shows the number of tests performed by continents per thousand population. Oceania
                                and European countries performed the highest number of tests per thousand population followed by
                                      Figure
                                Asia and     2. Trend
                                         North        of cumulative new deaths standardized for population (per million) by continent.
                                                 America.
                                 Figure 2. Trend of cumulative new deaths standardized for population (per million) by continent.

                              Figure 3 shows the number of tests performed by continents per thousand population. O
                         and European countries performed the highest number of tests per thousand population follow
                         Asia and North America.

                                        Figure 3. Number of cumulative coronavirus disease 2019 (COVID-19) tests (per thousand) by continent.
                                       Figure 3. Number of cumulative coronavirus disease 2019 (COVID-19) tests (per thousand) by
                                              Table 1 shows the risk factors associated to high mortality rate in African countries.
                                       continent.
                                     Male smokers and high CVD death rate were the main risk factors associated to the
                                     mortality
                                   Table       rate. the risk factors associated to high mortality rate in African countries. Male
                                          1 shows
                                smokers and high CVD death rate were the main risk factors associated to the mortality rate.

                                 Figure 3. Number of cumulative coronavirus disease 2019 (COVID-19) tests (per thousand) b
                                 continent.

                            Table 1 shows the risk factors associated to high mortality rate in African countries.
                         smokers and high CVD death rate were the main risk factors associated to the mortality rate.
Int. J. Environ. Res. Public Health 2021, 18, 5350 5 of 10
Table 1. Socio-economic risk factors associated to mortality rate.
CL 95% CL 95%
Model a Africa B Std. Error Beta t p Value
Lower Bound Upper Bound
Stringency index 0.055 0.006 0.577 9.941 0.0001 0.044 0.066
Female smokers −0.684 0.060 −0.289 −11.351 0.001 −0.802 −0.565
Hospital beds per thousand 2.188 0.295 0.435 7.426 0.001 1.610 2.765
Diabetes prevalence −0.453 0.044 −0.429 −10.397 0.001 −0.538 −0.367
CVD * death rate 0.016 0.002 0.690 9.347 0.00001 0.013 0.020
Median age −0.184 0.031 −0.581 −5.954 0.001 −0.245 −0.124
Male smokers 0.039 0.014 0.173 2.722 0.0001 0.011 0.067
CL 95% CL 95%
Model b Asia B Std. Error Beta t p Value
Lower Bound Upper Bound
CVD death rate 0.018 0.001 1.328 16.435 0.0001 0.015 0.020
Hospital beds per thousand −1.116 0.062 −0.819 −17.941 0.0001 −1.239 −0.994
GDP per capita 0.000 0.000 0.324 5.768 0.0001 0.000 0.000
Diabetes prevalence −0.612 0.070 −0.972 −8.748 0.0001 −0.750 −0.475
Female smokers −0.262 0.042 −0.301 −6.178 0.0001 −0.345 −0.179
Extreme poverty 0.067 0.015 0.206 4.535 0.0001 0.038 0.097
CL 95% CL 95%
Model c Europe B Std. Error Beta t p Value
Lower Bound Upper Bound
Diabetes prevalence 0.399 0.014 0.898 28.043 0.0001 0.371 0.427
CL 95% CL 95%
Model d North America B Std. Error Beta t p Value
Lower Bound Upper Bound
Diabetes prevalence 1.804 0.081 3.423 22.330 0.0001 1.645 1.962
Handwashing facilities −0.185 0.009 −2.742 −21.349 0.0001 −0.202 −0.168
Stringency index 0.085 0.005 1.371 15.429 0.0001 0.074 0.095
CVD death rate −0.022 0.001 −1.100 −15.092 0.0001 −0.025 −0.019
GDP per capita 0.000 0.000 −0.387 −5.409 0.0001 0.000 0.000
CL 95% CL 95%
Model e South America B Std. Error Beta t p Value
Lower Bound Upper Bound
Stringency index 0.057 0.005 1.152 11.344 0.001 0.047 0.067
Female smokers −0.840 0.080 −0.812 −10.561 0.001 −0.997 −0.684
Median age 0.071 0.017 0.483 4.087 0.0001 0.037 0.105
a continent = Africa, * CVD = cardiovascular disease; b continent = Asia. Table 1 shows that in Asian countries, high mortality rate is
associated with hospital beds per thousand population, diabetes prevalence, and female smokers; c continent = Europe. In European
countries, the diabetes prevalence appears to be the only risk factor associated with high mortality rate (B = 0.014; p > 0.0001); d continent =
North America. Table 1 explains that in North America, handwashing facilities and CVD death rates are linked with high mortality rate;
e continent = South America. In South American countries, the age of the population appears to be the main risk factor associated to the
high mortality rate (B = 0.014; p > 0.0001).
As shown in Table 2, the main risk factors associated to the mortality are the median
age of the population, the smoke consumption (opposite for gender), handwashing facilities,
population density and stringency index.
Table 2. Overall risk factors associated to mortality rate worldwide.
Predictor Estimate SE t p Stand. Estimate Lower Upper
stringency_index 0.09904 0.008 12.38499 0.0001 0.17574 0.1479 0.2036
population_density −0.00507 0.00158 −3.20247 0.0001 −0.05527 −0.0891 −0.0214
gdp_per_capita −6.00 × 10⁻⁵ 7.4 −0.811 0.4174089 −0.01928 −0.0659 0.0273
median_age 0.30829 0.08542 3.60924 0.0001 0.11611 0.053 0.1792
extreme_poverty −0.02046 0.02429 −0.8424 0.3996054 −0.02352 −0.0783 0.0312
cvd_death_rate −6.05 × 10⁻⁴ 0.00316 −0.19119 0.8483846 −0.00366 −0.0412 0.0339
diabetes_prevalence 0.00106 0.10746 0.00989 0.9921134 2.07 × 10⁻⁴ −0.0408 0.0413
female_smokers 0.29986 0.05808 5.16296 0.0001 0.08176 0.0507 0.1128
male_smokers −0.16995 0.01838 −9.24648 0.0001 −0.16645 −0.2017 −0.1312
handwashing_ 0.07807 0.02128 3.66916 0.0001 0.13767 0.0641 0.2112gdp_per_capita −6.00e−5 7.4 −0.811 0.4174089 −0.01928 −0.0659 0.0273
median_age 0.30829 0.08542 3.60924 0.0001 0.11611 0.053 0.1792
extreme_poverty −0.02046 0.02429 −0.8424 0.3996054 −0.02352 −0.0783 0.0312
cvd_death_rate −6.05e−4 0.00316 −0.19119 0.8483846 −0.00366 −0.0412 0.0339
diabetes_prevalence 0.00106 0.10746 0.00989 0.9921134 2.07E−04 −0.0408 0.0413
Int. J. Environ. Res. Public Health 2021, 18, 5350
female_smokers 0.29986 0.05808 5.16296 0.0001 0.08176 0.0507 0.1128 6 of 10
male_smokers −0.16995 0.01838 −9.24648 0.0001 −0.16645 −0.2017 −0.1312
handwashing_ 0.07807 0.02128 3.66916 0.0001 0.13767 0.0641 0.2112
Figure Figure 4 showed
4 showed the mortality
the mortality rate percentage
rate percentage (cumulative
(cumulative cases/cumulative
cases/cumulative deaths) deaths)
by
by continents.
continents. The
The mortality mortality
rate rate by
by continents wascontinents
as follows:was
NorthasAmerica
follows:4.57%,
NorthEurope
America 4.57%,
3.74%,
South Europe
America3.74%,
3.87%, Africa
South 3.49%,
Americaand3.87%,
Oceania and Asia,
Africa lower
3.49%, andthan 2%. and Asia, lower than 2%.
Oceania
Figure 4. Mortality rate in percentage by continent.
Figure 4. Mortality rate in percentage by continent.
Figure 5a,b describes the forecasting analysis since the first case of COVID-19 word-
Figure 5a,b describes the forecasting analysis since the first case of COVID-19 wordwide. The
wide. The data is predicted from 14th June 2020 to 1st January 2021. The worst scenario
data is predicted from 14th June 2020 to 1st January 2021. The worst scenario for the end of 2020 with
for the end of 2020 with the forecasting analysis predicts a range from 0 to 300,000 daily
the forecasting analysis predicts a range from 0 to 300,000 daily cases and a range from 0 to 16,000
cases and a range from 0 to 16,000 daily deaths (Figure 5); since the data pattern did not
daily deaths (Figure 5); since the data pattern did not demonstrate stationarity with first-order
demonstrate stationarity with first-order differencing, second-order differencing was done
differencing, second-order differencing was done to achieve stationarity.
to achieve stationarity.
Int. J. Environ. Res. Public Health 2020, 17, x 7 of 11
(a)
(b)
Figure 5. (a) ForecastingFigure 5. (a) Forecasting analysis for number of new daily deaths worldwide until 1st January 2021.
analysis for number of new daily deaths worldwide until 1st January 2021. (b) Forecasting analysis
(b) Forecasting analysis for number of new daily cases worldwide until 1st January 2021.
for number of new daily cases worldwide until 1st January 2021.
4. Discussion
By using epidemiological and statistical tools, we described the current situation of COVID-19
positive cases and deaths in different continents as well as the main risk factors associated with
mortality rate and worldwide forecasting analysis that predicted the scenario of the COVID-19
pandemic until the end of 2020. This study showed that mortality rate is associated with differentInt. J. Environ. Res. Public Health 2021, 18, 5350 7 of 10
4. Discussion
By using epidemiological and statistical tools, we described the current situation
of COVID-19 positive cases and deaths in different continents as well as the main risk
factors associated with mortality rate and worldwide forecasting analysis that predicted
the scenario of the COVID-19 pandemic until the end of 2020. This study showed that
mortality rate is associated with different factors in different countries including smoking,
cardiovascular diseases (CVD), diabetes, hand washing, and number of beds in hospitals
per thousand population. Secondly, this epidemiological study sheds light that after
standardizing the data of cases per million population, the highest number of cases were
recorded in Europe, while the trend of new cases is lowest in Africa.
These data indicate that COVID-19 has severely affected Europe, as there is a huge
gap in the number of COVID-19 positive cases per million population in Europe and the
rest of the continent, but it seems that the steepness of the curve has decreased now. In
contrast to Europe, the number of positive cases is increasing in Asia and South America.
Although the number of cases in China has reduced, other countries of Asia such India
and Pakistan have been under severe threat of COVID-19 from the beginning of June
2020. As these countries are highly populated, Asia could become the next hotspot of
COVID-19. Interestingly, Oceania and Africa showed very low number of cases per million
population. One reason for the low number of cases in Africa seems to be a smaller number
of testing in this continent, whereas Oceania conducted the highest number of tests per
thousand inhabitants. It is important to find out the reasons for this low number of tests
in most countries. The standard diagnostic test for COVID-19 diagnosis is RNA-RT-PCR
assay, which has been recommended by the WHO on nasopharyngeal swabs [12]. This
test is very expensive and governments of many poor countries, such as in Africa, cannot
afford to provide it for free for all citizens. The serological tests are relatively cheap and
quick, but broad use of these tests for diagnostic purpose is still controversial. To test the
efficacy of these serological tests, Lahner et al. have performed IgM/IgG antibody-based
serology tests in 1084 samples from heath workers. They found a 98.99% specificity of IgM
serology, while IgM showed 99.1% specificity. This study described that the performance
of IgG serology tests was better two weeks after the infection of COVID-19 detected by
RNA-RT-PCR [12]
The reason for these differences in cases among different continents will be very crucial
to understand, as that might help control the spread of this pandemic. The COVID-19
pandemic has affected almost all countries of the world, but surprisingly, the intensity of
disease is not the same everywhere. According to the WHO data, the number of cases per
million population in the USA, Italy, and the UK are 5268, 3847, and 3996, respectively [5].
Among South American countries, COVID-19 is spreading quickly in Brazil, as the number
of cases per million population there is 2345. Interestingly, China, from where this pandemic
started, is in recovery phase, so its number of cases per million population is 57 [5].
Astonishingly, there is a huge difference in the number of deaths among different
countries as well as different continents [5]. The data of deaths per million population
showed that the highest number of deaths were recorded in Europe followed by North
America and South America. For example, the number of deaths per million population
in Italy and the UK are 551 and 562, respectively, while in the USA, it is 310 [5]. Similarly,
Brazil also showed the high number of deaths, i.e., 133 while in China, there are 3.2 deaths
per million population [5]. Surprisingly, Africa, where the health system is weak compared
to Europe and America, observed a very low number of deaths during the above-mentioned
study period. It will be important to identify the reason(s) for this low number of deaths
in Africa, as it may be the critical factor to control the disastrous effects of this pandemic.
The exact reason for this difference in death rates is also still unknown, as this virus
is only 5 months old, and many aspects of the viral genome and pathogenesis are still
under study. However, mutations in the viral genome could be one of the reasons of the
variability in the severity of this virus. Dr. Rodney P. Jones described different factors
involving high mortality due to COVID-19 in the USA and the UK. He linked high mortalityInt. J. Environ. Res. Public Health 2021, 18, 5350 8 of 10
with population density, as it results in household crowding and poor hygiene. Another
important factor is the capacity pressure on hospitals due to which patients could not find
beds, and it was hard to take care of such patients. Dr. Rodney further explained that
the cognitive dissonance and high granularity of COVID-19 also increased mortality [13].
Interestingly, it has been reported that COVID-19 spread and air pollution have a positive
correlation. As it is known that COVID-19 can be transmitted through air; therefore,
atmospheric particulate matter (PM) can transport the SARS-CoV-2 greater distances than
those believed for only close contacts. This PM is also responsible for inflammation in lung
cells, so people in more polluted areas have more probability of getting severe symptoms
of COVID-19, leading to more mortality [14].
We have also described the mortality rate in different continents. It was observed that
South America had the highest mortality rate followed by Europe and North America.
The mortality rate in some countries is very high such as in Italy and the UK, where the
mortality rate is 14% and 14.6%, respectively. The USA has a 6% mortality rate and Brazil
shows a 6.5% mortality rate, while China has only a 3.2% mortality rate [5]. This is also
surprising because the health system in most of the countries of these continents is far better
than the health system of Africa and Asia, but still, the mortality rate in these continents,
especially in Asia, is very low. Interestingly, it was speculated initially that hot weather
may be a reason for less mortality in Asia and Africa, but the current situation in Asia has
also nullified this theory, because the cases and death rates are increasing here in June,
which is one of the hottest months in this region [15,16]. Moreover, Oceania showed the
lowest mortality rate, and even New Zealand has claimed to be free of COVID-19 cases,
although the weather is cold there in June. It shows that weather does not play a vital
role in the COVID-19 pandemic. All these findings are speculations until we get more
information about the viral genome throughout the world.
Regarding the risk factors associated to mortality, the strongest one was the number
of hospital beds, which showed a high relevance and impact on mortality. The number
of beds and the healthcare facilities had an important impact during this emergency,
specifically in Europe, where many elderly people were admitted to the unit of intensive
care. Surprisingly, the number of handwash facilities and the average age does not affect
the rate mortality in many continents. It is important to discuss the impact of COVID-19
on rural areas, as those areas have badly suffered from previous pandemics such as H1N1.
The lack of facilities such as advanced intensive care units (ICUs) and ventilators have
raised the mortality rate in rural areas. Rural areas also have the issue of professional
resources as they have a low number of healthcare workers, not enough big hospitals, a
low number of physicians, and the older population is high in rural areas as compared to
urban areas. All these factors have raised concern that COVID-19 can have a severe impact
in rural areas of different countries [17].
Everyone around the world wants to know the end date of this pandemic, as it is
required for future planning in all aspects of life. The evolution of virus is not totally
haphazard, as we know this from previous pandemics. It follows a pattern from outbreak
to the acceleration phase, plateau, and then decline phase, which is finally followed by
the end of the pandemic. Using forecasting analysis, we have predicted the outcomes of
the COVID-19 pandemic worldwide in both the best and worst scenarios. According to
this model, if strict measures are continuously adapted, the trend will not surpass 100,000
daily new cases worldwide and no more than 5000 daily deaths. We predicted that in
the worst scenario, there could be 300,000 cases per day at the end of this year while
16,000 deaths could be recorded. This tells us the seriousness of this pandemic, and all
countries should implement strict measures to stop the spread of this disease. Although
the situation in some countries is improving, the WHO warned about the second wave
of the COVID-19 pandemic that could be more devastating [5]. Different groups have
also performed forecast analysis on COVID-19, and the important aspect in all is that all
such predictions depend on an accurate count of symptomatic and asymptomatic cases as
well as the exact number of deaths caused by COVID-19. Moreover, these predictions alsoInt. J. Environ. Res. Public Health 2021, 18, 5350 9 of 10
depend on the strict measurements taken by all countries, human behavior, and testing
protocol; otherwise, with a change in the number of cases, there will be change in the
predictions about the end of this pandemic [18–21]. For example, Jianxi Luo performed
a data-driven prediction of next developments and end dates of COVID-19 in different
countries. His analysis predicted the COVID-19 scenario in Brazil and USA, and it showed
two different conditions i.e., a stable prediction in the USA, while in Brazil, the situation is
highly volatile and needs more cautious actions [21]). In contrast, strict restrictions applied
by the government of Singapore may bend the curve earlier than predicted [21]. Therefore,
the forecasting analysis should be considered together with the situations in each country.
Several studies with different predictive models showed a similar prediction [22]. In
particular, the US national ensemble forecast indicates an uncertain trend in new COVID-
19 cases reported over the next four weeks (October–November 2020) and predicts that
160,000 to 360,000 new cases will likely be reported (https://www.cdc.gov/coronavirus/
2019-ncov/cases-updates/forecasts-cases.html, accessed on 14 October 2020).
Finally, a recent study that took in account five of the models—IHME, YYG, Delphi,
SIKJalpha and LANL—had less than 20% MAPE at six weeks. Despite the complexities of
modeling human behavioral responses and government interventions related to COVID-19,
predictions among these better-performing models were surprisingly accurate. Forecasts
and alternative scenarios can be a useful input to decision-makers, although users should be
aware of increasing errors with a greater amount of extrapolation time and corresponding
steadily widening uncertainty intervals further in the future [23].
5. Conclusions
The situation of COVID-19 is changing every day in all continents. We have reported
in this study that the number of cases as well as death rates is increasing gradually with
time in most of the continents, while in some continents such as Asia, the number of
COVID-19 positive cases rose up steeply in May 2020. Similarly, the death rates in these
continents also jumped high in May 2020. The exact reasons behind the difference in the
number of cases and casualties in different countries of the world is still unknown, since the
factors that we investigated gave contradictory information. Further studies are required
to understand COVID-19 for its characterization and development of a vaccine against
this pandemic.
Author Contributions: Conceptualization, S.P. and M.N.Z.; methodology, S.P.; formal analysis, S.P.;
investigation, M.N.Z.; resources, S.P.; data curation, S.P.; writing—original draft preparation, S.P. and
M.N.Z.; writing—review and editing, S.P.; visualization, M.N.Z.; supervision, S.P. All authors have
read and agreed to the published version of the manuscript.
Funding: This research received no external funding.
Acknowledgments: We are extremely grateful to Mohammad El-Hilo, Dean of College of Science of
Univesity of Bahrain, for his support and final draft.
Conflicts of Interest: The authors declare no conflict of interest.
References
1. Lu, H.; Stratton, C.W.; Tang, Y.W. Outbreak of pneumonia of unknown etiology in Wuhan, China: The mystery and the miracle. J.
Med. Virol. 2020, 92, 401–402. [CrossRef] [PubMed]
2. Taubenberger, J.K.; Morens, D.M. 1918 Influenza: The mother of all pandemics. Emerg. Infect. Dis. 2006, 12, 15–22. [CrossRef]
[PubMed]
3. Adhikari, S.P.; Meng, S.; Wu, Y.J.; Mao, Y.P.; Ye, R.X.; Wang, Q.Z.; Sun, C.; Sylvia, S.; Rozelle, S.; Raat, H.; et al. Epidemiology,
causes, clinical manifestation and diagnosis, prevention and control of coronavirus disease (COVID-19) during the early outbreak
period: A scoping review. Infect. Dis. Poverty 2020, 9, 29. [CrossRef] [PubMed]
4. Alabdulmonem, W.; Shariq, A.; Rasheed, Z. COVID-19: A Global Public Health Disaster; College of Medicine, Qassim University:
Buraidah, Saudi Arabia, 2020; pp. 7–8.
5. World Health Organization (WHO) Coronavirus Disease (COVID-19) Pandemic. Available online: https://www.who.int/
emergencies/diseases/novel-coronavirus (accessed on 5 June 2020).Int. J. Environ. Res. Public Health 2021, 18, 5350 10 of 10
6. Hui, D.S.; Azhar, E.I.; Madani, T.A.; Ntoumi, F.; Kock, R.; Dar, O.; Ippolito, G.; Mchugh, T.D.; Memish, Z.A.; Drosten, C.; et al. The
continuing 2019-nCoV epidemic threat of novel coronaviruses to global health—The latest 2019 novel coronavirus outbreak in
Wuhan, China. Int. J. Infect. Dis. 2020, 91, 264–266. [CrossRef] [PubMed]
7. Harapan, H.; Itoh, N.; Yufika, A.; Winardi, W.; Keam, S.; Te, H.; Megawati, D.; Hayati, Z.; Wagner, A.L.; Mudatsir, M. Coronavirus
disease 2019 (COVID-19): A literature review. J. Infect. Public Health 2020, 13, 667–673. [CrossRef] [PubMed]
8. Lipsitch, M.; Swerdlow, D.L.; Finelli, L. Defining the epidemiology of Covid-19—Studies needed. N. Engl. J. Med. 2020, 382,
1194–1196. [CrossRef] [PubMed]
9. Rose, S. International Ethical Guidelines for Epidemiological Studies: By the Council for International Organizations of Medical Sciences
(CIOMS); Oxford University Press for the Johns Hopkins Bloomberg School of Public Health: Baltimore, MD, USA, 2009.
10. Saboia, J.L.M. Autoregressive integrated moving average (ARIMA) models for birth forecasting. J. Am. Stat. Assoc. 1977, 72,
264–270. [CrossRef]
11. Wagner, W.E., III. Using IBM® SPSS® Statistics for Research Methods and Social Science Statistics; Sage Publications: Thousand Oaks,
CA, USA, 2019.
12. Lahner, E.; Dilaghi, E.; Prestigiacomo, C.; Alessio, G.; Marcellini, L.; Simmaco, M.; Santino, I.; Orsi, G.B.; Anibaldi, P.; Marcolongo,
A.; et al. Prevalence of Sars-Cov-2 Infection in Health Workers (HWs) and Diagnostic Test Performance: The Experience of a
Teaching Hospital in Central Italy. Int. J. Environ. Res. Public Health 2020, 17, 4417. [CrossRef] [PubMed]
13. Jones, R. How many extra deaths have really occurred in the UK due to the Covid-19 outbreak? XVIII. In Which Communities in
the UK are Susceptible to the ‘Second’ Wave; Healthcare analysis and Forecasting: Surrey, UK, 2020.
14. Comunian, S.; Dongo, D.; Milani, C.; Palestini, P. Air Pollution and Covid-19: The Role of Particulate Matter in the Spread and
Increase of Covid-19’s Morbidity and Mortality. Int. J. Environ. Res. Public Health 2020, 17, 4487. [CrossRef] [PubMed]
15. Tobías, A.; Molina, T. Is temperature reducing the transmission of COVID-19? Environ. Res. 2020, 186, 109553. [CrossRef]
[PubMed]
16. Tosepu, R.; Gunawan, J.; Effendy, D.S.; Lestari, H.; Bahar, H.; Asfian, P. Correlation between weather and Covid-19 pandemic in
Jakarta, Indonesia. Sci. Total. Environ. 2020, 725, 138436. [CrossRef] [PubMed]
17. Lakhani, H.V.; Pillai, S.S.; Zehra, M.; Sharma, I.; Sodhi, K. Systematic Review of Clinical Insights into Novel Coronavirus
(CoVID-19) Pandemic: Persisting Challenges in U.S. Rural Population. Int. J. Environ. Res. Public Health 2020, 17, 4279. [CrossRef]
[PubMed]
18. Petropoulos, F.; Makridakis, S. Forecasting the novel coronavirus COVID-19. PLoS ONE 2020, 15, e0231236. [CrossRef] [PubMed]
19. Salgotra, R.; Gandomi, M.; Gandomi, A.H. Time Series Analysis and Forecast of the COVID-19 Pandemic in India using Genetic
Programming. Chaos Solitons Fractals 2020, 138, 109945. [CrossRef] [PubMed]
20. Chintalapudi, N.; Battineni, G.; Amenta, F. COVID-19 virus outbreak forecasting of registered and recovered cases after sixty-day
lockdown in Italy: A data driven model approach. J. Microbiol. Immunol. Infect. 2020, 53, 396–403. [CrossRef] [PubMed]
21. Luo, J. Predictive Monitoring of COVID-19; SUTD Data-Driven Innovation Lab., Singapore University of Technology and Design:
Singapore, 2020.
22. Li, L.; Yang, Z.; Dang, Z.; Meng, C.; Huang, J.; Meng, H.; Wang, D.; Chen, G.; Zhang, J.; Peng, H.; et al. Propagation analysis and
prediction of the COVID-19. Infect. Dis. Model. 2020, 5, 282–292. [CrossRef] [PubMed]
23. Friedman, J.; Liu, P.; Gakidou, E.; IHME COVID-19 Model Comparison Team. Predictive performance of international COVID-19
mortality forecasting models. medRxiv 2020. [CrossRef]You can also read