Broadband performance testing in New Zealand Topic Paper - Date: 5 July 2018
←
→
Page content transcription
If your browser does not render page correctly, please read the page content below

Broadband performance
testing in New Zealand
Topic Paper

Date: 5 July 2018
2

Contents
Introduction ...............................................................................................................................3
Our broadband performance testing ...........................................................................................4
     Our broadband performance testing has developed over time ................................................... 4
     New broadband testing provider .................................................................................................. 5
     Retail telecommunications are a Commission priority ................................................................. 5
     New legislative obligations............................................................................................................ 6
Broadband performance explained .............................................................................................6
     How does broadband performance affect consumer experience? .............................................. 7
     What affects broadband performance?........................................................................................ 8
     How to measure broadband performance ................................................................................... 8
             Download and upload speed ............................................................................................................... 8
             Web browsing ...................................................................................................................................... 9
             Speed by time of day.......................................................................................................................... 10
             Latency............................................................................................................................................... 10
Improvements in performance over time .................................................................................. 12
    Retail service providers can influence broadband performance ................................................ 12
             Case study of broadband monitoring: the ‘Netflix effect’ .................................................................. 14
      Wholesale service providers also influence broadband performance ....................................... 15
             Regional differences in speed ............................................................................................................ 16
      International comparison ............................................................................................................ 20
About topic papers ................................................................................................................... 21
List of defined terms ................................................................................................................. 22

Broadband performance testing in New Zealand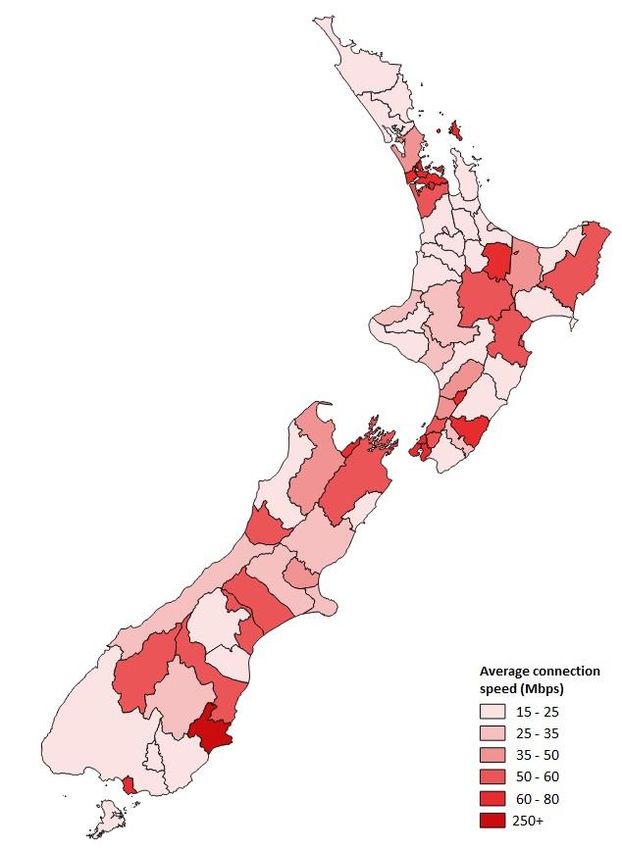
3

Introduction
Broadband is a rapidly developing telecommunications service that is becoming increasingly
important to New Zealand consumers – it has almost become a necessity. At least 82% of
New Zealand households have a broadband connection and there are more options
available to consumers than ever before.

Kiwis love being connected to the internet. The World Internet Project New Zealand 2017
found 94% of the population use the internet.1 We spend more than $1.2 billion a year on
home broadband bundles to get this connectivity. However, many consumers find
broadband baffling. Products and pricing can be complex and in-home performance can be
hard for consumers to measure.

Traditional fixed-line broadband use for households has developed from web browsing and
emailing to now commonly include activities such as streaming video, video calling and
virtual reality gaming.

Consumers now have a lot more choice with broadband bundles, retail service providers
and different service technologies. Crown Infrastructure Partners reports that there are 92
retail service providers selling fibre broadband around the country.2

Despite the availability and importance of broadband for consumers, the factors that
determine good broadband performance are not well understood. Unlike buying a tangible
product such as a fridge, it is often harder for consumers to know and compare options of
what exactly they are purchasing when they purchase a broadband connection. Differences
in broadband technology and terms such as throughput, latency, and even speed can often
be overwhelming for consumers to engage with, as well as potentially misleading.

The aim of our broadband performance testing is to provide consumers with accurate,
accessible and independent information on broadband performance across different
providers, plans, and technologies, to help them choose the best broadband for their
household. Shining a light on broadband performance also helps make broadband better
across the board, by allowing comparisons between providers and encouraging providers to
compete on performance and not just price.

On 30 May 2018 we announced a new provider for our
independent broadband performance testing – SamKnows.
SamKnows currently runs testing in over 40 countries on
behalf of telecommunications regulators and retail service
providers. Collectively their testing programmes cover
almost half of the world’s internet population. SamKnows
expect to start reporting on New Zealand broadband
performance testing from October this year.

1
    Work Research “World Internet Project New Zealand Internet in New Zealand in 2017” (2017) available at
    https://workresearch.aut.ac.nz/__data/assets/pdf_file/0009/174915/Internet-in-NZWIP-2017.pdf
2
    Crown Infrastructure Partners, available at https://www.crowninfrastructure.govt.nz/

Broadband performance testing in New Zealand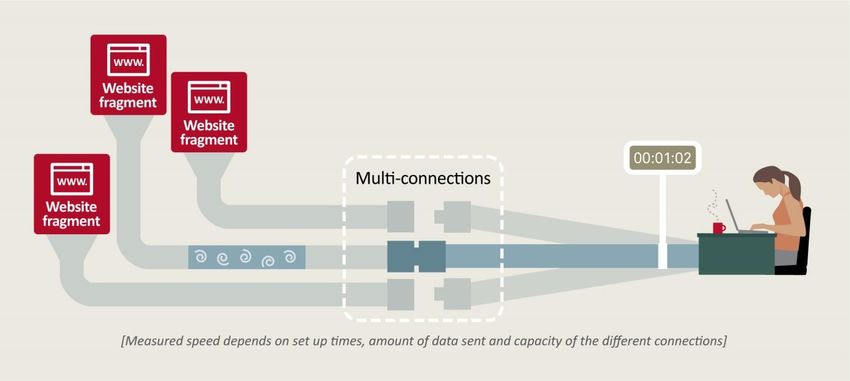
4
This topic paper describes the broadband network and explains basic broadband service
metrics and performance measures. The paper also considers the underlying technology and
how this has developed over time and improved broadband performance in New Zealand
and internationally.

Our broadband performance testing
Section 9A of the Telecommunications Act 2001 enables us to monitor and report on
telecommunications matters to help consumers understand the market and make informed
choices. As part of this monitoring, we have funded independent broadband performance
testing since 2007.
Our broadband performance testing has developed over time
The Commission started residential fixed-line broadband performance testing in 2007 when
we selected Epitiro to provide a broadband testing service. Epitiro used a rack of PCs at each
test site to run various tests on premium broadband plans. There were 11 test sites spread
across five cities. The various test results were converted into an index score to compare
retailers. The first broadband performance report was published in June 2008 and gave
results for the first quarter of 2008.

In March 2012 the Commission selected TrueNet to test broadband performance in a way
that was more oriented towards measuring the performance experienced in consumers’
homes. TrueNet used around 400 test devices deployed in the homes of volunteers to
measure broadband performance of the main retail service providers. Initially only ADSL
broadband services were tested but as new technologies became available, TrueNet started
testing VDSL, cable, fibre and fixed wireless broadband.

TrueNet produced independent monthly reports that showed a range of measures including
how much broadband performance declined in the ‘peak hour’ time of day when the
network was most congested, this was usually around 8 to 9pm.

Monthly reporting was chosen so that consumers would always have relatively up-to-date
test results on retail service providers’ performance available. Retail service providers would
also be able to quickly see the effect of any changes they made to their networks to improve
broadband performance. A result that reflected poorly on a retail service provider’s offering
could be remedied relatively quickly, and the improved performance could show up in a
report within two months. This short feedback cycle provided an incentive for retail service
providers to improve any poor performance promptly to avoid repeated publication of
results below what was expected.

TrueNet’s monthly reports continued until its contract with the Commission finished in
January 2018. We provide more detail in this topic paper of some of the retail service
providers’ performance improvements over time.

Broadband performance testing in New Zealand
5

New broadband testing provider
As telecommunications services change, and with more options available to consumers than
ever before, we consider that broadband testing remains a crucial component of our market
monitoring. Our monitoring and testing helps ensure that consumers have adequate
information to make good choices in telecommunications markets.

We have commissioned an enhanced broadband testing programme to monitor the
broadband performance of up to 3,000 households. The programme is being delivered by
SamKnows, a world leader in internet performance measurement covering almost half of
the world’s internet population. SamKnows was founded in 2003 and is based in London. It
works with regulators from the UK, US, Europe, Singapore, Brazil and Canada to measure
internet performance across the whole of Europe, North and South America, parts of Asia,
and Australia. More information about Sam Knows can be found at: www.samknows.com.

Monitoring results and reports from the programme will be available on a dedicated
website from October 2018 at www.measuringbroadbandnewzealand.com. We are also
exploring other options and communication channels to get broadband performance
information to as many consumers as possible.

Volunteers wanted
The Commission and SamKnows are seeking 3,000 households to be part of our new
nationwide programme.

Once selected, volunteers will be provided with a Whitebox (similar to a modem) to plug in
at home. The Whitebox will perform automated tests on a home’s internet performance at
different times of the day. It will not record any personal information or browsing history,
and checks are performed to ensure it does not interfere with volunteers’ internet activities.
Some broadband data will be used to conduct testing.

Volunteers will have access to their own personal broadband performance information
collected by their Whitebox in real time through a personalised online performance
dashboard. This information may help diagnose problems and improve their home
broadband performance.

Watch our volunteer recruitment video here. More information on the programme and
details about how to become a volunteer can be found at
www.measuringbroadbandnewzealand.com.

Retail telecommunications are a Commission priority
Retail telecommunications have been a priority focus area across both our consumer and
our regulation work for 2017/18.3 Although telecommunications services are complex and
fast changing, we would like to see a reduction in the number of problems consumers are
reporting.

3
    Commerce Commission “Priorities 2017/18”, available at http://www.comcom.govt.nz/the-
    commission/about-us/

Broadband performance testing in New Zealand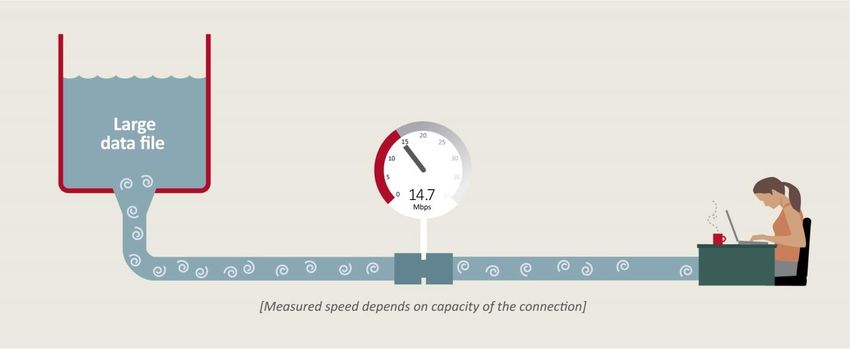
6
Our initial focus for 2017 was to provide consumers with information to help them make
informed purchasing decisions as well as to know where to go when they have an issue. Our
beginners’ guides to broadband can be found on our website.
New legislative obligations
Under the Telecommunications (New Regulatory Framework) Amendment Bill that is
currently before Parliament; section 9A (1)(d) will require the Commission to “monitor retail
service quality in relation to telecommunications services”.4 Amendments to Part 1 of the
Act specify that retail service quality should be interpreted to include “service performance,
speed and availability”. Section 9A(1)(e) will then require us to “make available …
information about retail service quality in a way that better informs consumer choice”.
There are a wide range of factors besides the tested broadband performance metrics that
affect a consumer’s broadband experience. These factors include installation, faults and
customer service experiences (such as call centre wait times). We will also be monitoring
these other factors and publishing information to inform consumers.
Broadband performance explained
Retail broadband services connect Kiwi consumers to the internet by allowing for a high
speed exchange of data over the broadband network. A broadband connection enables
consumers to use all of the services the internet makes available such as email, websites,
streaming video and online gaming.
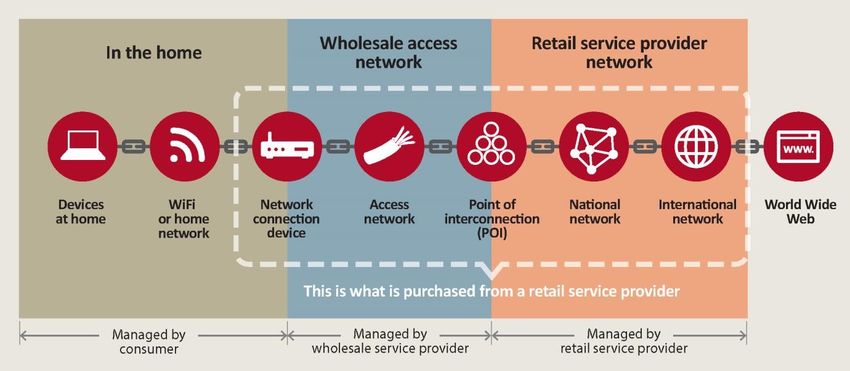
A broadband network that gives consumers access to the internet consists of several distinct
parts that are controlled by different players, as illustrated in Figure 1. The World Wide Web
is a way of sharing information over the medium of the internet.
All of the links in the residential broadband supply chain, including the consumer’s link,
contribute to the final service experienced by the consumer in their home.
It can be seen from Figure 1 that broadband retail service providers manage the service
from the point of interconnection to the handover of content from the World Wide Web.
The retail service provider also often supplies equipment to consumers that goes in the
home, including Wi-Fi routers and modems. This retailer-supplied equipment gives the retail
service provider some influence over the in-home part of consumer’s broadband experience
too.
4
Available at http://www.legislation.govt.nz/bill/government/2017/0293/latest/DLM7393520.html
Broadband performance testing in New Zealand
7
Figure 1: The broadband network
The whole network, starting with the devices in the home and ending with the world wide
web, is essentially what is referred to as the internet.
How does broadband performance affect consumer experience?
The main consumer activities on the internet are:
looking at email, websites and using apps, where consumers want content to appear
quickly;
watching videos, where consumers want the picture to be good quality and for the video
to stream seamlessly (and to not need to pause and wait while it is buffering); and
downloading and uploading files, where consumers want this to happen as quickly as
possible.
The broadband performance consumers experience is the end result of the different
components in Figure 1. The performance experienced by the consumer will only ever be as
good as the weakest link in the chain. In some situations performance may be limited by the
distance data is travelling across the network. In other situations the performance may be
limited by an older device in the consumer’s home.
Broadband performance testing in New Zealand8 What affects broadband performance? There are many different factors that can affect broadband performance when using the internet to perform a particular task but there are essentially three main factors that determine the consumer experience. To perform one of the activities above, a connection or number of connections have to be established. The three factors that affect the performance delivered by the connection(s) are: how quickly the required connection(s) can be set up; the speed at which data can be sent over the connection(s); and how far the data has to travel. Of the many factors that affect how broadband is performing, some are the broadband provider’s responsibility, and some consumers may be able to improve themselves. We have produced a series of fact sheets to help Kiwis spot potential issues, and when they should discuss them with their broadband provider. We also highlight some things consumers can do to improve their broadband performance including tips for getting the best out of their Wi-Fi. Our beginners’ guides to broadband can be found here. How to measure broadband performance We explain below some of the common measures of broadband performance. Understanding these measures can help consumers understand the difference between generic download speed testing and independent testing results, and to identify what is important to them when deciding between broadband options for their household. Download and upload speed Consumers can test the notional download and upload speeds of their broadband service by going to a generic speed test site like www.speedtest.net. These tests work by dumping a relatively large amount of data down and then up the connection pipe. Retail service providers generally ensure that speed test connections traverse as little of the network as possible by minimising restrictions to give the best possible result. A generic speed test is like connecting a hose pipe to a large tank close by and then measuring how fast water flows through the pipe, as shown in Figure 2. This usually gives an impressive headline speed but often bears little resemblance to the speed experienced in most real life uses of a broadband connection. Broadband performance testing in New Zealand
9
                                Figure 2: Download speed testing

Web browsing
Web browsing is the real life practice of looking at websites or accessing content through an
app. Web browsing performance can be expressed as a website load time, and is calculated
by measuring how long a website takes to fully open (or load) and how much data was
downloaded in the process. The result is sometimes converted into a download speed
rather than being expressed as the time in seconds for the website to load because websites
with more data will take longer to load than smaller websites.

Website load time depends on a large number of different factors such as the capacity of
the website itself (ie, how many users the website can handle before performance becomes
noticeably impaired) and where it is located. However, viewing a website generally requires
downloading a large number of small data files, with multiple connections having to be
established, possibly from different sources.

Testing website load time is like setting up a connection, emptying a small tank of water,
shifting the hose to set up another connection, emptying another small tank of water and so
on. This process takes a lot longer to shift the same amount of data compared to one, much
larger, water tank (as is the case for a download speed test) because of the additional time
taken to set up multiple connections. Figure 3 below shows the website load time testing
process. In reality there are likely to be many more than 3 website fragments to be loaded.

Broadband performance testing in New Zealand
10
Figure 3: Website load time testing
The website loading process described above explains why, despite a blistering fast
download speed test result for their retail service provider, a consumer can still find they
are left staring at an unchanging screen for seconds on end while a website loads. It also
helps to illustrate why a generic download speed test is a poor indicator of the quality of a
broadband service, and why independent testing using more ‘real life’ scenarios, such as our
independent broadband testing programme with SamKnows, is so important.
Speed by time of day
At different times of day, because of changes in the volumes of traffic travelling across the
network, the speed at which data travels over connections can be limited. Time-of-day
congestion has been a problem exhibited by some broadband services in the past, and we
discuss this below.
The internet has been compared to the public road network that gets congested at peak
times as more and more traffic is moving across the network. However, unlike the road
network, the internet can have extra capacity and new routes added quickly and for
relatively little cost – so internet congestion can generally be dealt with much more easily
than road congestion.
Our roading analogy can hold true for internet congestion where an international data cable
is at absolute full capacity and the only solution is to build a new undersea cable. This
solution does take a long time to organise and is expensive. However, there are options
than can lessen traffic on international cables like storing widely used content domestically
to avoid bringing it over the cable each time it is requested. This is known as caching.
Latency
Another performance measurement that can be affected by the technology used is latency.
Latency is the round trip time in milliseconds (Ms) for a small amount (packet) of data to
travel to its destination, like a website, and back again (in a process known as pinging). In
general, the lower the latency, the better.
Broadband performance testing in New Zealand11
Latency is an important measure for online gamers because they need to respond to new
events and their online opponents as quickly as possible. The amount of data used in a ping
is small so latency is mostly affected by the distance of the connection route set up. Figure 4
below shows the average latency by technology as measured by TrueNet between 2013 and
2017.
Figure 4: Average latency by technology
70
60
Average latency (Milliseconds)
50
40 Fixed wireless
ADSL
VDSL
30
Cable
Fibre
20
10
0
2013 2014 2015 2016 2017
Source: TrueNet testing results
Fibre connections tend to have the lowest latency while the current generation of fixed
wireless connections tend to have considerably higher latency because the connections take
longer to set up.
Broadband performance testing in New Zealand12
Improvements in performance over time
There have been noticeable improvements in the performance of broadband services since
2007 when we first started testing broadband performance. Download speeds have been
the most consistently measured metric over the decade we have been testing broadband
performance, and the most easily understood. Consistently higher download speeds allows
for more people in each household to stream video at a higher quality.
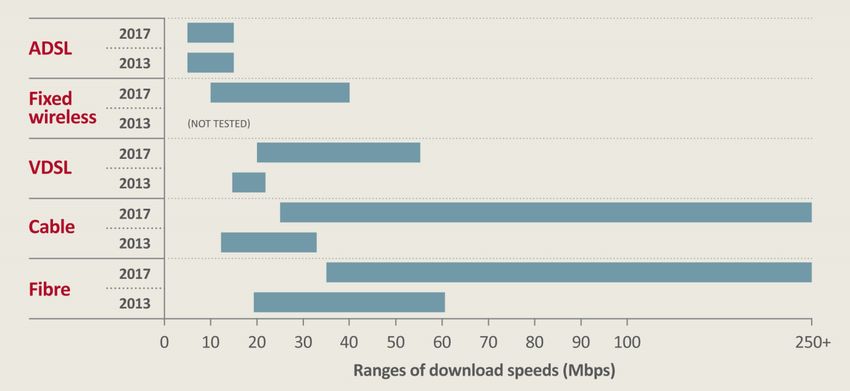
We explain below how download speeds have improved over time and compare them
regionally and internationally. Between 2013 and 2017 there have been speed
improvements across technologies as shown by Figure 5.
Figure 5: Ranges of average speeds by technology (2013 & 2017)
Source: TrueNet testing results
TrueNet’s testing showed that the range of average in-home speeds experienced by Kiwis
on fibre, cable and VDSL technologies have all seen marked improvements in ranges of
speeds between 2013 and 2017. While ADSL speeds only improved marginally, many
consumers who were on ADSL have been upgraded to VDSL (which is capable of much
higher speeds) over this period.
There are a number of reasons for the improvements in broadband performance over time
including improvements at all points in the broadband network shown in Figure 1. Some
improvements have been driven by retail service providers and some by wholesale network
providers.
Retail service providers can influence broadband performance
Retail service providers can influence performance in a number of ways. On the customer
end of the network, improvements in broadband performance can come from upgrades to
the customer premise equipment, such as modems and routers, provided to consumers.
Broadband performance testing in New Zealand13
Improvements in performance have also come from upgrades in the part of the network
that retail service provider’s control. This can be seen from decreased peak hour congestion,
which notably improved over the time that TrueNet was reporting on this.
Retail service providers can manage the broadband traffic over their part of the broadband
network to improve broadband performance. When retail service providers effectively
manage traffic congestion on the network, consumers experience better broadband
performance.
Differentiating traffic can allow retail service providers to make plans available for different
price points to customers.
Figure 6 illustrates how better management of the retail service provider’s network has
allowed the variability of speed to reduce over time. In early 2012, ADSL speeds were as low
as 85% of the maximum speeds possible on the connections. By the end of 2016, this was
consistently exceeding 95%.
Figure 6 was previously shown in our 2016 Annual Telecommunications Monitoring Report.
It shows how average copper ADSL broadband performance in peak hour, as measured by
TrueNet, tracked over the period April 2012 to December 2016.
Figure 6: ADSL peak hour speed variability
Source: Annual telecommunications market monitoring report 2016
Broadband performance testing in New Zealand14
Case study of broadband monitoring: the ‘Netflix effect’
The ‘Netflix effect’ was the large increase in video traffic over broadband networks after the
arrival of Netflix in New Zealand in March 2015. The large increase in traffic caused
congestion that was more noticeable in some retail broadband services than others.
Particularly hard hit was Vodafone’s cable broadband as can be seen from Figure 7. Figure 7
shows the range of speeds during peak and off-peak hours for a 100 Mbps cable test device
deployed by TrueNet.
Figure 7: Vodafone cable 100 Mbps range of results for July 2015
160
140
Download speed (Mbps)
120
100
80
60
40
20
0
Off-peak Peak
Source: TrueNet testing results
Vodafone responded to what was going on with its broadband performance and in July 2015
told its Wellington customers the huge success of Netflix and NEON had led to a ‘massive
spike’ in demand for data, slowing the network, noting a 30% increase in data usage a
month since video-streaming services started.
At this time Vodafone New Zealand technology director Tony Baird said video streaming
accounted for about 60% of Vodafone’s home broadband traffic. He also stated that during
the school holidays they had seen Netflix traffic on their network grow by 83%.5
Vodafone admitted some Wellington and Christchurch customers on its cable broadband
network had been experiencing slower broadband speeds as the network tried to cope with
demand. The sudden surge in demand meant Vodafone moved planned network upgrades
forward to resolve the issue.6
5
Stuff “Netflix demand slows broadband data speeds” (15 July, 2015)
https://www.stuff.co.nz/business/industries/70268550/Netflix-demand-slows-broadband-data-speeds
6
Ibid.
Broadband performance testing in New Zealand15 By October 2015 TrueNet was reporting Vodafone cable as the standout performer. TrueNet reported that its October 2015 testing showed Vodafone cable had made a major improvement in time-of-day performance in peak hour from about half of the advertised speed to now often exceeding advertised speeds. Disruptions to the market such as the arrival of Netflix in New Zealand impact on performance, but retail service providers recovered from this disruption by improving the operation of their networks. Broadband monitoring helps to raise the visibility and understanding of such events and makes the information accessible to consumers to make informed choices. Wholesale service providers also influence broadband performance Much like retail service providers, wholesale service providers also influence broadband performance experienced by Kiwis in their homes through the part of the broadband network supply chain which they control. Wholesale service providers can influence broadband performance through infrastructure and technology improvements to offer wholesale products to retailers to on sell to consumers. The data from Chorus shown in Figure 8 below does not include connection speed on Ultra- Fast Broadband (UFB) networks where Chorus is not the wholesale service provider, for example Christchurch and Hamilton. The connection speed measured by Chorus is the data transfer rate at which the customer premise equipment connects to Chorus’ access network equipment. In technical terms, the speeds for copper (ADSL and VDSL) and fibre broadband are measured slightly differently due to the configuration of the technologies. For copper broadband it is the sync rate between the customer’s modem and Chorus’ equipment (called a DSLAM). For fibre it is the configured speed of the virtual circuit between the customer’s premise and Chorus’ cabinet. Broadband performance testing in New Zealand
16
Figure 8 shows the New Zealand average connection speed for Chorus’ copper and fibre
networks.

                                  Figure 8: Average connection speed by technology on Chorus’ networks
                            150

                            125
  Connection speed (Mbps)

                            100

                             75

                             50

                             25

                              0
                                           Apr-13

                                                             Oct-13

                                                                               Apr-14

                                                                                                 Oct-14

                                                                                                                    Apr-15

                                                                                                                                      Oct-15

                                                                                                                                                          Apr-16

                                                                                                                                                                            Oct-16

                                                                                                                                                                                              Apr-17

                                                                                                                                                                                                                Oct-17
                                  Jan-13

                                                                      Jan-14

                                                                                        Jul-14

                                                                                                          Jan-15

                                                                                                                                                 Jan-16

                                                                                                                                                                                     Jan-17
                                                    Jul-13

                                                                                                                             Jul-15

                                                                                                                                                                   Jul-16

                                                                                                                                                                                                       Jul-17
                                                                                        Copper                      Fibre                      Average

Source: Chorus

In December 2017 the average connection speed for fibre was 142Mbps, almost five times
higher than the average connection speed for copper at 29Mbps. Between January 2013
and December 2017 the average connection speed more than doubled both for copper and
for fibre. The figure for copper includes both ADSL and VDSL connections. Over time, as
Chorus has migrated more customers from ADSL to VDSL, which is capable of much faster
speed (see Figure 5 above), the average copper connection speed has increased.

Between May 2015 and July 2015 there was a sharp increase in fibre connection speeds
from 44Mbps to 77Mbps. This increase can largely be attributed to two things. First and
most importantly – during the 2015/16 financial year Chorus introduced new 100Mbps
plans for retail service providers at a $40 wholesale price to help establish this speed as the
entry level fibre product. This new wholesale fibre product meant that retail service
providers could start offering a 100Mbps fibre plan to many consumers, which was higher
than previous 30Mbps entry level fibre plans.

Secondly, average Chorus fibre speeds also increased as a result of the Dunedin Gigatown
initiative - where Chorus made available a fibre service with a speed approaching one
Gigabit per second at the same price as the entry level plan. The very first services were
activated in February 2015 however the uptake of these services is dependent on the UFB
build. Dunedin’s UFB build has only recently been completed.

Regional differences in speed
Regional differences in connection speeds are a function of the types of broadband
technology available in each area. Chorus’ average connection speeds are typically much
higher where there are more connections on Chorus’ UFB network as fibre connections are
capable of much higher connection speeds than copper connections.

Broadband performance testing in New Zealand
17
Figure 9 below shows the geographic distribution of average connection speeds of Chorus’
network by territorial authority area. Figure 9 shows higher speeds in urban areas where
there is typically a higher proportion of fibre connections.
In August 2017 the Ministry of Business, Innovation and Employment (MBIE) announced
that by 2022, at the completion of the UFB build, 87% of New Zealanders will have access to
fibre.
In more rural areas the average speeds are lower as consumers are further away from
exchanges and there is a limited range of technologies available to these homes.
Because it is not cost-effective for the Government to provide UFB in every rural
community, it has set up the Rural Broadband Initiative (RBI) to provide faster broadband
services to hundreds of thousands of rural homes and businesses outside UFB areas. 7
7
See http://www.mbie.govt.nz/info-services/sectors-industries/technology-communications/fast-
broadband/broadband-and-mobile-programmes#rural
Broadband performance testing in New Zealand18
Figure 9: Average connections speeds on Chorus' network – December 2017
Source: Chorus
Broadband performance testing in New Zealand19 The Chorus data used above shows that Dunedin City had an average connection speed of 265Mbps. This is significantly higher than other areas and is a result of the Dunedin Gigatown initiative. The next highest average connection speed was in North Shore City at 81Mbps. The lowest average connection speed was 19Mbps in the Waimate, Central Hawke’s Bay and Otorohanga Districts with other more rural areas at around 21-25Mbps. Note that these average connection speeds on Chorus’ network only. In areas where Chorus is not the wholesale fibre provider, such as in Christchurch where Enable is the fibre provider, average connection speeds may be higher than is shown, as Enable’s fibre connections are not included in Chorus’ average. On average, connection speeds more than doubled between 2015 and 2017, with some areas (such as Wellington City) tripling the average connection speed in two years. Our enhanced broadband performance testing programme provided by SamKnows will test up to 3000 test probes around the country. This testing should allow for a more detailed picture of broadband performance in New Zealand than previous testing regimes. Broadband performance testing in New Zealand
20
International comparison
Akamai measures broadband speeds internationally and produces regular State of the
Internet connectivity reports.8 Figure 10 shows the average broadband speeds reported by
Akamai in 2013 and 2017. While New Zealand is below the OECD average, our average
speed has been increasing fast.

                              Figure 10: Akamai international average broadband speeds (2013 and 2017)
                            25

                            20

                            15
    Average speed (Mbps)

                            10

                             5

                             0
                                            Latvia

                                          Austria

                                          Greece
                                        Australia
                                         Sweden

                                   OECD average
                                          Canada

                                        Hungary

                                        Portugal
                                          Poland

                                    Luxembourg
                                            Israel

                                              Italy

                                          Turkey
                                          Finland

                                  Czech Republic

                                         Belgium

                                          Estonia
                                       Denmark
                                   United States
                                     Netherlands

                                 United Kingdom

                                       Germany

                                           France

                                          Mexico
                                     Switzerland

                                            Spain

                                    New Zealand

                                        Slovenia

                                             Chile
                                         Norway

                                            Japan

                                          Ireland

                                                                 Average 2013      Average 2017

Source: Akamai

Between 2013 and 2017, New Zealand’s average broadband speed increased threefold from
4.4Mbps to 14.7Mbps. This was the fastest rate of increase of all OECD countries tracked by
Akamai. The increase is largely attributed to the rollout of UFB networks in New Zealand
which are capable of delivering high speeds.

8
                           Akamai “Quarterly Connectivity Reports – Most Recent Connectivity Report” Available at
                           https://www.akamai.com/us/en/about/our-thinking/state-of-the-internet-report/global-state-of-the-
                           internet-connectivity-reports.jsp

Broadband performance testing in New Zealand
21 About topic papers This topic paper is published under section 9A(1)(a) and (c) of the Telecommunications Act 2001, which requires us to monitor competition in, and the performance and development of, telecommunications markets and to make information about these matters available. Topic papers are one of the ways that we report and summarise information relevant to that function. In prior years we have reported on market developments as part of our Annual Telecommunications Monitoring Report. When we published our 2017 Annual Telecommunications Monitoring Report in December 2017, we signalled that we had decided to condense that report to focus on key trends and provide an additional series of topic papers on specific areas of interest, market developments, and trends. Our topic papers are additional to our monitoring associated with specific section 9A studies, determinations and information disclosure. Broadband performance testing in New Zealand
22

List of defined terms
ADSL          Asymmetric Digital Subscriber Line – a type of DSL with download speeds up to 24Mbps
App           Application – an app is a standardised piece of software that runs on a computing platform. The
              term ‘app’ originally referred only to applications for mobile devices and tablets, but is now also
              used when referring to a wide range of devices including desktop computers
DSL           Digital Subscriber Line – method of transmitting high-speed data and, if necessary, voice
              simultaneously over a copper phone line
GB            Gigabyte – 1 gigabyte = 1024 megabytes. Roughly 5 hours of streaming video

LFC           Local Fibre Company – these are the four companies contracted with government agency Crown
              Infrastructure Partners to deploy Ultra-Fast Broadband to 75% of the population by rolling out fibre
              optic access networks
MB            Megabyte – a multiple of the unit byte for measuring the quantity of digital information

Mbps          Megabits per second – used to measure data transfer speeds of high bandwidth connections, such
              as fibre, Ethernet and cable modems
RBI           Rural Broadband Initiative – an initiative where the government partners with private sector
              telecommunications operators to upgrade or extend telecommunications networks in rural areas
UFB           Ultra-Fast Broadband – the name given to the Government’s initiative to roll out a
              fibre-to-the-premise access network to give households and businesses access to very high-speed
              broadband
VDSL          Very High Bitrate (high-speed) DSL with speeds up to 70Mbps
Wi-Fi         Wireless Fidelity Standard – a series of standards for a popular technology that allows electronic
              devices to exchange data wirelessly (using radio waves), including allowing mobile devices to
              connect to high-speed internet connections. The distance over which a Wi-Fi connection will
              operate can vary from 20 metres indoors to potentially tens of kilometres outdoors

Broadband performance testing in New Zealand
You can also read