The Demands of a Women's College Soccer Season - MDPI
←
→
Page content transcription
If your browser does not render page correctly, please read the page content below
sports
Article
The Demands of a Women’s College Soccer Season
Jeremy A. Gentles 1, * ID , Christine L. Coniglio 1 , Matthew M. Besemer 2 , Joshua M. Morgan 2
and Michael T. Mahnken 2
 1   Department of Sport, Exercise, Recreation, and Kinesiology, East Tennessee State University, Johnson City,
     TN 37614, USA; coniglio1918@gmail.com
 2   Department of Health Sciences, Armstrong State University, Savannah, GA 31419, USA;
     matt.besemer@cox.net (M.M.B.); josh2morgan@gmail.com (J.M.M.); mtmahnken@gmail.com (M.T.M.)
 *   Correspondence: jeremygentles@gmail.com

 Received: 31 December 2017; Accepted: 14 February 2018; Published: 23 February 2018

 Abstract: The purpose of this study was to use GPS, accelerometers, and session rating of perceived
 exertion (sRPE) to examine the demands of a Division II women’s soccer team. Data was collected
 on 25 collegiate Division II women’s soccer players over an entire regular season (17 matches and
 24 practices). ZephyrTM BioHarnesses (BHs) were used to collect tri-axial acceleration information
 and GPS derived variables for all matches and practices. Acceleration data was used to calculate
 Impulse Load, a measure of mechanical load that includes only locomotor related accelerations.
 GPS was used to quantify total distance and distance in six speed zones. Internal Training Loads
 were assessed via sRPE. Mean Impulse Load, total distance, and sRPE during match play was
 20,120 ± 8609 N·s, 5.48 ± 2.35 km, and 892.50 ± 358.50, respectively. Mean Impulse Load, total
 distance, and sRPE during practice was 12,410 ± 4067 N·s, 2.95 ± 0.95 km, and 143.30 ± 123.50,
 respectively. Several very large to nearly perfect correlations were found between Impulse Load and
 total distance (r = 0.95; p < 0.001), Impulse Load and sRPE (r = 0.84; p < 0.001), and total distance and
 sRPE (r = 0.82; p < 0.001). This study details the mechanical demands of Division II women’s soccer
 match play. This study also demonstrates that Impulse Load is a good indicator of total distance.

 Keywords: soccer; accelerometer; Impulse Load; GPS; microsensor; Training Load; workload

1. Introduction
      The demands of women’s soccer match play have been detailed in a substantial body of
literature [1]. Typical match play duration is 90 min, consisting of two 45 min halves, and one
15 min half-time. Average total distances covered per player during elite women’s soccer match play
are 8500–10,300 m [2]. Soccer requires substantial aerobic and anaerobic fitness, with demands varying
between competitions, by position, and match play style [1]. Aerobic fitness has been identified as
an important fitness characteristic and it has been suggested that a VO2 max of ~55 mL/min/kg
is sufficient to play high level women’s soccer [2,3]. While the majority of match play is spent at
velocity thresholds associated with walking and low speed running, average heart rate (HR) and peak
HR in elite female match play have been reported to be 87% and 97% of max HR [1], respectively.
In professional women’s soccer, it has been reported that mean sprint distance is ~15.1 ± 9.4 m,
individual sprint time is ~2.3 ± 1.5 s, and time between sprints is ~2.5 ± 2.5 min [4]. The high mean
match play HR and sprinting requirements illustrate the importance of anaerobic fitness for women’s
soccer match play.
      Recently, distance in velocity thresholds associated with high speed running (HSR) and sprinting
has gained the attention of researchers [4,5]. Historically, definitions of HSR and sprinting were
derived from velocity thresholds established from men’s soccer [5]. However, there is a growing
body of literature focused on velocity thresholds that better define HSR and sprinting in women’s

Sports 2018, 6, 16; doi:10.3390/sports6010016                                     www.mdpi.com/journal/sports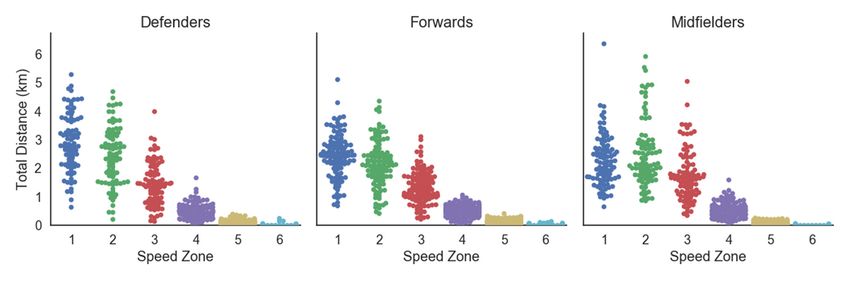
Sports 2018, 6, 16                                                                                   2 of 11

soccer [5]. For instance, HSR (19.8–25.1 kph) and sprinting thresholds (≥25.1 kph) used to describe
speed zones of elite male match play seem to exaggerate the physical abilities of elite female players [5].
Previous research has underestimated the distance completed during HSR and sprinting in professional
women’s soccer as a result of using velocity thresholds for male soccer players [6]. Although HSR and
sprinting contribute relatively little to total distance during match play, to better quantify HSR and
sprinting demands, profiles for female HSR and sprinting have been recently established. Based on the
latest evidence, HSR and sprinting thresholds in collegiate and professional women’s soccer should be
approximately 15 kph and >20 kph, respectively. Currently, the body of literature describing HSR and
sprinting in women’s soccer using these recommended velocity thresholds is limited, particularly at
the collegiate level [5]. As a result of these new recommendations, distance in HSR and sprinting
should be further investigated at various levels of women’s soccer.
      GPS is a common method used by sport science and coaching staff to quantify total distance
and distance in speed zones for a variety of sports [7,8]. Although GPS is often used to quantify
the demands of a variety of sports, as alluded to previously, few studies have used GPS to quantify
the demands of women’s soccer, and fewer yet have assessed the demands of women’s college
soccer [5]. The dearth of evidence detailing the demands of women’s college soccer as measured
via GPS is noteworthy, as it is important to distinguish between the demands of women’s college
soccer and women’s soccer more generally. Collegiate soccer allows for unlimited substitutions while
international rules soccer allows only three substitutions per match, which may make it inappropriate
for practitioners to design practice and conditioning sessions for college soccer based on evidence from
soccer matches following international rules.
      Despite the popularity of GPS use in team sport, practitioners should be aware of the potential
limitations of GPS and the specifications of GPS units themselves. The circular error probability (CEP)
of GPS has been reported to be approximately 1–5 m [9,10], meaning that 50% of an athlete’s recorded
positions will be within 1–5 m of the athlete’s true position. The GPS chipset and environmental factors
such as cloud cover and obstructions may impact GPS accuracy by influencing CEP, satellite acquisition
times, and the number of satellites the GPS unit is able to connect with. It is generally agreed upon
that GPS accuracy improves as distance increases, while GPS accuracy decreases as speed increases,
particularly during HSR and sprinting [11–14]. In order to increase accuracy, it is suggested that GPS
units should sample at 5–15 Hz [15,16], with some evidence recommending no less than 10 Hz and
other suggestions that 10 Hz is superior to 15 Hz [13,17]. However, the discrepancy in sampling
frequency recommendations may also be a result of different GPS chipsets and algorithms used to
calculate distance and speeds between devices sampling at different rates [16]. The authors of this
study are not aware of a single study that has compared GPS devices sampling at different rates (i.e.,
1, 5, and 10 Hz) while also configured with the same chipset. Regardless of sampling frequency and
algorithm/filter used, GPS will likely misrepresent position, distance, and speed due to accuracy
limitations, particularly in sports that require repeated changes of direction, HSR, and sprinting.
      Accelerometers and inertial measurement units (IMUs) have been used to quantify workloads
in a variety of sports [18–20] and are most often measured with triaxial accelerometers and reported
as the sum of acceleration in three movement planes (side-to-side; forwards and backwards; up and
down). Accelerometers and GPS are frequently combined into the same unit, thus allowing GPS-
and accelerometry-based workloads to complement one another. A strong relationship between total
distance- and accelerometry-based workloads have been reported [18,21], although accelerometers
provide potential benefits over GPS, as they measure all movement and can be used to quantify
the number of accelerations and decelerations, number and magnitude of impacts, step and jump
counts, and a variety of other variables [22]. Accelerometers also function indoors, do not require
the use of satellites, and do not suffer from the same potential loss of signal that GPS does. Recently,
Buchheit et al. [23] suggested that Force Load, an accelerometry-derived Training Load that includes
only locomotor related events and impacts, may have numerous advantages compared to Training
Loads obtained via GPS as well as other common accelerometry-based Training Loads that include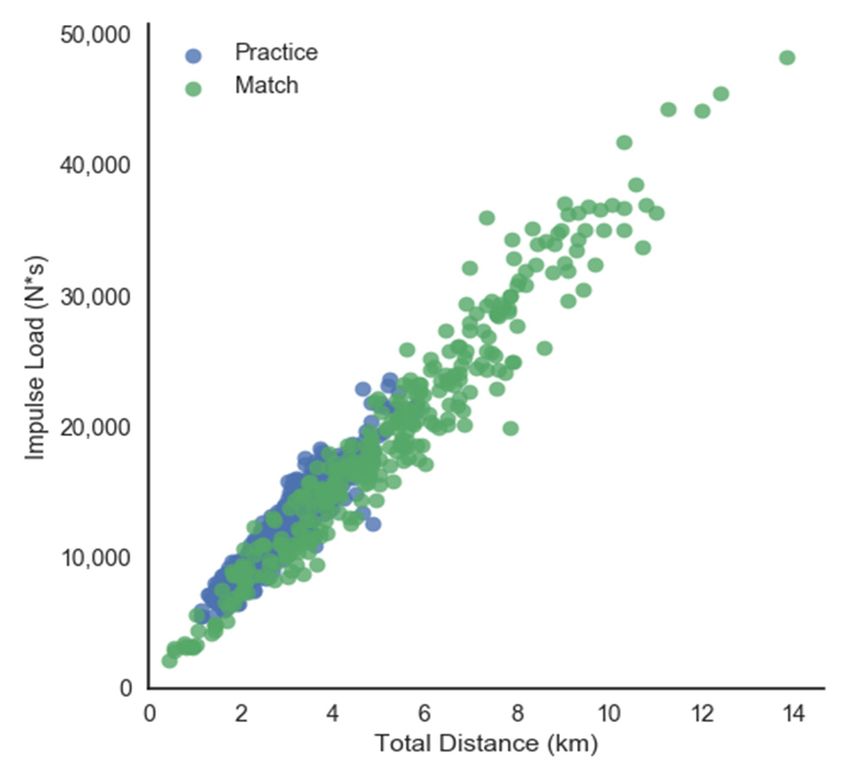
Sports 2018, 6, 16                                                                                                        3 of 11

all measured accelerations in their calculation. Currently, the most common accelerometry-based
Training Load reported in the literature is Player Load [24]. Player Load includes all accelerations in the
Training Load calculation and is calculated as the sum of absolute differences of acceleration divided
by the sampling frequency of the device (generally a triaxial accelerometer sampling at 100 Hz) [25];
the formula for Player Load is shown below. However, Player Load may misrepresent Training
Load, since activities of non-locomotor origin are included, and Player Load is the sum of absolute
differences of acceleration and not the sum of the absolute values of acceleration. To our knowledge,
not a single study has been published describing the accelerometry-derived Training Loads of women’s
college soccer.
                               q
                         n         ( x s = i + 1 − x s = i )2 + ( y s = i + 1 − y s = i )2 + ( z s = i + 1 − z s = i )2
        Player Load =   ∑                                                 100
                        s =1

     There is currently limited GPS evidence and a complete absence of investigations addressing
accelerometry-based workloads in women’s college soccer. Furthermore, in order to address the
shortcomings of GPS and common accelerometry-derived Training Loads, it may be beneficial to
use accelerometry-based Training Loads that include only locomotor-related events, as suggested
by Buchheit et al. [23]. The purpose of this study was therefore twofold. First, in order to describe
the demands of women’s college soccer, this study aimed to quantify the external and internal
Training Loads of practices and matches throughout an entire regular season in women’s college soccer.
External demands were quantified using GPS to calculate total distance and distance in speed zones,
while accelerometers were used to measure locomotor-related events only. Internal Training Loads
were quantified via session rating of perceived exertion (sRPE). Second, this investigation served to
explore the relationships between accelerometry-derived Training Loads that include only locomotor
activity, and Training Loads assessed using GPS and sRPE.

2. Methods

2.1. Subjects
     Twenty-five collegiate DII women’s soccer players participated in the study (age 20.2 ± 1.1 years,
height 166.3 ± 5.9 cm, weight 62.0 ± 7.0 kg, Yo-Yo Intermittent Recovery Test Level 1 Distance
1069 ± 255 m, countermovement vertical jump height 28.6 ± 3.4 cm). This investigation was approved
by the Institutional Review Board and all participants completed and signed university-approved
informed consent.

2.2. Operation of Wearable Device
     Each athlete was assigned and familiarized with the wear and operation of the ZephyrTM
BioHarness (BH; Zephyr Technology Corporation, Annapolis, MD, USA) during preseason training.
Each BH included a Biomodule (version 3) and strap. Athletes were equipped with a BH that was
worn during competition. The BH strap was placed at the level of the xyphoid process and the
Biomodule was positioned on the midaxillary line. The Biomodule contains a HR sensor and triaxial
accelerometer that sample at 250 Hz and 100 Hz, respectively. Data from the HR sensor was not
included in this study. BH data was downloaded to and analyzed with OmniSenseTM Analysis
(version 4.1.4; Zephyr Technology Corporation, Annapolis, MD, USA). GPS units (BT-Q1300ST GPS,
Qstarz International Co., Taipei, Taiwan) sampling at a true rate of 5 Hz (not interpolated) were also
worn by each participant. Each GPS unit was attached to the BioHarness strap and interfaced with the
Biomodule via Bluetooth.
     The validity and reliability of BH-derived accelerometry loads has been demonstrated during a
variety of tasks. Johnstone et al. [26] assessed the validity of the BH using a discontinuous incremental
treadmill protocol and BH precision was evaluated via tilt table. During the treadmill protocol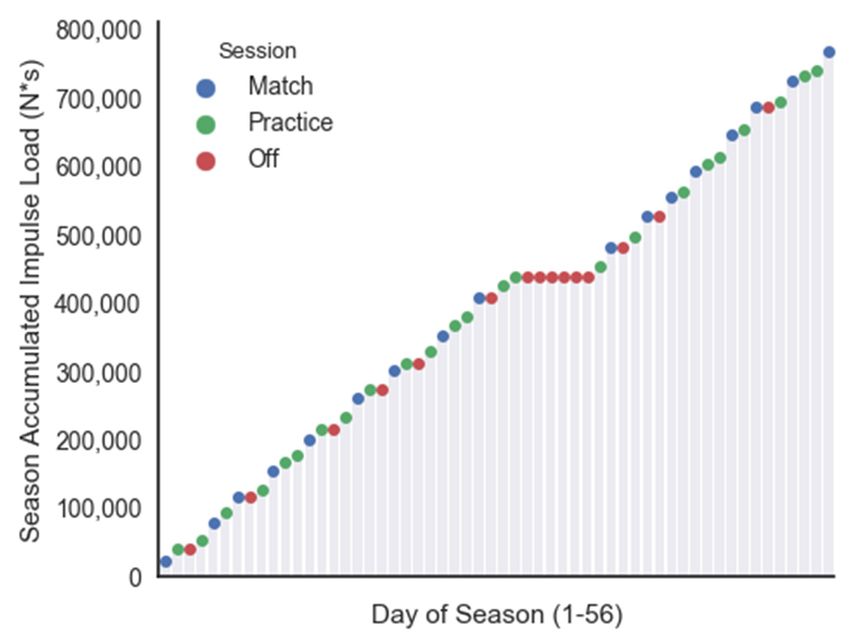
Sports 2018, 6, 16                                                                                     4 of 11

(0–12 kph), very strong relationships were demonstrated between BH-derived accelerometry loads
and oxygen uptake (r = 0.97, p ≤ 0.01), as well as mean step count (r = 0.99, p ≤ 0.01). Using a tilt
table, the BH was able to determine angle change when compared to a Flexometer (Leighton, Spokane,
WA, USA); there was a very strong relationship between the BH and Flexometer (r = 0.99; p ≤ 0.01)
and narrow limits of agreement between the measured angle of both devices (0.20 ± 2.62). Using the
same treadmill and tilt table protocols used above [26], between subject, intra device, and inter
device reliability has been demonstrated to be very strong with calculated intraclass correlation
coefficient (ICC) and coefficient of variation (CV) consistently ≥0.99 and  0.90; p < 0.01) and simultaneous wear of two BHs showed
that inter device reliability was very strong (ICC = 0.93; CV = 10.3) [28]. Interestingly, during ten flights
totaling 25,700 s in an F/A18 aircraft, the BH has also been shown to be a valid measure of gravitation
force exhibiting very strong relationships (r = 0.92; r = 0.93) with the F/A-18’s Carrier Aircraft Inertial
Navigation System-2 (CAINS-2) and ActiGraph WGT3X-BT Monitor (ActiGraph LLC, Pensacola, FL,
USA), respectively [29].
      The BT-Q1300ST GPS unit is equipped with the MediaTek II (MTKII) chipset and the accuracy of
the MTKII chipset has been established on several occasions. The MTKII chipset has demonstrated
greater accuracy (mean CEP = 5.0 m) and the lowest satellite acquisition times (mean time = 26.3 s)
under a variety of environmental conditions when compared to other commercially available GPS
units [10]. Wu et al. [30] showed that during static and dynamic conditions, the MTKII chipset had the
lowest outdoor satellite acquisition times, the lowest percentage of signal loss, and the lowest outdoor
horizontal dilution of precision when compared to six other GPS units. The reliability of the MTKII
chipset has been shown to be very high to nearly perfect (ICC = 0.80–1.0) when quantifying distances
in different speed zones (>19 kph to 0–5 kph) [31].

2.3. Match Time
     Data was collected on 25 players over an entire regular season (17 matches and 24 practices).
All BH and GPS units were powered on by the researchers prior to the start of each match and
practice. Data collected in each of the 17 matches was categorized according to warm-up and match
play segments. Warm-up included all activities prior to the beginning of match play. Warm-up
activities included jogging, multidirectional running, dynamic stretching, jumping and bounding,
change of direction, short sprints, and soccer-specific drills (dribbling, passing, tackling, shooting, etc.).
Match play included two 45 min halves, a 15 min half-time, and overtime periods if they occurred;
only three overtime periods occurred during the season. A regulation National Collegiate Athletic
Association (NCAA) DII soccer match is 90 min, consisting of two- 5 min halves, one 15 min half-time
break, and overtime periods are 10 min in duration if they are required. If stoppage time occurs, it is
added to the end of standard play in each half and overtime. Total time played during match play was
also recorded for each player. A total of 392 match and 522 practice sessions were analyzed. Due to
erroneous GPS data such as zero distance recorded or excessive high peak speeds, some GPS-related
data was removed for analysis. In total, accelerometry data was analyzed for all 392 match and
522 practice sessions. GPS data was analyzed from 305 match and 407 practice sessions.

2.4. Accelerometry
    Gravitational forces (1 g = 9.81 m/s2 ) were recorded to describe acceleration data collected
from BH at 100 Hz. Total mechanical loads were expressed as Impulse Load. Impulse Load is the
accumulated mechanical load equal to the sum of areas under the 3-axis accelerometry curves and
expressed as N·s. Impulse Load only includes detected locomotor events (e.g., walking, running,
bounding, jumping) and impacts. Mean Impulse Loads were calculated for practice, warm-up,
and match play. The formula for Impulse Load is displayed below, where x = g forces in the
Sports 2018, 6, 16 5 of 11
medio-lateral (“side-to-side”) plane, y = g forces in the anterio-posterior (“forwards and backwards”)
plane, and z = g forces in the vertical (“up and down”) plane [32].
n
p
xs2 + y2s + z2s
Impulse Load = ∑ 9.8067
s =1
2.5. GPS
GPS units were used to collect total distance (km) and distance in speed zones during practice,
warm-up, and match play. Speed was divided into six different zones: 1.0–4.99 kph (Zone 1); 5–9.99 kph
(Zone 2); 10–14.99 kph (Zone 3); 15–19.99 kph (Zone 4); 20–24.99 kph (Zone 5); ≥25 kph and greater
(Zone 6). All GPS units were turned on approximately 10 min prior to use to ensure satellite signals
were acquired.
2.6. sRPE
Approximately 15 min after each practice and match, athletes reported their rating of perceived
exertion (RPE) using the Borg CR-10 RPE scale [33]. Session rating of perceived exertion was calculated
by multiplying the reported RPE times the session duration in minutes [33]. Practice session duration
included the entire duration of the practice session while match session duration included total time
between the start of warm-up through the end of match play.
2.7. Statistics
Data were analyzed with JASP (version 0.8.3.1) and expressed as means, standard deviations,
and 95% confidence intervals (CIs). The relationships between Impulse Load and total distance,
Impulse Load and sRPE, and total distance and sRPE were assessed using the Pearson product-moment
correlation coefficient. The magnitudes of the correlations were interpreted via the following standard:
trivial = 0.0–0.1; small = 0.1–0.3; moderate = 0.3–0.5; large = 0.5–0.7; very large 0.7–0.9; nearly perfect =
0.9–1.0 [34].
3. Results
Team mean warm-up duration was 45.64 ± 6.65 min and match mean duration was
116.72 ± 12.28 min. Mean Impulse Load, total distance, and sRPE during match play were
20,120 ± 8,609 N·s, 5.48 ± 2.35 km, and 892.50 ± 358.50, respectively. Mean Impulse Load,
total distance, and sRPE during practice were 12,410 ± 4,067, 2.95 ± 0.95 km, and 143.30 ± 123.50,
respectively. Table 1 provides team means and standard deviations for session duration and all GPS-,
accelerometry-, and sRPE-derived metrics during practice, match warm-up, and match play.
Table 1. Team mean session duration and all GPS-, accelerometry-, and sRPE-derived metrics during
practice, match warm-up, and match play. RPE: rating of perceived exertion; sRPE: session rating of
perceived exertion.
Practice Match Warm-Up Match Play (Played Only)
Session Duration (min) 75.77 (±16.65) 46.22 (±6.68) 116.50 (±12.12)
Duration Played (min) NA NA 45.32 (±26.01)
Distance in Speed Zone 1 (km) 1.30 (±0.44) 1.04 (±0.23) 1.74 (±0.79)
Distance in Speed Zone 2 (km) 1.00 (±0.40) 0.70 (±0.23) 1.83 (±0.92)
Distance in Speed Zone 3 (km) 0.47 (±0.25) 0.26 (±0.11) 1.32 (±0.73)
Distance in Speed Zone 4 (km) 0.15 (±0.13) 0.09 (±0.05) 0.46 (±0.25)
Distance in Speed Zone 5 (km) 0.03 (±0.07) 0.01 (±0.02) 0.11 (±0.08)
Distance in Speed Zone 6 (km) 0.00 (±0.01) 0.00 (±0.01) 0.02 (±0.02)
Total Distance (km) 2.95 (±0.95) 2.1 (±0.47) 5.48 (±2.35)
Impulse Load (N·s) 12,410 (±4067) 9694 (±1902) 20,120 (±8609)
Session RPE 143.30 (±123.50) NA 892.50 (±358.50)Sports 2018, 6, 16 6 of 11
Several very large to nearly perfect correlations were found between Impulse Load and total
distance (r = 0.95; p < 0.001), Impulse Load and sRPE (r = 0.84; p < 0.001), and total distance and sRPE
Sports
(r 2018,p6,45.32 ± 26.01 min, mean Impulse Load was 20,120 ± 8609 N·s, and mean total distance was 5.48 ± 2.35
km. Time played during match play ranged from 1.0–110.0 min, the highest and lowest Impulse Load
during match play was 48,280 N·s and 4215 N·s, respectively, and total distance ranged from 1.09–
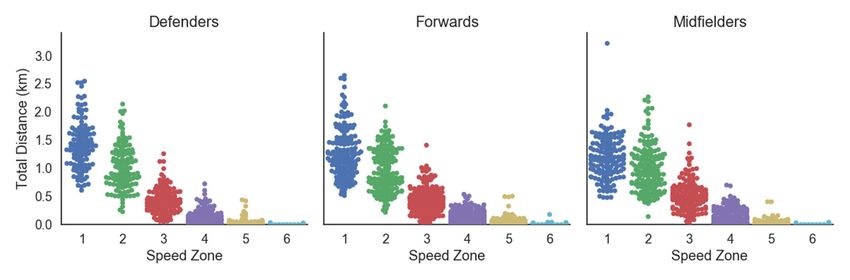
13.85 km. Furthermore, Figures 2 and 3 present swarm plots illustrating the distribution of distance
in all speed zones by player position during matches and practice, respectively. This variability
Sports 2018, 6, 16 7 of 11
should be considered when quantifying the demands of women’s collegiate soccer.
Sports 2018, 6, x FOR2.
Figure PEER REVIEW
Swarm plot of distance in all speed zones by player position during match play. 7 of 11
Figure 2. Swarm plot of distance in all speed zones by player position during match play.
Figure 3.
Figure Swarm plot
3. Swarm plot of
of distance
distance in
in all
all speed
speed zones
zones by
by player
player position
position during
during practice.
practice.
Previous research in women’s soccer has categorized speed zones based on gender-specific
abilities and locomotor activity that is associatedassociated with those those speed
speed zones
zones [5,35].
[5,35]. Recently updated
definitions of of walking
walkingand andrunning
runningactivities
activitiesininwomen’s
women’s soccer
soccer areare
presented
presentedin three
in threecategories; (1)
categories;
standing/walking/low speed running (20
(3) sprinting kph)kph)
[5,35]. Table
[5,35]. 1 presents
Table 1 presentstime in in
time speed
speed zones
zonesfrom
fromthis
thisstudy
studyaccording
according to to six
speed zones. The results of this study, similar to findings of previous investigations in collegiate and
professional women’s soccer [5], show that the majority of total match play distance occurs in speed
zones that represent standing, walking, and low speed running. As As detailed
detailed inin Table 1, high speed
running and sprinting contribute very little to total distance, although both have been identified as
variables important for match play play performance
performance and and injury
injury [36].
[36].
Unsurprisingly, very large correlations were found between sRPE and external Training Loads
(Impulse Load
(Impulse Loadand andGPS).
GPS). Strong
Strong relationships
relationships between
between sRPEsRPE and GPS-
and both both and
GPS- and accelerometry-
accelerometry-derived
derived training
training have been have been reported
reported previously previously [37–41]. more
[37–41]. Perhaps Perhaps more important
important is the relationship
is the relationship between
between Load
Impulse ImpulseandLoad and total(rdistance
total distance = 0.95; p (r = 0.95;found
< 0.001) p < 0.001)
in thisfound
study.inWhile
this study.
previousWhile previous
research has
research
found has found
a strong a strong
to very strongtorelationship
very strongbetween
relationship
Playerbetween
Load and Player
totalLoad and in
distance total distance
soccer in
[21,41],
soccer
the [21,41], the
relationship relationship
found between found
Impulse between
Load and Impulse Load and
total distance totaltodistance
seems seems
be uniquely to be uniquely
strong. This may
strong.
be ThisImpulse
because may beLoadbecause
onlyImpulse
includesLoad only includes
locomotor locomotor
activity and activity
represents and of
the sum represents
locomotorthe sum
events.
of locomotor events. Accelerometry-derived
Accelerometry-derived Training Loads such as Training
Impulse Loads
Loadsuch
and as Impulse
Force Load Load and Force
may provide Load
benefits
may other
over provide benefits over other
accelerometry-based accelerometry-based
workloads such as Player workloads
Load [42],suchwhich as includes
Player Load [42], which
all accelerations
includes
of all accelerations
the torso, of the torso, including
including non-locomotor activities,non-locomotor
and representsactivities,
the sum and represents
of absolute the sum of
differences
absolute differences
acceleration. of acceleration.
The benefits of using The benefits of using
accelerometry accelerometry
workloads that onlyworkloads that only activity
include locomotor include
locomotor
have activity have
been recognized been recognized
previously [23], butpreviously [23], butcurrently
limited examples limited examples
exist in thecurrently
literatureexist in the
related to
literature related
workloads in sportto[19].
workloads in sport [19].
Unique to this study was that Hurricane Matthew struck the southeast coast of the United States
during the middle of the regular season. Due to this major hurricane, a mandatory evacuation was
issued that resulted in multiple match postponements and missed practices. Matches missed during
this period were made up during the last two weeks of the regular season. Figure 4 displays the
frequency of practices, matches, and days off, as well as the team mean accumulated Impulse Load
throughout the 56-day regular season. No contact with the team occurred during the mandatory
evacuation period (days 31–36). It can be seen that the frequency of matches and the rate of
accumulating Impulse Load both increased during the second half of the regular season (days 37–Sports 2018, 6, 16 8 of 11
this period were made up during the last two weeks of the regular season. Figure 4 displays the
frequency of practices, matches, and days off, as well as the team mean accumulated Impulse Load
throughout the 56-day regular season. No contact with the team occurred during the mandatory
evacuation
Sports 2018, 6, xperiod
FOR PEER(days
REVIEW31–36). It can be seen that the frequency of matches and the rate of
8 of 11
accumulating Impulse Load both increased during the second half of the regular season (days 37–56).
using
During GPS
theunits
first that sample
thirty days ofat the
>5 Hz, it is possible
season, that the
nine matches GPSplayed,
were units used
withintwo
thistostudy,
three which sample
days between
at 5 Hz, are
matches. not the
During ablelast
to 20
capture
days ofpositional
the season, information
eight matchesfrequently enough
were played, to only
with accurately measure
one to two days
distance
between matches. While injury data was not presented in this study, it is reasonable to assume that
during HSR and sprinting. Third, the algorithms used to identify the locomotor events that
are
this included
situation mayin Impulse Load are
have resulted proprietary.
in higher levels ofAs a result,
fatigue that it
mayis difficult to verify
have negatively with absolute
influenced injury
certainty that only locomotor events are being included in the calculation of Impulse Load.
risk and performance.
Figure
Figure 4.
4. Team
Team mean
mean accumulated
accumulated Impulse
Impulse Load
Load throughout
throughout the
the 56-day
56-day regular
regular season.
season.
5. Practical Applications and Future Research
There are several important limitations that should be considered in this study. First, GPS in
Coaches
general becomes and less
sport scientists
accurate as can
speed useincreases
Impulse and Load,withtotal distance,
repeated distance
change in speed zones,
of direction. and
Therefore,
sRPE to help
distances guide zones
in speed and design
>20 kph,effective practices
as well as speed andandtraining
distance programs
associatedthatwith
prepare athletes
changing for the
direction,
demands of women’s college
may be misrepresented. soccer.
Second, However,
while to easehas
the literature thenotmanagement of what
clearly assessed the can be a large
potential volume
benefits of
of data, practitioners may benefit from limiting the number of metrics used to
using GPS units that sample at >5 Hz, it is possible that the GPS units used in this study, which sample quantify the demands
of
at their
5 Hz,athletes
are notand sports.
able Considering
to capture the results
positional of this study
information and the
frequently recommendation
enough to accurately of Buchheit
measure
et al. [23], accelerometry-derived Training Loads such as Impulse Load
distance during HSR and sprinting. Third, the algorithms used to identify the locomotor events and Force load, that include
that
only locomotor activities, may provide benefits over GPS- and other accelerometry-based
are included in Impulse Load are proprietary. As a result, it is difficult to verify with absolute certainty Training
Loads.
that only Additionally, accelerometers
locomotor events are being do not suffer
included in thefrom the same
calculation oflimitations
Impulse Load. as GPS, such as signal
loss due to inherent limitations of the device and environmental conditions. Accelerometers also
5. Practical
sample Applications
at higher frequencies andandFuture Research
battery life is also generally superior to GPS.
This research also illustrates the varied
Coaches and sport scientists can use Impulse MP demands Load,that result
total from unlimited
distance, distance in substitutions
speed zones, in
women’s college soccer. Practitioners responsible for the development of
and sRPE to help guide and design effective practices and training programs that prepare athletes for women’s college soccer
athletes
the demands should ofconsider
women’sthat the demands
college of women’s
soccer. However, college
to ease the soccer
managementmay differ dramatically
of what can be a from
large
women’s soccer that follows international rules; this is largely due to
volume of data, practitioners may benefit from limiting the number of metrics used to quantify the fact that collegiate soccer
the
allows for unlimited substitutions, while professional and national team
demands of their athletes and sports. Considering the results of this study and the recommendation soccer only permit three
substitutions
of Buchheit etper al. match. Considering the substitution
[23], accelerometry-derived TrainingrulesLoads of such
women’s collegeLoad
as Impulse soccer,andpractitioners
Force load,
should quantify the MP demands of their specific team and athletes in order
that include only locomotor activities, may provide benefits over GPS- and other accelerometry-based to design practices and
conditioning
Training Loads. activities that suitaccelerometers
Additionally, the strategies employed
do not suffer by from
the sport coach.
the same limitations as GPS, such as
Future research should assess whether Impulse
signal loss due to inherent limitations of the device and environmental Load and its locomotor
conditions. components
Accelerometers(e.g.,
stepping events) are related to variables acquired by GPS,
also sample at higher frequencies and battery life is also generally superior to GPS. such as distance in speed zones.
Additionally, Impulse Load should be used to quantify the Training Loads for individual soccer drills
and other practice elements. Practitioners would also benefit from research that develops non-
proprietary algorithms for locomotor event detection and quantification, as well as additional
investigations to assess the impact of sampling rates on GPS accuracy.
6. ConclusionsSports 2018, 6, 16 9 of 11
This research also illustrates the varied MP demands that result from unlimited substitutions
in women’s college soccer. Practitioners responsible for the development of women’s college soccer
athletes should consider that the demands of women’s college soccer may differ dramatically from
women’s soccer that follows international rules; this is largely due to the fact that collegiate soccer
allows for unlimited substitutions, while professional and national team soccer only permit three
substitutions per match. Considering the substitution rules of women’s college soccer, practitioners
should quantify the MP demands of their specific team and athletes in order to design practices and
conditioning activities that suit the strategies employed by the sport coach.
Future research should assess whether Impulse Load and its locomotor components (e.g.,
stepping events) are related to variables acquired by GPS, such as distance in speed zones. Additionally,
Impulse Load should be used to quantify the Training Loads for individual soccer drills and other
practice elements. Practitioners would also benefit from research that develops non-proprietary
algorithms for locomotor event detection and quantification, as well as additional investigations to
assess the impact of sampling rates on GPS accuracy.
6. Conclusions
This study was the first to quantify the seasonal demands of women’s college soccer using
sRPE, GPS, and Impulse Load, an accelerometry-derived Training Load that includes only locomotor
activities. Large variations in total distance, distance in speed zones, Impulse Load, and sRPE were
found during MP; this was largely due to the number of substitutions. However, consistent with
previous investigations, a relatively small portion of total distance consists of HSR and sprinting.
This study has also detailed the relationship between Impulse Load, total distance, and sRPE. Due to
the nearly perfect relationship between Impulse Load and total distance, Impulse Load may be used
as a proxy for total distance.
Author Contributions: J.A.G. and C.L.C. conceived and designed the experiments, analyzed data, and wrote the
paper; M.M.B., J.M.M., and M.T.M. performed most of the data collection and assisted with writing and editing
the paper. All authors have read and approved the final version of the manuscript and agree with the order of
presentation of the authors.
Conflicts of Interest: The authors declare no conflict of interest.
References
1. Krustrup, P.; Mohr, M.; Ellingsgaard, H.; Bangsbo, J. Physical demands during an elite female soccer game:
Importance of training status. Med. Sci. Sports Exerc. 2005, 37, 1242–1248. [CrossRef] [PubMed]
2. Haugen, T.A.; Tønnessen, E.; Hem, E.; Leirstein, S.; Seiler, S. VO2 max Characteristics of Elite Female Soccer
Players, 1989–2007. Int. J. Sports Physiol. Perform. 2014, 9, 515–521. [CrossRef] [PubMed]
3. Stølen, T.; Chamari, K.; Castagna, C.; Wisløff, U. Physiology of Soccer. Sports Med. 2005, 35, 501–536.
[CrossRef] [PubMed]
4. Vescovi, J.D. Sprint profile of professional female soccer players during competitive matches: Female Athletes
in Motion (FAiM) study. J. Sports Sci. 2012, 30, 1259–1265. [CrossRef] [PubMed]
5. Bradley, P.S.; Vescovi, J.D. Velocity thresholds for women’s soccer matches: Sex specificity dictates high-speed
running and sprinting thresholds—Female Athletes in Motion (FAiM). Int. J. Sports Physiol. Perform. 2015, 10,
112–116. [CrossRef] [PubMed]
6. Bradley, P.S.; Dellal, A.; Mohr, M.; Castellano, J.; Wilkie, A. Gender differences in match performance
characteristics of soccer players competing in the UEFA Champions League. Hum. Mov. Sci. 2014, 33, 159–171.
[CrossRef] [PubMed]
7. Dwyer, D.B.; Gabbett, T.J. Global positioning system data analysis: Velocity ranges and a new definition of
sprinting for field sport athletes. J. Strength Cond. Res. 2012, 26, 818–824. [CrossRef] [PubMed]
8. Cummins, C.; Orr, R.; O’Connor, H.; West, C. Global positioning systems (GPS) and microtechnology sensors
in team sports: A systematic review. Sports Med. 2013, 43, 1025–1042. [CrossRef] [PubMed]Sports 2018, 6, 16 10 of 11
9. Niźnikowski, T.; Sadowski, J.; Starosta, W. Coordination Abilities in Physical Education, Sports and Rehabilitation;
Józef Piłsudski University of Physical Education, Warsaw, Faculty of Physical Education and Sport, Cop.:
Biała Podlaska, Poland, 2016.
10. Duncan, S.; Stewart, T.I.; Oliver, M.; Mavoa, S.; MacRae, D.; Badland, H.M.; Duncan, M.J. Portable global
positioning system receivers: Static validity and environmental conditions. Am. J. Prev. Med. 2013, 44,
e19–e29. [CrossRef] [PubMed]
11. Castellano, J.; Casamichana, D.; Calleja-González, J.; Román, J.S.; Ostojic, S.M. Reliability and Accuracy of
10 Hz GPS Devices for Short-Distance Exercise. J. Sports Sci. Med. 2011, 10, 233–234. [PubMed]
12. Beato, M.; Bartolini, D.; Ghia, G.; Zamparo, P. Accuracy of a 10 Hz GPS Unit in Measuring Shuttle Velocity
Performed at Different Speeds and Distances (5–20 M). J. Hum. Kinet. 2016, 54, 15–22. [CrossRef] [PubMed]
13. Rampinini, E.; Alberti, G.; Fiorenza, M.; Riggio, M.; Sassi, R.; Borges, T.O.; Coutts, A.J. Accuracy of GPS
devices for measuring high-intensity running in field-based team sports. Int. J. Sports Med. 2015, 36, 49–53.
[CrossRef] [PubMed]
14. Malone, J.J.; Lovell, R.; Varley, M.C.; Coutts, A.J. Unpacking the Black Box: Applications and Considerations
for Using GPS Devices in Sport. Int. J. Sports Physiol. Perform. 2016, 1–30. [CrossRef] [PubMed]
15. Vickery, W.M.; Dascombe, B.J.; Baker, J.D.; Higham, D.G.; Spratford, W.A.; Duffield, R. Accuracy and
reliability of GPS devices for measurement of sports-specific movement patterns related to cricket, tennis,
and field-based team sports. J. Strength Cond. Res. 2014, 28, 1697–1705. [CrossRef] [PubMed]
16. Coutts, A.J.; Duffield, R. Validity and reliability of GPS devices for measuring movement demands of team
sports. J. Sci. Med. Sport 2010, 13, 133–135. [CrossRef] [PubMed]
17. Varley, M.C.; Fairweather, I.H.; Aughey, R.J. Validity and reliability of GPS for measuring instantaneous
velocity during acceleration, deceleration, and constant motion. J. Sports Sci. 2012, 30, 121–127. [CrossRef]
[PubMed]
18. Scott, B.R.; Lockie, R.G.; Knight, T.J.; Clark, A.C.; Janse de Jonge, X.A.K. A comparison of methods to quantify
the in-season training load of professional soccer players. Int. J. Sports Physiol. Perform. 2013, 8, 195–202.
[CrossRef] [PubMed]
19. Colby, M.J.; Dawson, B.; Heasman, J.; Rogalski, B.; Gabbett, T.J. Accelerometer and GPS-derived running
loads and injury risk in elite Australian footballers. J. Strength Cond. Res. 2014, 28, 2244–2252. [CrossRef]
[PubMed]
20. Gescheit, D.T.; Cormack, S.J.; Reid, M.; Duffield, R. Consecutive days of prolonged tennis match play:
Performance, physical, and perceptual responses in trained players. Int. J. Sports Physiol. Perform. 2015, 10,
913–920. [CrossRef] [PubMed]
21. Polglaze, T.; Dawson, B.; Hiscock, D.J.; Peeling, P. A Comparative Analysis of Accelerometer and
Time—Motion Data in Elite Men’s Hockey Training and Competition. Int. J. Sports Physiol. Perform.
2015, 10, 446–451. [CrossRef] [PubMed]
22. Cardinale, M.; Varley, M.C. Wearable Training-Monitoring Technology: Applications, Challenges,
and Opportunities. Int. J. Sports Physiol. Perform. 2017, 12, S255–S262. [CrossRef] [PubMed]
23. Buchheit, M.; Simpson, B.M. Player-Tracking Technology: Half-Full or Half-Empty Glass? Int. J. Sports
Physiol. Perform. 2017, 12, S235–S241. [CrossRef] [PubMed]
24. Vanrenterghem, J.; Nedergaard, N.J.; Robinson, M.A.; Drust, B. Training Load Monitoring in Team Sports:
A Novel Framework Separating Physiological and Biomechanical Load-Adaptation Pathways. Sports Med.
2017. [CrossRef] [PubMed]
25. Chambers, R.; Gabbett, T.J.; Cole, M.H.; Beard, A. The Use of Wearable Microsensors to Quantify
Sport-Specific Movements. Sports Med. 2015, 45, 1065–1081. [CrossRef] [PubMed]
26. Johnstone, J.A.; Ford, P.A.; Hughes, G.; Watson, T.; Garrett, A.T. Others BioHarness multivariable monitoring
device. Part I: Validity. J. Sports Sci. Med. 2012, 11, 400–408. [PubMed]
27. Johnstone, J.A.; Ford, P.A.; Hughes, G.; Watson, T.; Garrett, A.T. Bioharness(TM ) Multivariable Monitoring
Device: Part. II: Reliability. J. Sports Sci. Med. 2012, 11, 409–417. [PubMed]
28. Johnstone, J.A.; Ford, P.A.; Hughes, G.; Watson, T.; Mitchell, A.C.S.; Garrett, A.T. Field based reliability and
validity of the bioharness™ multivariable monitoring device. J. Sports Sci. Med. 2012, 11, 643–652. [PubMed]
29. Rice, G.M.; VanBrunt, T.B.; Snider, D.H.; Hoyt, R.E. Wearable Accelerometers in High Performance Jet
Aircraft. Aerosp. Med. Hum. Perform. 2016, 87, 102–107. [CrossRef] [PubMed]Sports 2018, 6, 16 11 of 11
30. Wu, J.; Jiang, C.; Liu, Z.; Houston, D.; Jaimes, G.; McConnell, R. Performances of different global positioning
system devices for time-location tracking in air pollution epidemiological studies. Environ. Health Insights
2010, 4, 93–108. [CrossRef] [PubMed]
31. Alonso, L.; Silva, L.; Paulucio, D.; Pompeu, F.; Bezerra, L.; Lima, V.; Vale, R.; Oliveira, M.; Dantas, P.; Silva, J.;
et al. Field Tests vs. Post Game GPS Data in Young Soccer Player Team. J. Exerc. Physiol. Online 2017, 20.
32. OmniSense Analysis Help; Zephyr Technology. 2016. Available online: https://www.zephyranywhere.com/
media/download/omnisense-analysis-help-20-apr-2016.pdf (accessed on 21 February 2018).
33. Foster, C.; Florhaug, J.A.; Franklin, J.; Gottschall, L.; Hrovatin, L.A.; Parker, S.; Doleshal, P.; Dodge, C. A new
approach to monitoring exercise training. J. Strength Cond. Res. 2001, 15, 109–115. [PubMed]
34. Hopkins, W.G. A Scale of Magnitudes for Effect Statistics. Available online: http://sportsci.org/resource/
stats/effectmag.html (accessed on 9 February 2018).
35. Vescovi, J.D.; Favero, T.G. Motion characteristics of women’s college soccer matches: Female Athletes in
Motion (FAiM) study. Int. J. Sports Physiol. Perform. 2014, 9, 405–414. [CrossRef] [PubMed]
36. Mohr, M.; Krustrup, P.; Bangsbo, J. Fatigue in soccer: A brief review. J. Sports Sci. 2005, 23, 593–599.
[CrossRef] [PubMed]
37. Bartlett, J.D.; O’Connor, F.; Pitchford, N.; Torres-Ronda, L.; Robertson, S.J. Relationships Between Internal
and External Training Load in Team-Sport Athletes: Evidence for an Individualized Approach. Int. J. Sports
Physiol. Perform. 2017, 12, 230–234. [CrossRef] [PubMed]
38. Gaudino, P.; Iaia, F.M.; Strudwick, A.J.; Hawkins, R.D.; Alberti, G.; Atkinson, G.; Gregson, W.
Factors influencing perception of effort (session rating of perceived exertion) during elite soccer training.
Int. J. Sports Physiol. Perform. 2015, 10, 860–864. [CrossRef] [PubMed]
39. Lovell, T.W.J.; Sirotic, A.C.; Impellizzeri, F.M.; Coutts, A.J. Factors affecting perception of effort (session
rating of perceived exertion) during rugby league training. Int. J. Sports Physiol. Perform. 2013, 8, 62–69.
[CrossRef] [PubMed]
40. Scott, T.J.; Black, C.R.; Quinn, J.; Coutts, A.J. Validity and reliability of the session-RPE method for quantifying
training in Australian football: A comparison of the CR10 and CR100 scales. J. Strength Cond. Res. 2013, 27,
270–276. [CrossRef] [PubMed]
41. Casamichana, D.; Castellano, J.; Calleja-Gonzalez, J.; San Román, J.; Castagna, C. Relationship between
indicators of training load in soccer players. J. Strength Cond. Res. 2013, 27, 369–374. [CrossRef] [PubMed]
42. Barrett, S.; Midgley, A.W.; Towlson, C.; Garrett, A.; Portas, M.; Lovell, R. Within-Match PlayerLoad™ Patterns
During a Simulated Soccer Match: Potential Implications for Unit Positioning and Fatigue Management.
Int. J. Sports Physiol. Perform. 2016, 11, 135–140. [CrossRef] [PubMed]
© 2018 by the authors. Licensee MDPI, Basel, Switzerland. This article is an open access
article distributed under the terms and conditions of the Creative Commons Attribution
(CC BY) license (http://creativecommons.org/licenses/by/4.0/).You can also read