Sustainable Development Goals, Wellbeing indicators, Women and SDGs
←
→
Page content transcription
If your browser does not render page correctly, please read the page content below
Sustainable Development Goals,
                  Wellbeing indicators,
                   Women and SDGs

                       Fabiola Riccardini
                  Italian Statistical Institute
(le slide vengono diffuse e rese disponibili per fini didattici, sono il frutto di
        una serie di lezioni e sono soggette alla citazione dell’autore)
Table of content

•   Sustainable Development Goals
•   BES project, UrBES, BESProvince
•   Sustainability, inequality
•   Measures, indicators
•   Women and SDGs
•   Conclusions and references

Sustainable Development: some international frameworks
    1.Rio ‘92 and Brundtland Commission
    2.MDGs
    3.Rio+20 in 2012 Sustainable Development Goals
    4.Eurostat SDIs- Europe2020
    5.World Bank ANS + Inclusive Wealth Index
    6.Sitiglitz-Sen-Fitoussi Report
    7.EU-Sponsorship group
    8.UNECE-CES-Task Force UNECE/OECD/Eurostat
    9.OECD-Green growth, OECD–How is life?, OECD Better
      life index
    10.Inclusive Wealth Index
    11.Other measures (HDI, SSI, CSI, EVI) and Composite
      Indicators (GPI etc…)
    12.Countries Experiences
Limits of Growth Club of Rome Society aging and population dynamic Education increases Climate changes Scarcity of natural resources Different times and ways of technology adoption Increasing complex interconnections across countries Reviewing the concept of growth (variations of GDP) towards sustainability and measures of progress
Stiglitz-Sen-Fitoussi Report
Distinction between current wellbeing and sustainability
assessment

Recommendations :
- The assessment of sustainability requires a dashboard of
indicators.
- Interpretable as variations of "stock" of existing
capital.
- A monetary index only the economic aspects of
sustainability
- Current well-being and sustainability can not be
represented by the same indicators.
Definitions European Sustainable Development Strategy (2006), Europe 2020 «GDP and beyond» Communication from the European Commission (2009) "Goal-oriented European sustainable development, in order to improve the quality of life and well-being on Earth for present and future generations" “The future we want” (2012) Conference of RIO+20 and Post 2015 Par. 3 mainstreaming “sustainable development at all levels, integrating economic, social and environmental aspects and recognizing their interlinkages, so as to achieve sustainable development in all its dimensions” Par. 38 “need for broader measures of progress to complement gross domestic product in order to better inform policy decisions” requesting “the United Nations Statistical Commission […] to launch a programme of work in this area building on existing initiatives”. Main point: Human well-being is the ultimate goal of sustainable development (United Nations 2013)
Definitions World Social Science Report 2013, UNESCO-OECD “The capacity of a socio-ecological system to be maintained in conditions that allow for its continued functioning in perpetuity. In development and global environmental change contexts, it refers more specifically to the ability to maintain human wellbeing, social equity and environmental quality indefinitely, meeting current needs and desires while ensuring that future generations will still have coupled human environment systems available to them capable of providing goods and services for their needs and desires, without degrading these systems in the long term” «Sostenibilità in pillole» di G. Bologna 2013 « sostenibilità significa imparare a vivere in una prosperità equa e condivisa con tutti gli essere umani, entro i limiti fisici e biologici dell’unico pianeta che abitiamo: la Terra…la sostenibilità si occupa proprio della conoscenza delle interrelazioni tra i sistemi naturali e i sistemi sociali, delle loro dinamiche e del loro sviluppo, e cerca di capire come governarle nel miglior modo possibile per garantire loro un’evoluzione dinamica e armonica, che non comprometta le basi della sopravvivenza dei nostri sistemi sociali»
MDGs
The United Nations in the new millennium have tried to give valid objectives
for the whole world, making them measurable
8 goals to be achieved by 2015:
Overcoming extreme poverty and hunger,
Achieve universal primary education,
Promote gender equality and empower women,
Reduce child mortality,
Improve maternal health,
Fighting the 'HIV and other diseases,
Ensure environmental sustainability,
Develop a global partnership for development.
The objectives are measured by 60 indicators. The Millennium Development
Goals, however, have been designed especially for developing countries
without a share location and set without having first identified the indicatorsTransforming our world: the 2030 Agenda for Sustainable Development The Goals and targets will stimulate action over the next fifteen years in areas of critical importance for humanity and the planet: • People We are determined to end poverty and hunger, in all their forms and dimensions, and to ensure that all human beings can fulfil their potential in dignity and equality and in a healthy environment. • Planet We are determined to protect the planet from degradation, including through sustainable consumption and production, sustainably managing its natural resources and taking urgent action on climate change, so that it can support the needs of the present and future generations. • Prosperity We are determined to ensure that all human beings can enjoy prosperous and fulfilling lives and that economic, social and technological progress occurs in harmony with nature. • Peace We are determined to foster peaceful, just and inclusive societies which are free from fear and violence. There can be no sustainable development without peace and no peace without sustainable development. • Partnership We are determined to mobilize the means required to implement this Agenda through a revitalised Global Partnership for Sustainable Development, based on a spirit of strengthened global solidarity, focused in particular on the needs of the poorest and most vulnerable and with the participation of all countries, all stakeholders and all people. The interlinkages and integrated nature of the Sustainable Development Goals are of crucial importance in ensuring that the purpose of the new Agenda is realised. If we realize our ambitions across the full extent of the Agenda, the lives of all will be profoundly improved and our world will be transformed for the better.
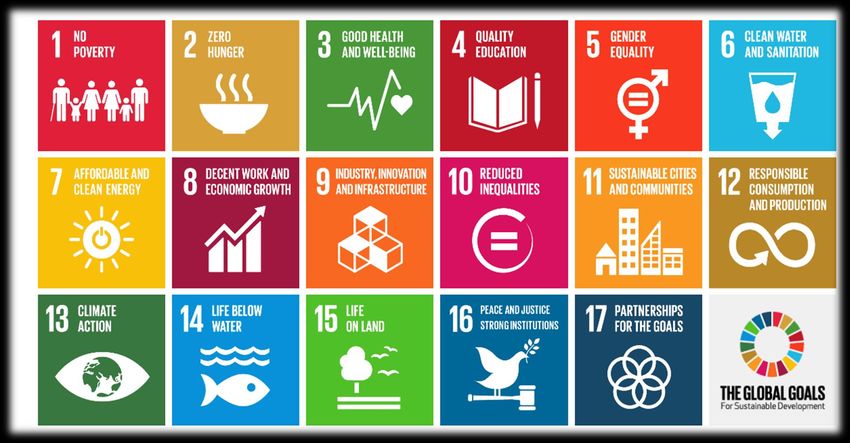
Sustainable Development Goals
SDG’S – 17 GOALS – 170 Targets

Goal 1    End poverty in all its forms everywhere
Goal 2    End hunger, achieve food security and improved nutrition and promote sustainable agriculture
Goal 3    Ensure healthy lives and promote well-being for all at all ages
Goal 4    Ensure inclusive and equitable quality education and promote lifelong learning opportunities for all
Goal 5    Achieve gender equality and empower all women and girls
Goal 6    Ensure availability and sustainable management of water and sanitation for all
Goal 7    Ensure access to affordable, reliable, sustainable and modern energy for all
Goal 8    Promote sustained, inclusive and sustainable economic growth, full and productive employment and decent work for all
Goal 9    Build resilient infrastructure, promote inclusive and sustainable industrialization and foster innovation
Goal 10   Reduce inequality within and among countries
Goal 11   Make cities and human settlements inclusive, safe, resilient and sustainable
Goal 12   Ensure sustainable consumption and production patterns
Goal 13   Take urgent action to combat climate change and its impacts*
Goal 14   Conserve and sustainably use the oceans, seas and marine resources for sustainable development
Goal 15   Protect, restore and promote sustainable use of terrestrial ecosystems, sustainably manage forests, combat desertification, and
          halt and reverse land degradation and halt biodiversity loss
Goal 16   Promote peaceful and inclusive societies for sustainable development, provide access to justice for all and build effective,
          accountable and inclusive institutions at all levels
Goal 17   Strengthen the means of implementation and revitalize the global partnership for sustainable development
SDG’S – Global Set of Indicators: 230 Indicators
Goal 1 Poverty: 7 targets, 9 indicators, of which 3 grey Senday Framework (for 1.5.1indicator)
Goal 2 Hunger: 8 target, 15 indicators, of which 8 grey Environment (indicators 2.4.1, 2.4.3, 2.5.2)
Goal 3 Healthy lives: 13 targets , 25 indicators, of which 3 grey Environment (for 3.9.1, 3.9.2 indicators)
Goal 4 Education: 10 targets, 11 indicators, of which 1 grey Environment (indicators 4.7.1, 4.a.1
Goal 5 Gender equality: 9 targets, 14 indicators
Goal 6 Water: 8 targets, 10 indicators, of which 3 grey
Goal 7 Energy: 5 targets, 6 indicators, of which 1 grey
Goal 8 Inclusive and sustainable economic growth, employment: 12 targets, 15 indicators, of which 3 grey
Goal 9 Sustainable industrialization, innovation: 8 targets, 12 indicators COP21 (business)
Goal 10 Inequality: 10 targets, 12 indicators, of which 3 grey
Goal 11 Cities: 10 targets, 13 indicators, of which 7 grey COP21, Senday and Hyogo Framework for Action on Disasters Risk
Reduction
Goal 12 Sustainable consumption and production: 11 targets, 12 indicators, of which 5 grey Environment for business
Goal 13 Climate change: 5 targets, 5 indicators, of which 4 grey COP21
Goal 14 Oceans, seas and marine resources: 10 targets, 10 indicators, of which 7 grey
Goal 15
Ecosystems, forests, desertification, biodiversity loss: 12 targets, 15 indicators, of which 10 grey
Goal 16
Peaceful and inclusive societies, justice, accountable inclusive institutions: 12 targets, 21 indicators, of which 10 grey
Goal 17 Means of implementation: 19 targets, 24 indicators, of which 11 grey Environment (target 17.9, 17.7, 17.5, 17.14)Ruolo Istituti Nazionali di Statistica
SDG’s
17 Goals
169 Targets
circa 240 Indicatori, di cui circa 70 Indicatori grigi
Coordinamento:
UNSD : Global Indicators
INS UNECE: Regional Indicators
National-Sub National : National IndicatorsPerché le misure sono rilevanti • Necessità umana attuale di misurare la sostenibilità per verificare se l’uomo potrà continuare a vivere su questo pianeta • Le misure del benessere delle persone diventano centrali • Ciò che si misura non è neutrale e determina poi dove concentrare le politiche
Grafico 1.1 - Trend Popolazione mondiale: scenari in base a 3 previsioni di
                                 fertilità

                                        18
                                                                                                          16,6 miliardi
                                        16
     Popolazione mondiale in miliardi

                                        14

                                        12
                                                                                           10,8miliardi   11,2 miliardi
                                        10                                                 9,7miliardi

                                        8                                                  8,7 miliardi
                                                                                                          7 ,3 miliardi
                                                                              7 miliardi
                                        6

                                                                                                                  Medium variant
                                        4
                                                 3 miliardi                                                       High variant
                                        2
                                                                                                                  Low variant
                                             1955
                                             1960

                                             1975
                                             1980

                                             1995
                                             2000

                                             2015
                                             2020

                                             2035
                                             2040

                                             2055
                                             2060

                                             2075
                                             2080

                                             2095
                                             2100
                                             1950

                                             1965
                                             1970

                                             1985
                                             1990

                                             2005
                                             2010

                                             2025
                                             2030

                                             2045
                                             2050

                                             2065
                                             2070

                                             2085
                                             2090
                             Elaborazioni da dati UNPD - World Population Prospects 2015
Grafico 1.2 - Trend della popolazione distinta in Paesi meno sviluppati (LD) e Paesi
più sviluppati (MD): scenari in base a 3 previsioni di fertilità
16
14,7
miliardi
14 LD High
variant
Popolazione in miliardi
12
LD Medium
variant
10 10 miliardi
LD Low
8 variant
6,5 miliardi
6 MD High
variant
4 MD Medium
variant
2 miliardi 1,9miliardi
2
812 milioni 1,3 miliardi MD Low
842 milioni variant
0
1950
1960
1965
1975
1980
1990
2005
2020
2030
2035
2045
2050
2060
2065
2075
2080
2090
1955
1970
1985
1995
2000
2010
2015
2025
2040
2055
2070
2085
2095
2100
Elaborazioni da dati UNPD - World Population Prospects 2015Grafico 2.1 Popolazione per fasce età - 1950 - 2015 - regioni sviluppate
2015
2010
2000
1990 65+
30-64
1980 15-29
0-14
1970
1960
1950
milioni
0 100 200 300 400 500 600
Elaborazioni da dati UNPD - World Population Prospects 2015Grafico 2.2 Popolazione per fasce età - 1950 - 2015 regioni meno sviluppate
2015
2010
2000
65+
1990
30-64
1980 15-29
0-14
1970
1960
1950
milioni
0 500 1000 1500 2000 2500Grafico 3.1 e 3.2 - Popolazione Urbana 1950-2050 (valori assoluti e valori
percentuali)
7 90
Popolazione urbana (valori percentuali)
6,3 miliardi
6 80
Popolazione Urbana (miliardi)
5,2 miliardi
5 70
66%
60
4
3,5 miliardi
50
3
2,6 miliardi 40
2
30
1
1 miliardo 20
0
10
1950
1955
1960
1970
1975
1980
1985
1990
1995
2005
2010
2020
2025
2030
2035
2040
2045
1965
2000
2015
2050
1950
1958
1962
1966
1974
1978
1982
1994
1998
2010
2014
2018
2026
2030
2034
2046
2050
1954
1970
1986
1990
2002
2006
2022
2038
2042
MONDO Regioni più sviluppate Regioni meno sviluppate MONDO Regioni più sviluppate Regioni meno sviluppate
Elaborazioni da dati UNPD - World Population Prospects 2015 Elaborazioni da dati UNPD - World Population Prospects 2015Popolazione migrante (milioni)
0
5
10
15
20
-20
-15
-10
-5
1950-1955
1955-1960
1960-1965
1965-1970
1970-1975
1975-1980
1980-1985
1985-1990
1990-1995
1995-2000
2000-2005
2005-2010
2010-2015
16
2015-2020
2020-2025
2025-2030
2030-2035
2035-2040
2040-2045
2045-2050
2050-2055
2055-2060
2060-2065
2065-2070
2070-2075
2075-2080
2080-2085
2085-2090
2090-2095
2095-2100
meno
Regioni
sviluppate
sviluppate
Regioni più
Net migration rate (per 1000 population)
0,0
0,5
1,0
1,5
2,0
2,5
3,0
-1,0
-0,5
1950-1955
1955-1960
1960-1965
1965-1970
1970-1975
1975-1980
1980-1985
1985-1990
1990-1995
1995-2000
2000-2005
2005-2010
2010-2015
2015-2020
2020-2025
2025-2030
2030-2035
2035-2040
2040-2045
2045-2050
2050-2055
2055-2060
2060-2065
2065-2070
2070-2075
2075-2080
2080-2085
2085-2090
2090-2095
Grafici 4.1 e 4.2 Migrazioni 1950-2050 - Valori assoluti e tasso netto
2095-2100
meno
Regioni
sviluppate
sviluppate
Regioni piùMega cities
Città con popolazione superiore
ai 10 milioni di abitanti (2010-dati in milioni)
40
35
30
A
b
25
i
t 20
a
n 15
t
i 10
5
0
Tokio Nuova San Paolo Mumbai Città del New York Shanghai Kolkata Dhaka Karachi
Delhi del Brasile Messico
Fonte: UNPD Città
Fonte: World FactBook - CIA - Central Intelligence Agency -Rural Population by Major Areas
Rural Population by Major Areas, 1950-2050 (thousands)
4000000
P
o 3500000
p
o 3000000
l
a 2500000
z
2000000
i
o
1500000
n
e
1000000
500000
0
1950 1960 1970 1980 1990 2000 2010 2020 2030 2040 2050
Anni
Major area, region, country or area World
More developed regions Less developed regions
Least developed countries Less developed regions, excluding least developed countries
Less developed regions, excluding China
Fonte: United Nations, DESA, Population Division (2012): The 2011 RevisionGrafico 5.1 e 5.2 Prodotto interno lordo a parità di potere di acquisto (miliardi di dollari
USA) e variazioni percentuali
100000 15 15,2
90000
MONDO
80000 World
PIL (miliardi di dollari USA)
Economie 10
70000
PIL (variazioni percentuali)
avanzate
Advanced
60000 economies
Mercati
emergenti
50000 Emerging
market
Africa Sub- 5
40000 Sahariana
Sub-Saharan
Africa
30000 Cina
China
20000
India 0
10000 India
0
-3,4
-5Grafico 5.2.2 Prodotto interno lordo a parità di potere di acquisto 2013-2020
(miliardi di dollari USA)
PIL (miliardi di dollari USA)
160000
140000
120000
100000
MONDO
80000
60000
40000 Economie avanzate
20000
2013
2014
2015
2016
BRIICS
2017
2018
2019
2020
Elaborazioni da dati IMF Economic Outlook Database, April 2015Grafico 9.1 - Volume di scambi a livello mondiale (variazioni percentuali)
13
Scambi di beni e servizi (variazioni percentuali)
8
3
-2
-7
-12
2000 2001 2002 2003 2004 2005 2006 2007 2008 2009 2010 2011 2012 2013 2014 2015 2016 2017 2018 2019
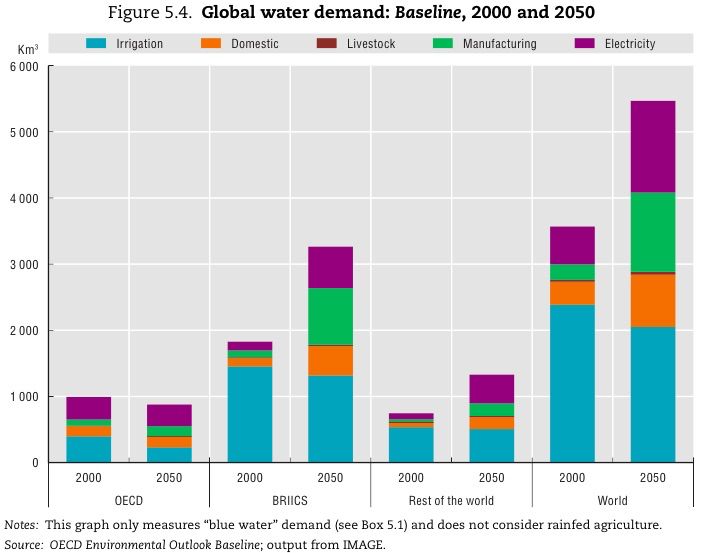
Elaborazioni da: International Monetary Fund, World Economic Outlook Database, April 2014Energy and water In this context of demographic pressure the demand of natural resources is supposed to grow exponentially and accordingly the competition among these is expected to burden. According to the OECD Environmental outlook
Sustainability key concepts

Uncertainty                    Insecurity

Complexity                    More disciplines

Dynamic                           Time

Global-Local                   Space

Interlikages          Sustain with cross effects
Key Concepts

also from:

United Nations 2012: art.38 of Rio+20 Report: Human
well-being is the ultimate goal of sustainable development

BES (benessere equo e sostenibile) : there is
progress of well-being when it is equitable and
sustainable over time

Sustainable wellbeing when it can be maintained or
improved for present and future generations over time and
space
BES - Overview

• Project to measure equitable and sustainable well-being born
  of a joint initiative of Cnel and Istat
• Part of the international debate on "Gdp and beyond“
• The central idea is that economic parameters alone are
  inadequate to evaluate the progress of societies and should be
  complemented by social and environmental information and
  by measures of inequality and sustainability
• 12 domains of wellbeing
• Annual Reports 2013, 2014 and 2015...
• Website: http://www.misuredelbenessere.it/
BES – Wellbeing domains

                 The individual sphere

                     The context
From the National Bes to the local UrBes – an Overview • Beginning of 2012 Municipalities (metropolitan cities) were involved in the Bes project with the aim to provide a picture of the local wellbeing over the period 2004- 2012 and according to the Bes theoretical framework • The UrBes report is based on a subset of the Bes indicators available at municipal and provincial level. This subset is composed by 25 indicators and covers 10 domains (http://www.istat.it/it/files/2013/06/Urbes_2013.pdf) • In addition to the Urbes project another report has been produced focused on the provincial level (http://www.besdelleprovince.it/index.php?id=26833)
BES – What: Conceptual framework
• Rapporto BES 2015
2014: anno di transizione importante
115

110

105

100

                                                      Occupazione

 95

 90

 85
        2010        2011        2012         2013   2014
Sustainability and Equality: key concepts The increase in inequality leads to an increase of risk factors for certain social groups or society as a whole. Equality and Equity • Empirical evidence: some global imbalances arising from inequalities. Equity bring to social stability (broader agreement in society) and economic growth (better democracy, better education, better technology, better infrastructure, better financial reforms for control) Income inequality Gender inequality Inequality on opportunities Human rights inequality Inequality among territories Social inequality ….
Focus
Women and SDGs
Donne e SDGs:
Goal 5. Achieve gender equality and empower all women and girls
ANNEX 3. MAPPING BETWEEN SDGs TARGETS AND THE CES THEMES
Themes (X = primary match / ∆ = secondary match) Dimensions
TH2. Income
TH8. Leisure
TH13. Climate
settlements
TH18 - Physical capital
TH19. Research, development
TH20. Financial capital
TH10. Ecosystems
TH17. Institutions
TH1. Subjective well-being
TH4. Health
TH5. Labour
TH6. Education
TH9. Safety
TH14. Energy resources
TH15. Mineral resources
TH21. Production
TH7. Cities and human
TH12. Air quality
and innovation
TH3. Food and nutrition
TH11. Water and sanitation
TH16. Trust and social relations
Here and now
Elsewhere
Later
Target and description
5.1 End all forms of discrimination against all women and girls
everywhere. ∆ ∆ ∆ ∆ ∆ x ∆ x
5.2 Eliminate all forms of violence against all women and girls in the
public and private spheres, including trafficking and sexual and other x ∆ ∆ x
types of exploitation.
5.3 Eliminate all harmful practices, such as child, early and forced
marriage and female genital mutilation. x ∆ x
5.4 Recognize and value unpaid care and domestic work through the
provision of public services, infrastructure and social protection policies
and the promotion of shared responsibility within the household and x ∆ ∆ ∆ x
the family as nationally appropriate.
5.5 Ensure women's full and effective participation and equal
opportunities for leadership at all levels of decision-making in political, x x
economic and public life.
5.6 Ensure universal access to sexual and reproductive health and
reproductive rights as agreed in accordance with the Programme of
Action of the International Conference on Population and Development x x x
and the Beijing Platform for Action and the outcome documents of
their review conferences.
5.a Undertake reforms to give women equal rights to economic
resources, as well as access to ownership and control over land and
other forms of property, financial services, inheritance and natural ∆ x ∆ ∆ ∆ x
resources, in accordance with national laws.
5.b Enhance the use of enabling technology, in particular
information and communications technology, to promote the x ∆ x
empowerment of women.
5.c Adopt and strengthen sound policies and enforceable legislation
for the promotion of gender equality and the empowerment of all x x
women and girls at all levels.Lavoro/Donne/SDGs. Goal 8. Promote sustained, inclusive and sustainable economic
growth, full and productive employment and decent work for all
ANNEX 3. MAPPING BETWEEN SDGs TARGETS AND THE CES THEMES
Themes (X = primary match / ∆ = secondary match) Dimensions
TH2. Income
TH8. Leisure
TH13. Climate
TH18 - Physical capital
TH20. Financial capital
TH10. Ecosystems
TH17. Institutions
TH1. Subjective well-being
TH4. Health
TH5. Labour
TH6. Education
innovation
TH9. Safety
TH14. Energy resources
TH15. Mineral resources
TH21. Production
TH12. Air quality
TH3. Food and nutrition
TH7. Cities and human settlements
TH11. Water and sanitation
TH16. Trust and social relations
TH19. Research, development and
Here and now
Elsewhere
Later
Target and description
8.1 Sustain per capita economic growth in accordance with national circumstances and,
in particular, at least 7 per cent gross domestic product growth per annum in the least
developed countries. x x
8.2 Achieve higher levels of economic productivity through diversification, technological
upgrading and innovation, including through a focus on high-value-added and labour- ∆ x x x
intensive sectors.
8.3 Promote development-oriented policies that support productive activities, decent
job creation, entrepreneurship, creativity and innovation, and encourage the formalization
and growth of micro-, small- and medium-sized enterprises, including through access to ∆ ∆ ∆ x x
financial services.
8.4 Improve progressively, through 2030, global resource efficiency in consumption and
production and endeavour to decouple economic growth from environmental degradation,
in accordance with the 10-year framework of programmes on sustainable consumption and ∆ ∆ x x x
production, with developed countries taking the lead.
8.5 By 2030, achieve full and productive employment and decent work for all women
and men, including for young people and persons with disabilities, and equal pay for work ∆ x x
of equal value.
8.6 By 2020, substantially reduce the proportion of youth not in employment,
education or training. x ∆ x
8.7 Take immediate and effective measures to eradicate forced labour, end modern
slavery and human trafficking and secure the prohibition and elimination of the worst
forms of child labour, including recruitment and use of child soldiers, and by 2025 end child x x
labour in all its forms.
8.8 Protect labour rights and promote safe and secure working environments for all
workers, including migrant workers, in particular women migrants, and those in precarious x x
employment.
8.9 By 2030, devise and implement policies to promote sustainable tourism that
creates jobs and promotes local culture and products. ∆ x x
8.10 Strengthen the capacity of domestic financial institutions to encourage and
expand access to banking, insurance and financial services for all. x ∆ ∆ x
8.a Increase Aid for Trade support for developing countries, in particular least
developed countries, including through the Enhanced Integrated Framework for Trade- x ∆ x
Related Technical Assistance to Least Developed Countries.
8.b By 2020, develop and operationalize a global strategy for youth employment and
implement the Global Jobs Pact of the International Labour Organization. x xIndicators of SDG 5 5.1.1 Whether or not legal frameworks are in place to promote, enforce and monitor equality and non-discrimination on the basis of sex 5.2.1 Proportion of ever-partnered women and girls aged 15 years and older subjected to physical, sexual or psychological violence by a current or former intimate partner in the previous 12 months, by form of violence and by age 5.2.2 Proportion of women and girls aged 15 years and older subjected to sexual violence by persons other than an intimate partner in the previous 12 months, by age and place of occurrence 5.3.1 Proportion of women aged 20-24 years who were married or in a union before age 15 and before age 18 5.3.2 Proportion of girls and women aged 15-49 years who have undergone female genital mutilation/cutting, by age 5.4.1 Proportion of time spent on unpaid domestic and care work, by sex, age and location 5.5.1 Proportion of seats held by women in national parliaments and local governments 5.5.2 Proportion of women in managerial positions 5.6.1 Proportion of women aged 15-49 years who make their own informed decisions regarding sexual relations, contraceptive use and reproductive health care 5.6.2 Number of countries with laws and regulations that guarantee women aged 15-49 years access to sexual and reproductive health care, information and education 5.a.1 (a) Proportion of total agricultural population with ownership or secure rights over agricultural land, by sex; and (b) share of women among owners or rights-bearers of agricultural land, by type of tenure 5.a.2 Proportion of countries where the legal framework (including customary law) guarantees women’s equal rights to land ownership and/or control 5.b.1 Proportion of individuals who own a mobile telephone, by sex 5.c.1 Proportion of countries with systems to track and make public allocations for gender equality and women’s empowerment
Indicators of SDG 8 and women

8.1.1 Annual growth rate of real GDP per capita

8.2.1 Annual growth rate of real GDP per employed person

8.3.1 Proportion of informal employment in non-agriculture employment, by sex

8.4.1 Material footprint, material footprint per capita, and material footprint per GDP

8.4.2   Domestic material consumption, domestic material consumption per capita, and domestic material consumption per GDP
8.5.1   Average hourly earnings of female and male employees, by occupation, age and persons with disabilities
8.5.2   Unemployment rate, by sex, age and persons with disabilities
8.6.1   Proportion of youth (aged 15-24 years) not in education, employment or training

8.7.1 Proportion and number of children aged 5-17 years engaged in child labour, by sex and age

8.8.1 Frequency rates of fatal and non-fatal occupational injuries, by sex and migrant status
8.8.2 Increase in national compliance of labour rights (freedom of association and collective bargaining) based on International Labour
Organization (ILO) textual sources and national legislation, by sex and migrant status
8.9.1 Tourism direct GDP as a proportion of total GDP and in growth rate
8.9.2 Number of jobs in tourism industries as a proportion of total jobs and growth rate of jobs, by sex
8.10.1 Number of commercial bank branches and automated teller machines (ATMs) per 100,000 adults
8.10.2 Proportion of adults (15 years and older) with an account at a bank or other financial institution or with a mobile-money-service
provider

8.a.1 Aid for Trade commitments and disbursements

8.b.1 Total government spending in social protection and employment programmes as a proportion of the national budgets and GDP
Grafico 6.1 - Tasso di attività mondiale per sesso e fasce di età

                                             85

                                              75
Tasso ci attività, valori percentuali

                                              65
                                                      66,3
                                                                                                                                                           GIOVANI
                                              55
                                                                                          63,4                                                             FEMMINE
                                              45
                                                     1990
                                                    1993
                                                   1996

                                                                                                                                                           TOTALE
                                                             1999

                                                                                                                                                           MONDO
                                                                    2002

                                                                                                                                           62,4
                                                                           2005
                                                                                  2008

                                                                                                                                                           ADULTI
                                                                                         2011
                                                                                                2014p

                                                                                                        2017p

                                                                                                                2020p                                      MASCHI

                                                                                                                        2023p

                                                                                                                                                 TOTALE…
                                                                                                                                2026p

                                                                                                                                                  MASCHI
                                                                                                                                        2029p
                                                                                                                                                GIOVANI
Grafico 6.2 - Tasso di occupazione mondiale per sesso e fasce di età
80
75
Tasso di occupazione- valori percentuali
70
65 GIOVANI
60 62,2
FEMMINE
55
50
TOTALE
45 59,6 MONDO
40
ADULTI
1991
1993
59,6
1995
1997
1999
MASCHI
2001
2003
2005
2007
2009
2011
2013p
2015p
2017pGrafico 6.3 - Tasso di disoccupazione mondiale per sesso e fasce di età
15
13
11
9
Tasso di disoccupazione
7 6,3
5
3 6,1
6,0
ADULTI MASCHI TOTALE FEMMINE GIOVANIDonne di 16-70 anni che hanno subito violenza fisica o sessuale negli
ultimi 5 anni (per 100 donne di 16-70 anni che hanno o hanno avuto
un partner)
7 6,6
6
4,9
5
4
3
2
1
0
2006 2014
Fonte: Istat, Indagine sulla Sicurezza delle donnePROVVISORIO Donne da 16 a 70 anni che hanno subito violenza
fisica o sessuale da partner o ex partner negli ultimi 5 anni (per 100
2,03 2,33 donne con le stesse caratteristiche)
Minacciata di essere colpita fisicamente
Colpita con un oggetto o tirato qualcosa
Spinta/afferrata/strattonata/storto un braccio/tirato capelli
0,52 Schiaffeggiata, presa a calci o pugni, morsa
0,04 Tentato di strangolarla, soffocarla, ustionarla
0,16
1,16 Usato o minacciato di usare una pistola o un coltello
0,38
Violenza fisica in modo diverso
0,45 Stupro
Tentato stupro
0,15
0,19 Violenza sessuale in modo diverso
0,18 Costretta a rapporti sessuali con altre persone
Rapporti sessuali degradanti o umilianti
Rapporti sessuali indesiderati vissuti come violenza
1,6
3,5 PROVVISORIO Fonte: Istat, indagine del 2006
1,6
2,3
Minacciata di essere colpita fisicamente
Colpita con un oggetto o tirato qualcosa
0,4 Spinta/afferrata/strattonata/storto un braccio/tirato capelli
0 Schiaffeggiata, presa a calci o pugni, morsa
0,3
Tentato di strangolarla, soffocarla, ustionarla
0,5 Usato o minacciato di usare una pistola o un coltello
Violenza fisica in modo diverso
0,1 1,1 Stupro
0,2
Tentato stupro
0,3 Violenza sessuale in modo diverso
Costretta a rapporti sessuali con altre persone
Rapporti sessuali degradanti o umilianti
Rapporti sessuali indesiderati vissuti come violenza
1,7
2,6 PROVVISORIO Fonte: Istat, indagine del 2014Donne di 16-70 anni che hanno subito violenza sessuale negli ultimi
5 anni (per 100 donne di 16-70 anni)
10
8,9
9
8
7 6,4
6
5
4
3
2
1
0
2006 2014
Fonte: Istat, Indagine sulla Sicurezza delle donneDonne e rappresentanza politica in Parlamento
35 30,7
30
25 20,3
20
15
10
5
0
2008 2014
Fonte: (2008) Ministero dell' Interno, (2014) elaborazioni Istat sui dati della Camera
dei Deputati e del Senato della Repubblica
Quota di donne elette nei Consigli Regionali (valori
percentuali)
20 18,0
16,0
15,1
15 12,9
10
5
0
2012 2013 2014 2015
Fonte: Singoli Consigli regionaliDirigenti femmine sul totale dirigenti (valori percentuali)
14,0
13,8
13,8
13,6 13,5
13,4
13,2 13,1
13,0
12,8
12,6
2012 2013 2014
Fonte: Istat, Registro Statistico Asia-occupazioneDonne negli organi decisionali (valori percentuali)
18
15,8
16
14
12,0
12
10,1
10
8
6
4
2
0
2013 2014 2015
Fonte: Istat, varie indaginiGrafico 45 Tasso di occupazione. Valori percentuali. Anni 2004-2014
80,0
75,0
70,0
65,0
60,0
55,0
50,0
45,0
40,0
2004 2005 2006 2007 2008 2009 2010 2011 2012 2013 2014
women men total Source Istat, BesGrafico 50 Tasso di occupazione femminile. Valori Percentuali. Anni 2004-2014
51
50,5
50
Percentuale di donne occupate
49,5
49
48,5
48
47,5
47
2004 2005 2006 2007 2008 2009 2010 2011 2012 2013 2014
Source Istat, BesGrafico46 Ore lavorate. Valori espressi in numero di ore. Anni 2004-2014
43
41
39
Numero di ore lavorate
37
35
33
31
29
27
25
2004 2005 2006 2007 2008 2009 2010 2011 2012 2013 2014
Source Istat. Rilevazione Forze lavoro
men women totalDifferenza salariale di genere
8
7,3
7 6,7
6 5,8
5,5
5,3
5,1
4,9
5
4,4
4
3
2
1
0
2006 2007 2008 2009 2010 2011 2012 2013
Fonte: Istat ed EurostatPersone di 15-64 anni che svolgono più di 60 ore settimanali di
lavoro retribuito e/o familiare, per sesso (valori percentuali)
41 40,5
40 39,2
39
38
37
Maschi
36 35,5
Femmine
35 34,6
34
33
32
31
2002-2003 2008-2009
Fonte: Istat, Indagine Uso del tempoGrafico 48 Tempo libero. Valori espressi in ore. Anno 2008
8
7
6
5
hours
4
3
2
1
0
15-24 years 25-44 years 45-64 years 65 years and over 15 years and over
men women total Source Istat, Indagine uso del tempoGrafico 67 Attività di volontariato. Valori percentuali. Anni 2005-2014
12,0
11,0
MEN
10,0
WOMEN
9,0 TOTAL
8,0
7,0
6,0
Source Istat, BesGrafico 39 Persone con almeno il diploma di scuola superiore. Valori Percentuali. Anni
2004-2014
65,0
60,0
Valori percentuali
55,0
50,0
45,0
40,0
2004 2005 2006 2007 2008 2009 2010 2011 2012 2013 2014
men women total Source Istat, BesGrafico 40 Competenze di base. Punteggi INVALSI. Anni accademici 2012/2013 e
2014/2015
206 207
204
204
197
197
men
194 194
women
2012/2013 2014/2015 2012/2013 2014/2015
level of numeracy level of litteracy source Istat, BesGrafico 43 Uscita precoce dal sistema istruzione. Valori percentuali. Anni 2004-2014
30,0
25,0
Percentage values
20,0
15,0
10,0
5,0
0,0
men womenGrafico 41 Formazione continua. Valori percentuali. Anni 2004-2014
8,5
8,0
percentage values
7,5
7,0
6,5
men
6,0 women
5,5
5,0
4,5
4,0
source Istat, BesGrafico 66. Soddisfazione per le relazioni amicali e familiari. Valori percentuali. Anni
2005-2014
40,0
men very satisfied with family
relations
35,0
women very satisfied with family
30,0 relations
25,0 men very satified with friends
20,0
women very satisfied with friends
15,0
source Istat, BesGrafico 65 Fiducia generalizzata. Percentuali. Anni 2010-2014
Generalized trust (percentages)
25,0
20,0
15,0
10,0
5,0
0,0
2010 2011 2012 2013 2014
Source Istat, Bes
men women totalGrafico 33 Aspettativa di vita alla nascita. Valori in anni.
85,0
84,5 84,4 84,6
84,0 84,1 84,1 84,3
83,7 84,0
83,7
80,3
79,6 79,8
79,4
79,0 79,1
78,7 78,8
78,4
77,9 78,1
Men
Men
Men
Men
Men
Men
Men
Men
Men
Men
Men
Women
Women
Women
Women
Women
Women
Women
Women
Women
Women
Women
2004 2005 2006 2007 2008 2009 2010 2011 2012 2013 2014
Source Istat, BesGrafico 34 Aspettativa di vita alla nascita in buona salute. Valori in anni.
59,8
60,0 59,4
59,2 59,2
59,0
57,7
58,0
57,3 57,3
57,0
57,0
56,4
men
56,0
women
55,1
55,0
54,0
53,0
52,0
2009 2010 2011 2012 2013Grafico 38 Eccesso di peso. Valori percentuali. Anni 2005-2011
60
50
40
percentages
men
30
women
total
20
10
0
2005 2006 2007 2008 2009 2010 2011 2012 2013 2014
Source Istat, BesGrafico 37 Proporzione di fumatori tra le persone di 14 anni e più. Valori percentuali.
Anni 2005-2014
30,0
25,0
20,0
men
15,0
women
10,0
5,0
0,0
2005 2006 2007 2008 2009 2010 2011 2012 2013 2014
source: Istat, BESGrafico 71 Tasso di omicidi. Omicidi per 100.000 abitanti. Anni 2004-2014
2,5
2,0
1,5
1,0
0,5
0,0
2004 2005 2006 2007 2008 2009 2010 2011 2012 2013 2014
Source Istat, Bes
men women totalGrafico 73 Soddisfazione per la propria vita. Percentuale di persone di 14 anni e più
con un livello di soddisfazione di vita da 8 a 10.
50
48
46
44
Percentage values
42
40 men
women
38
Total
36
34
32
30
2010 2011 2012 2013 2014Conclusions 1 1. Sustainability: is a necessity of human beings for their wellbeing and imply to make choices within limits, In Italy we are using the BES project 2. Sustainability: is a process of assessment in the Anthropocene. In a period of Anthropocene, where human activities have become a significant even dominant force impacting the functioning of the Earth system – begin: Industrial Revolution – poses new questions and requires new ways of thinking and acting 3. Sustainability: Uncertainty, Complexity, Dynamic, Global-Local, Interlikages (Economic-Environmental-Social-Governance) 4. Sustainability: theories and measurement. In a world where the socio-economical systems are closely linked and are complex adaptive systems. Essential features of this complex adaptive systems – such as non linear feedbacks, cross-scales and strategic interaction, individual and spatial heterogeneity, and varying time scales – pose substantial challenges for modelling understanding and management
Conclusions 2
5. At international level the SDGs process is a challange, United
Nations Statistical Division is developping SD and wellbeing
measures, in the framework of the official statistics
6. United Nations «Data Modernization Network» for organizing
the world statistical system where public and private institutions
and different actors are co-operating
7. From GDP to Well-being
8. Democracy again: policy and people, bottom-up approach for
legitimation of the process of decisions

9. One goal of SDGs for Women and many aspects are covered
References

www.misuredelbenessere.it

http://unstats.un.org/sdgs/

http://www.unece.org/stats/sustainable-
development.html

http://ec.europa.eu/europe2020/index_it.htm
REFERENCES

URBES REPORT
http://www.istat.it/it/files/2013/06/Urbes_2013.pdf

BES OF PROVINCE
http://www.besdelleprovince.it/index.php?id=26833

Urban Environment/Ambiente Urbano:
http://www.istat.it/it/archivio/141296
F. Riccardini, Intervista per la newsletter della Commissione europea «BeyondGDP»:
http://ec.europa.eu/environment/beyond_gdp/newsletter_en.html

F. Riccardini, Scenari mondiali in Note bibliografiche a «Oltre la siepe» di M.
Gallegati , su Moneta e Credito, dicembre 2014:
http://ojs.uniroma1.it/index.php/monetaecredito/article/view/13026/12833

F. Riccardini, D. De Rosa, NEXUS Food/Water/Energy :
http://www.sciencedirect.com/science/article/pii/S2210784316300572
What if?

      Is sustainable our actual society?
   How will be the future of our children?
What will be world look like in 2020, 2050 2100?
             What are the threats?
          What are the opportunities?
      What and where will be the work?

   Thank you for your attention
You can also read