Overview of road safety in New Zealand
←
→
Page content transcription
If your browser does not render page correctly, please read the page content below

Overview of road safety in New Zealand
Contents

      1. About this Slidepack

      2. The Current Road Safety Picture

      3. Vehicle Safety

      4. Vehicles as a Workplace

      5. Infrastructure

      6. User behaviour

      7. Speed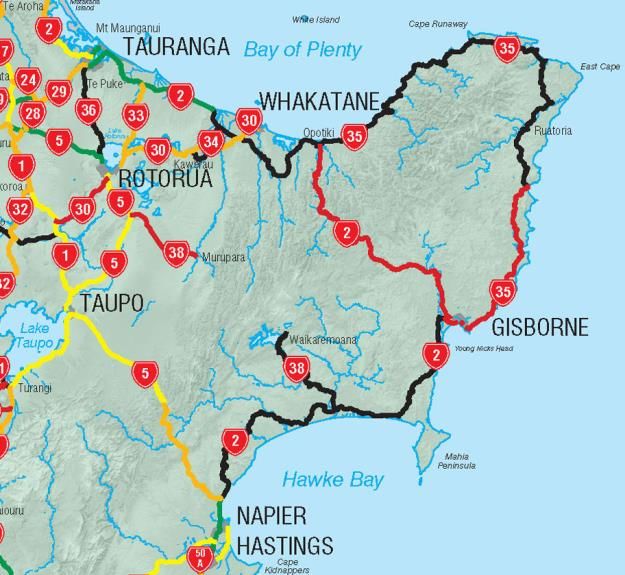
1. About this Slidepack
4

This is a preliminary outline of the New Zealand evidence

 We have a lot of data
 ►    Not all can be analysed
      before the Reference Groups
      meet.
 ►    If you think vital analysis is
      missing you can request it.

 The data is not inexhaustible.
 ►    Some data that you want may not exist.
 ►    Data exists in different datasets. Not all of these can be combined.
 ►    Data is collected by numerous agencies.
5

Data & Analysis in this pack

    ►   Most of the data in this pack comes from NZTA or MoT.
    Where the data/analysis was provided in full or in part from
    ►
    NZTA their logo appears at the bottom of the slide.
    Data is up-to-date as of 20th August 2018 – some data is
    ►
    provisional and subject to change.
2. The Current Road Safety Picture
7

Road deaths were declining but now trend upwards

    500
                                                                Highlights:
    400
                                                                ►   42% reduction from 2008 to 2013.

    300                                                         ►   lowest annual road toll (253) in 2013.

                                                                ►   52% increase since 2013.
    200
                                                                ►   currently the highest total since 2009.
    100
                                                                ►   Rolling total for last 12 months: 376 (as
                                                                    of August 8th 2018).
      0
       2008 2009 2010 2011 2012 2013 2014 2015 2016 2017 2018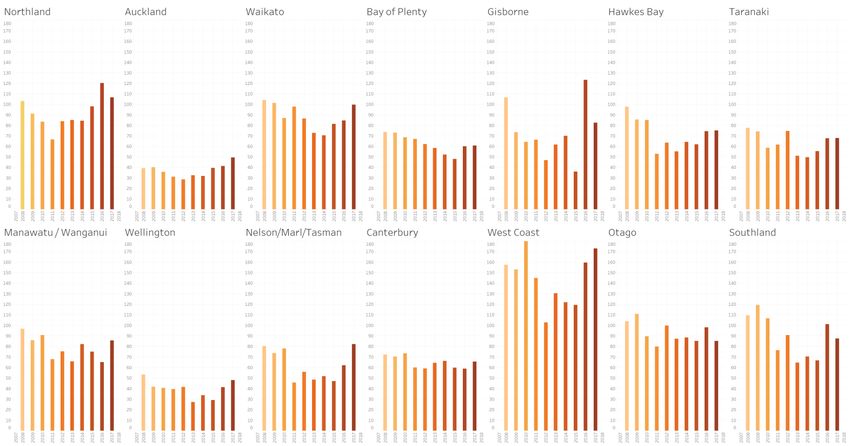
8

…other measures are following the same trend

             Deaths, police reported serious casualties and people
             hospitalised for over one day: rolling 12 month totals                 Current rates
     4000

     3500

     3000                                                                           ►   Crash hospitalisations rate up 28% from
     2500                                                                               its low point in 2015.
     2000

     1500
                                                                                    ►   Serious Injuries rate +44% from its low
     1000
                                                                                        point 2013, and at its highest rate in 10
     500                                                                                years.
        0

            Hospitalised (over 1 day)   Police reported serious injuries   Deaths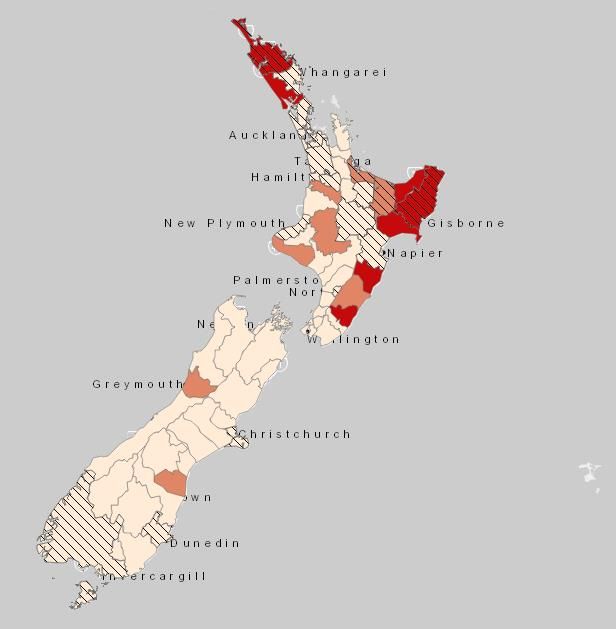
9

  Since 2013 road deaths are increasing faster than
  the population
          Index of Trends: Population, Gross Domestic Product,
         Vehicle Kilometres Travelled, Deaths and Serious Injuries
           and Deaths (Indexed equal to 1000 at end of 2008)
1300
                                                                                            Indexed Change from End of 2013 through
                                                                                            to End of 2017
1200
                                                                                            ►   Population Growth:             + 8%
1100

1000                                                                                        ►   Gross Domestic Product Growth: + 15%
900                                                                                         ►   Deaths and Serious Injuries:    + 40%
800
                                                                                            ►   Road Deaths:                    + 49%
700

600

500
       2008   2009   2010   2011    2012         2013         2014    2015    2016   2017

                     Pop.     GDP          VKT          DSI          Deaths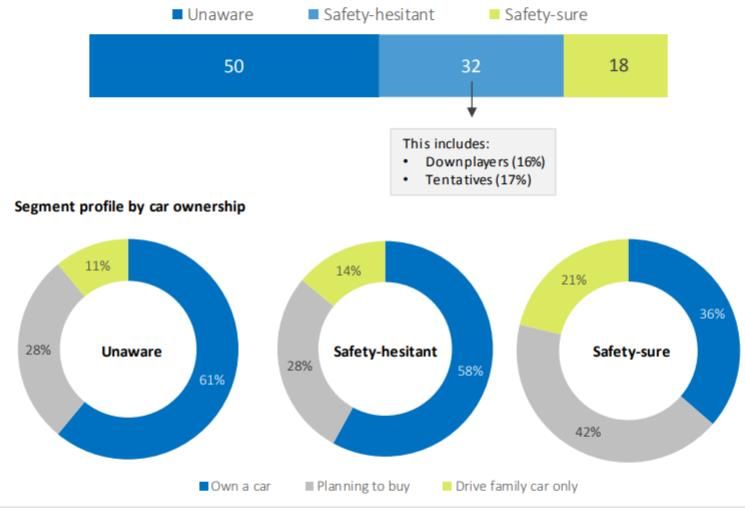
10

 …and increasing as other countries plateau

                               Road deaths per 100,000 population
     14.0

     12.0

     10.0
                                       8.6
                                                                                                               7.9
      8.0
                                                                     5.7
      6.0

      4.0

      2.0
                                   2.8                               2.7                                        2.5
      0.0
            2008   2009         2010         2011          2012   2013     2014       2015          2016     2017

                   Australia       Japan            New Zealand   Norway     Sweden          United States
11
New Zealand performs poorly compared with many
other OECD nations…in deaths by population
International comparison of deaths per 100,000
population (2016)
Switzerland
Sweden
Denmark
Japan
Spain
Germany
Ireland
Finland
Australia
France
Italy
Iceland
Belgium
Czech Republic
Hungary
Slovenia
Lithuania
New Zealand
Greece
Poland
0 1 2 3 4 5 6 7 8 912
…deaths by vehicle number
International comparison of deaths per 1 000 000
Switzerland
vehicles (2016)
Sweden
Japan
Spain
Finland
Germany
Iceland
Italy
Denmark
Australia
Ireland
France
Greece
Belgium
Czech Republic
New Zealand
Slovenia
Poland
Lithuania
Hungary
Serbia
0 50 100 150 200 250 30013
…and per kilometre travelled
Deaths per billion vehicle kilometres
Sweden
Ireland
Denmark
Germany
Iceland
Finland
Australia
France
Japan
Slovenia
New Zealand
Belgium
Czech Republic
0 2 4 6 8 10 12 1414
New Zealand also performs poorly compared with other
similar size countries
Comparison of road fatality rates in countries with approximately 5 million people (2016)
fatalities per 100,000 people
8
7.0
7
6
5.1
5 4.7
3.9
4 3.7
3 2.6
2
1
0
Finland Ireland Norway Slovakia Denmark New Zealand
Source: https://data.oecd.org/transport/road-accidents.htm15
Some of the increase in DSI cannot currently be
explained
The Deloitte Analysis of Road Toll (March 2017) looked at the drivers of the increasing levels of DSIs.
They found no one single factor to explain the increase, but it was partly down to…
► Increases in the number of vehicle kilometres travelled (more people, driving more cars,
more mistakes).
► Increase in the number of motorcycle registrations (more vulnerable vehicle design).
One third of the variation could not be explained.
The long-term trend shows that road travel has become far safer over the last 25 years, despite a
growing population and increasing numbers of vehicles on the road – fatalities have almost halved from
747 in 1985 to 378 in 2017.16
Car occupants have the highest numbers of DSI
Deaths and Serious Injuries by Mode of Transport
3500
3000
2500
2000
1500
1000
500
0
2008 2009 2010 2011 2012 2013 2014 2015 2016 2017
Cars Cyclists Motorcyclists Other Pedestrians Trucks Buses17
But motorcyclists face the highest risk of DSI by
vehicle-kilometre travelled…
Deaths/serious injuries per 100 million km travelled (July 2010 - June 2014)
180
Deaths/injuries per 100 million km travelled
160
140
120
100
80
60
40
20
0
Motorcyclists Cyclists Pedestrians Car/SUV/Van/Ute Car/SUV/Van/Ute Bus passengers
drivers passengers
Mode of travel18
…and by hours spent travelling
Deaths/serious injuries per million hours spent travelling (July 2010 - June 2014)
80
Deaths/injuries per million hours spent travelling
70
60
50
40
30
20
10
0
Motorcyclists Cyclists Car/SUV/Van/Ute Car/SUV/Van/Ute Pedestrians Bus passengers
drivers passengers
Mode of travel19
There is a wide variation of DSI rates by region
Deaths and serious injury by region per 100 000 people20
Crashes have a large social cost
Estimated total annual social cost of crashes
($ billion, at June 2017 prices)
6.0 Social cost includes a number of
different elements: loss of life and life
quality, loss of output due to temporary
5.0
incapacitation, medical costs, legal
costs and property damage costs.
4.0 Loss of life is estimated by the amount
New Zealanders would be willing-to-pay
3.0
for safety improvements that result in
the avoidance of a premature death.
The cost of $2m per fatality was
2.0
established in 1991. The most up-to-
date cost stands at $4.7m per fatality as
1.0 at June 2017. These costs are regularly
updated.
0.0
2008 2009 2010 2011 2012 2013 2014 2015 2016 2017
Fatal Serious Minor3. Vehicle Safety
22

     Fleet size
         Number of vehicles vs population                                                               Light fleet ownership per 1000
                 (1963 - 2016)                                                                                     population

                                                               Vehicles per 1000 population
                                                                                              850

               All road vehicles as at year end   Population
                                                                                              800
5,000,000
4,000,000                                                                                     750

3,000,000
                                                                                              700
2,000,000
                                                                                              650
1,000,000
          -                                                                                   600
              1981
              1963
              1966
              1969
              1972
              1975
              1978

              1984
              1987
              1990
              1993
              1996
              1999
              2002
              2005
              2008
              2011
              2014
                                                                                                 2000   2002   2004   2006   2008   2010   2012   2014   2016

     ►   The size of the New Zealand vehicle fleet has been increasing pretty much since records began
     ►   In 2007, growth tapered off and remained almost flat for 6 years
     ►   But fleet size has been growing again since 2012
     ►   NZ’s population has grown since 2000s, so per capita values for ownership (and travel) fell until 2013 but
         have grown again since then
23
Fleets are ageing in many countries
Average age of light passenger vehicles fleets
14 NZ ► Most fleets got older, except
Australia.
12 US Trucks
Vehicle age (years)
► Improved rust prevention is
10 allowing fleets to age.
US Cars
8 ► In New Zealand about 50
Japan percent of the light vehicle
6
fleet is 13 years or older,
EU
4 which is older than many
Australia other OECD countries.
2
0
2005 2007 2009 2011 2013 2015 201624
Average age (years)
10
12
14
16
18
20
0
2
4
6
8
Poland
Lithuania
Latvia
Romania
Estonia
Czech Republic
Hungary
New Zealand
Croatia
Greece
Slovakia
Finland
Portugal
USA
Spain
Average age
Slovenia
countries
EUROPEAN UNION
GDP
Italy
Australia
Canada
Sweden
Netherlands
France
Ireland
Austria
Germany
Belgium
Average age of light vehicle fleet and GDP (US$) in various
Denmark
United Kingdom
Average vehicle age is related to the economy
R² = 0.5158
Japan
0
10,000
30,000
40,000
50,000
60,000
70,000
80,000
20,00025
The age of the vehicle may play a role in whether people
are injured in a crash
Age profile of light vehicles in fatal and serious injury crashes
8% (2011-2015)
7%
6% Fleet profile
5%
Fleet profile vkt adjusted
4%
In fatal and serious
3% injury crashes
Vehicle had DSI
2%
occupants
1% Vehicle had no DSI
occupants
0%
0 1 2 3 4 5 6 7 8 9 10 11 12 13 14 15 16 17 18 19 20 21 22 23 24 25 26 27 28 29
Age (years)26
Older vehicles travel less, and are in more serious
crashes
Vehicles older than 13 years make up:
50% of the fleet BUT … only travel 40% AND … account for over
of the distance travelled 65% of the vehicles in
by the whole fleet which someone is killed
or seriously injured
13 + 13 + 13 +
years years years27
But older cars are more likely to be owned by younger
drivers
Car Age by Car Owner (2008-2017)
100%
90%
80%
70%
60%
50%
40%
30%
20%
10%
0%
0 - 4 years 5 - 9 years 10 - 14 years 15 - 19 years 20-24 25-29 30+
Age of Vehicle
15-19 20-24 25-29 30-34 35-39 40-44 45-49 50-54 55-59 60+
Owner Age28
There are two kinds of vehicle safety information
ratings for consumers.
ANCAP
UCSR
(Australasian New
Car Assessment (Used Car Safety Rating)
Ratings based on outcome of real world
Program) crashes across a range of crash types and
Ratings based on a range of crash occupant characteristics. Minimum of 300
tests to measure ability of a vehicle crashes required to achieve published
to avoid a crash and protect the rating.
occupants in a crash.29
A key input to a vehicles UCSR is the vehicles
crashworthiness (CWR)
The CWR is based on the outcome for people in over 8 million vehicle crashes. It measures
how well the vehicle protects occupants in the event of a crash.
Depending on the CWR score determines which star rating band the vehicle fits into.
Using the CWR we can get a view of the safety profile of the NZ light vehicle fleet and the
vehicles we import into it.
CWR of used vehicles imported into New Zealand in 2016
CWR Rating Number of Vehicles Percent of 2016 imported vehicles
1 Star 14184 10
2 Star 15914 11
3 Star 41903 28
4 Star 31761 21
5 Star 44308 3030
Cars with a lower CWR are over represented in
serious crashes
60%
50%
40%
30% % fleet
% driver DSI
20%
10%
0%
1 Star 2 Star 3 Star 4 Star 5 Star
Crash Worthiness Rating31
Newer cars are more likely to have a better CWR
New Zealand light vehicle fleet 2017 by Year of Manufacture and CWR32
CWR Star Rating of Fleet
2017 Light Passenger Fleet CWR
CWR Star Rating of Light Passenger
Proportion by Star Rating
Fleet by year
50%
45%
40%
5 1 35%
30%
25%
4 20%
15%
2 10%
3 5%
0%
2012 2013 2014 2015 2016 2017
1 Star 2 Star 3 Star 4 Star 5 Star33
Trucks are over-represented in serious crashes
► Deaths from crashes involving trucks have
declined overall but have been increasing since
2013.
► Deaths from crashes with trucks make up
around 20 percent of deaths, but only 6 percent
of the total distance travelled.
► In contrast, deaths from crashes with buses
are rare (average 6 per year since 2000).
► Nearly 90 percent of those killed in heavy
vehicle crashes are not the occupants, but the
other road users involved.
► This reflects the fact that, in a collision
between a heavy vehicle and a light vehicle or
vulnerable road user, there is a much higher
probability of death or serious injury than in a
collision involving only light vehicles.34
Most Vehicles have current WOFs
Fleet with current WOF
This data reflects vehicles that are
registered in the MVR but may or
may not be currently on the road. It
18%
also does not show how far out of
WOF not current date the WOF is (if not current).
Current WOF
An analysis of showing the
82% proportion of vehicles, with a WOF
1 day, 1 week, 1 month etc
outstanding could be completed if
required.
(using random sample of 10 000
vehicles that require WOFs)35
Most vehicles have a current WOF at the time of crash,
this is stable over time
Vehicles involved in fatal and serious Vehicles involved in fatal and serious injury
injury crashes that have a current WOF crashes that have a current WOF at time of
at time of crash, 2013 - 2017 crash
100%
90%
80%
70%
60%
50%
40% WOF rule change on frequency
30% of inspections (Jan 2014)
20%
10%
0%
No Yes Unknown 2008 2009 2010 2011 2012 2013 2014 2015 2016 201736
Electronic Stability Control (ESC) and Airbags are
now in almost all cars we import
Vehicles new to the New Zealand fleet with side curtain
airbags Vehicles new to the New Zealand fleet with ESC
100 100
90 90
80 80
70 70
Percentage
Percentage
60 60
50 50
40 40
30 30
20 20
10 10
0 0
2009/8 2010/8 2011/8 2012/8 2013/8 2014/8 2015/8 2016/8 2017/8 2009/8 2010/8 2011/8 2012/8 2013/8 2014/8 2015/8 2016/8 2017/8
Cars Light commercials All Cars Light commercials All37
Road transport emissions show a mixed picture
► Emissions of CO and NO from the New Zealand LDV fleet decreased
significantly between 2003 and 2015.
► However, from 2010 to 2014 roadside NOx concentrations were relatively
stable.
► NZTA’s passive NO2 monitoring network results show that annual average
NO2 concentrations at a number of typical and key roadside sites have
remained relatively constant over the last 10 years. Note that NO2 is the
toxic compound in NOx.38 Uptake of electric vehicles continues to increase
4. Vehicles as a Workplace
40

Most fatal crashes involve private passenger vehicles

              Fatal crashes by vehicle use type
                                                  Personal vehicles are defined as vehicles
                                                  registered to an individual. Work vehicles
                                                  are defined as those registered to a body
            Work Vehicles                         corporate.

                                                  Assessing whether a vehicle is being used
                                                  for work at the time of the crash is
                                                  problematic. Some vehicles will be
                 Personal Vehicles
                                                  registered as work vehicles but will also be
                                                  driven for personal trips. Some private
                                                  vehicles will be used for work purposes.

(using matched MVR and CAS data 2012 – 2016)
41 High exposure goods vehicles are a small proportion of the fleet but travel further than others There are approximately 45,000 active Transport Service Licence (TSL) holders in New Zealand. This includes: ► Passenger Service Licences (~19,000) ► Goods Service Licences (~24,500) ► Rental Service Licences (~1,000), and ► Vehicle Recovery Services Licences (~500) Number of service licences
5. Infrastructure
43
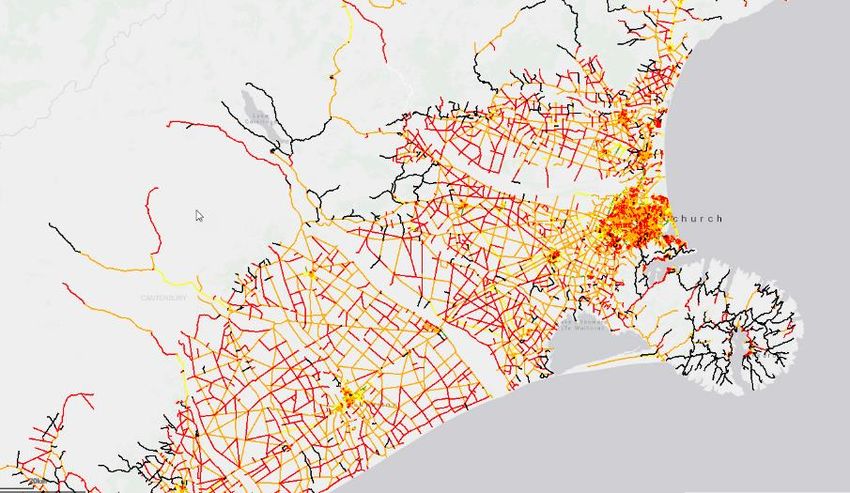
Infrastructure risk ratings
► Our roads are rated based on their risk to Personal and Collective safety
Personal risk is a person’s chance of being killed or seriously injured on
the road per 100 million kilometres travelled
Collective risk is the overall number of fatal
and serious injury crashes per kilometre
travelled
Around 1/3 of our roads have a Medium-
high or High personal risk rating Personal risk map44
What is the scale of the problem in NZ?
Infrastructure Risk Rating
► Our road network is long and stringy, our population is relatively low
and dispersed and our natural geography is challenging. This
makes our road network more difficult to maintain and improve.
► There are 94,000 kms of roads on the network (11,000 kms of
State Highways and 83,000 kms of local roads).
► Most open roads have a speed limit of 100km/h, and many offer
little protection if road users make a mistake.
► We have assessed the entire network using a new method called
Infrastructure Risk Rating (IRR). This assesses a road’s risk based
on it current form (eg, its width, curvature, roadside hazards, safety
infrastructure, etc).
► This assessment shows that 55% of the rural network and almost Source: NZTA MegaMaps
47% of the urban network are rated a high or medium-high risk
(table below).
Infrastructure Risk Rating by land use nationally
Land Use High Medium High Medium Low Medium Low
Rural 32.9% 23.3% 37.1% 5.6% 1.0%
Urban 1.1% 13.4% 40.8% 39.1% 5.6%
All 25.6% 21.0% 38.0% 13.3% 2.0%45 Road infrastructure has a clear link to safety outcomes
46

 Most DSI crashes occur on local roads

                  2017 DSI crashes by Road Type
                                2.4%

                                       3.2%
                       6.6%
                                                        Unknown

                                              20.5%     Minor Urban Road

                                                        Major Urban Road
               24.9%
                                                        Other Open Road

                                                        Open Road State Highway

                                                        Urban State Highway
                                                19.2%   Motorway

                        23.2%
47
Crash rate modelling on State Highways
Opus and Statistics Research Associates carried out some statistical
modelling of DSI crashes on state highways.
Concerned with vehicle crashes in which at least one person has been
killed or suffered serious or minor injuries.
Key findings were:
► Roughness is a factor for curves where traffic is going at close to full
speed but there still is some curvature
► There is a suggestion that skid resistance is more important on
curves than on straight roads.48
DSI rates have increased on all road types since 2014
350 2500
300
2000
250
1500
200
Deaths
DSIs
150
1000
100
500
50
0 0
2000
2001
2002
2003
2004
2005
2006
2007
2008
2009
2010
2011
2012
2013
2014
2015
2016
2017
Local Road Deaths State Highway Deaths
Local Road DSIs State Highway DSIs49
Customer ratings of the State Highway network
The most positive ratings are for providing appropriate signage on State Highways,
for warning drivers of the need to reduce their speed for roadworks ahead and for
general safety messages. By contrast, keeping road surfaces even and smooth
consistently receives the lowest ratings.50
What is the scale of the problem on New Zealand’s road
network overall?
► 12% of the network
accounts for 50% of the Factor State Highway Local Road
travel (VKT) and 52% of the Length of Network 12% (11800 km) 88% (84000km)
DSIs. Travel (vkt) 50% 50%
► The State Highway network Deaths 52% 48%
has a far higher rate of Serious Injuries 36% 64%
deaths per km of network Urban / Rural split (Deaths and Serious 19% / 81% 65%/ 35%
and the crash problem is Injuries)
primarily rural mid-block. Intersections / Midblock (DSI) 22% / 78% 31% / 69%
► The local road network has Pedestrians & Cyclists, & Motorcyclists 9% & 19% 26% & 22%
the greater proportion of (DSI)
serious injuries and the Rural Head On / Run off road / Other 17% / 33% / 18% 4% / 20% / 5%
crash problem is largely (DSI)
urban with greater Urban / Rural Intersections (DSI) 9% / 13% 25% / 6%
proportions of intersection
and vulnerable road users.51
What are the main risks on the network?
Open roads Urban roads
• Impact speeds are • Intersection crashes
higher so crashes more • High active mode activity,
likely to be serious including children and
• Many New Zealand elderly on roads with a
roads and roadsides 50km/h speed limit or
are unprotected so high higher.
risk of head-on or run- • High interaction with land
off road crashes, and use (link and place), e.g.
also less reaction time CBDs, residential streets,
and stopping distance mixed-use arterials.
at higher speeds • High travel speeds do not
• Pedestrian and cyclist align well in safe, equitable,
crashes more likely to liveable and accessible
be fatal cities, where walking and
• Motorcyclist crashes cycling is safe and
are more likely to be attractive.
fatal • It is the Government’s
• Many rural schools are objective to improve urban
located on open roads safety both at the school
gate and on the journey to
school to encourage more
walking and cycling.52
Crash severity varies by speed, intersection type…
Cross-priority – intersection where one vehicle
has priority, the other is at a stop or give-way
sign.
Cross signals – intersection with traffic lights
T-priority – T-intersection where one vehicle
has priority, the other is at a stop or give-way
sign.
T signals – T-intersection with traffic lights
Roundabout53
Lighting and personal safety
Before and after studies show reductions in crashes
of around 30% where lighting has been improved.
A comprehensive study in Auckland
showed reductions in night-time crashes
of:
► 33% overall
► 42% injury, and
► 67% serious and fatal.6. User Behaviour
55

 Most crashes have multiple causes

                                                                                                                                                          Proportion of fatal and serious crashes
                                                                                                                                                              involving each System Pillar

     Almost all DSI crashes involve
     user factors, however most
     crashes have multiple causes.

     Mackie, H. W., Gulliver, P., Scott, R. A., Hirsch, L., Ameratunga, S., & de Pont, J. (2017). Serious injury crashes: How do they differ from fatal
     crashes? What is the nature of injuries resulting from them? Wellington, New Zealand: NZ Automobile Association Research Foundation. Retrieved
     from http://www.aa.co.nz/about/aa-research-foundation/programmes/comparing-serious-and-fatal-crashes/
56
Attitudes to road safety issues are stable over time
Not much chance of an accident if
30
careful when... 75
The risk of being caught is small
% agree / strongly agree
% agree/ strongly agree
20 50
...speeding …if not wearing a safety belt
10 25 …if drink-driving
…if speeding
...driving after drinking
0 0
2008
2010
2012
2014
2016
2008
2010
2012
2014
201657
Passengers generally feel safe on public transport
How safe are you feeling?
Personal Safety on Public Transport... (2016)
100%
90%
80%
70%
60%
50%
40%
30%
20%
10%
0%
A bus A train A taxi Ride sharing
Very safe Fairly safe Fairly unsafe Very unsafe Dont'know58
Motorists’ negative attitudes affect their behaviour
toward cyclists
Overall, motorists perceive cycling as positive and beneficial.
However, some
motorists display
negative attitudes to
cyclists that affect their
behaviour toward them.
Others are not confident
driving around them.
Motorists negative
attitudes were largest for
group road cyclists
(42%) when compared to
a single road cyclist and
a single fast commuter.59
Cycling crashes
► Approximately nine in every ten reported cyclist
casualties occurred on urban roads (roads with a
speed limit of 70km/h or less).
► Furthermore, over half of all cyclist casualties occur
on major urban roads (typically busy arterials), rather
than on the minor urban roads that usually provide
access to adjacent properties.
► While most cyclist injuries occur on urban roads, just
over 1 in 3 (35 percent) cyclist deaths occur on the
open road, due to the higher impact speeds
associated with crashes on these roads.60
Pedestrian crashes
► More than nine in every 10 reported pedestrian casualties
occurred on urban roads (those with a speed limit of
70km/h or less).
► Over half (52 percent) of all pedestrian casualties
occurred on major urban roads (typically busy arterials).
► Forty-one percent happened on minor urban roads and 7
percent on roads with speed limits of over 70km/h.
► The majority (84 percent) of reported pedestrian
casualties on urban roads occurred when the pedestrian
involved was crossing the road.
► About two-thirds (64 percent) of these casualties
occurred when the pedestrian was crossing the road in
an uncontrolled area (for example, not at a pedestrian
crossing or traffic lights).61
Lack of awareness of risks for young drivers
► Half of young drivers and
parents/caregivers unaware of
the greater risk young drivers
face on the road.
► When young drivers drive family
cars they are more aware of the
dangers, with only 36% unaware
compared to 61% for those that
own their own car.62 Young men have higher numbers of DSI on the road
63

..and Maori are over represented in traffic crashes

     Casualties hospitalised for road                                   Ethnicity of New Zealanders at
     crashes for more than one day                                                Census 2013
        (2013 to 2017, inclusive)
                                                                                        2%
                                   1%    1%
                                                                                             5%

                              7%
                                                                                  10%
                      6%

                                                                            6%

                20%
                                                                            13%
                                                                                                  63%
                                                      64%

     European         Maori    Pacific        Asian   Other   Unknown
64
Fewer people who are stopped have been drinking but it
differs by age
Breath alcohol levels for drivers Breath alcohol levels by driver age in
aged 20 and over, by Year Year of 2017
7%
7%
6% 6%
5% 5%
4% 4%
3% 3%
2% 2%
1% 1%
0% 0%
over 0 over 250 over 400 under 20-24 25-34 35-44 45-54 55-64 65 plus
20
Data from regular roadside alcohol measurement operation. Compulsory breath test operations are carried out at the same sites and
times of night for each year’s operation. The operations are held 10pm to 2am on non-holiday weekends from February to May.65
Communities at risk register
► Some areas are more at risk from Alcohol factors on the roads than others.
Collective risk measures the
total number of DSI crashes
in an area.
Personal risk measures the
number of DSI crashes in an
area but also takes into
account the traffic volumes66
Most people wear their seatbelts
100%
95% of 5-9 year
olds and 97% of
% wearing safety belt
90%
0-4 year olds were
restrained in
Male Driver Male Passenger Female Driver vehicles.
Female Passenger Combined
80%
2008 2009 2010 2011 2012 2013 2014 2015 2016
Year67
Seatbelts still save lives
► Those who don’t wear their seatbelt are significantly over-represented in road
deaths.
Percent of car occupant fatalities
not wearing their seatbelt
2013 32%
2014 26%
2015 37%
2016 40%
2017 32%68
Distraction is an issue but hard to monitor
Deaths and serious injuries in crashes with driver
attention diverted between 2008 and 2017
100% DSI where distraction
90% Year was a factor
80% 2008 292
70%
2009 269
60%
2010 286
50%
2011 239
40%
30% 2012 233
20% 2013 194
9.9% 9.4% 10.6% 10.1% 9.7% 8.5% 9.3% 8.9% 8.6% 8.6% 2014 220
10%
0% 2015 220
2008 2009 2010 2011 2012 2013 2014 2015 2016 2017
2016 245
Percent DSI by Distraction Percent DSI by Other 2017 276
International research suggests that the contribution of diverted attention in
crashes may be underrepresented in police-reported crash systems.69
Overseas drivers are not the main issue
Overseas licence holders as a percentage of all
drivers involved in crashes
2013-2017
Top crash driver country Percentage of
of origin (2012-2016) all crashes
New Zealand 95.90
Australia 0.57
Overseas licence China 0.55
95.8% holders
4.2%
Germany 0.49
India 0.41
UK 0.38
USA 0.3370
Older men are disproportionately represented in
motorcycling statistics
Motorcyclist deaths and injuries by age group
2000 2015-2017 4 in 5 motorcyclists
15–19 years injured were male (83%).
1800
20–24 years
1600
25–29 years
Deaths and injuries
1400
30–39 years
1200
40 years and
1000 over
800
600
2015-2017 9 in 10 motorcyclists
400 killed was male (91%).
200
0
Year71
Motorcyclists often have primary responsibility in serious
and fatal crashes
The motorcyclist had the primary
responsibility for 70% of fatal
motorcycle crashes, and over 60%
for serious crashes (as recorded
by Police on crash reports).
Of motorcyclists involved in fatal
crashes, 47% of cases involved either,
speed, alcohol, or drugs or a
combination of these factors.72
The number of drivers not holding valid licences and
involved in DSI crashes fluctuates
Percentages of forbidden, disqualified, expired, never licensed or
wrong class drivers involved in crashes leading to deaths and
serious injuries has varied between 5% and 7%.
8.0%
7.0%
6.0%
5.0%
4.0%
3.0%
2.0%
1.0%
0.0%
2008 2009 2010 2011 2012 2013 2014 2015 2016 2017
Forbidden Disqualified Expired Never licensed Wrong Class7. Speed
74
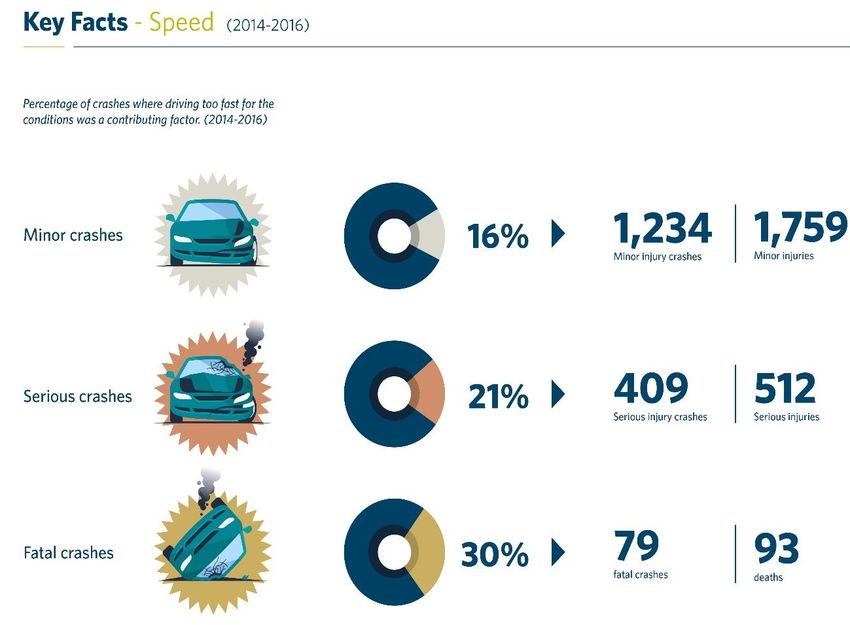
Speed continues to be a key contributing factor to
deaths and serious injury crashes in New Zealand
► Speed continues to be a key
contributing factor to deaths and
serious injury crashes. In 2016,
travelling too fast for the conditions
was the second highest contributing
factor to fatal and serious injury
crashes in New Zealand.
► In 2016 it was a contributing factor in
79 fatal crashes, 406 serious injury
crashes and 1,234 minor injury
crashes. These crashes resulted in 93
deaths, 512 serious injuries and 1,759
minor injuries.
► The total social cost of crashes
involving drivers travelling too fast for
the conditions was about $879 million,
which is approximately 22% of the
social cost associated with all injury
crashes.75
Why is speed important?
► Speed has a direct influence on the likelihood of a crash, and whether someone survives a
crash. In the event of a crash, regardless of its cause, the speed of impact is the most
important determinant of the severity of injuries sustained and the probability of death.
► With higher driving speeds, the number of
crashes and crash severity increase
disproportionately. A 1% increase in average
speed results in approximately a 2%
increase in injury crash frequency, a 3%
increase in severe crash frequency, and a
4% increase in fatal crash frequency.
Reducing speed by a few km/h can greatly
reduce the risks of and severity of crashes,
particularly the likelihood of fatal crashes.
(Based on P. Wramborg, 2005)76
As speed increases, there is an increase risk of crash
involvement
► As speed increases, there is an increase
risk of crash involvement, resulting from the
following factors:
► Stopping distance – both the distance
travelled during reaction time and the
distance travelled after the brakes are
applied.
► The probability of exceeding the critical
speed on a curve.
► Less ability to spot and react to hazards in
the driver’s peripheral vision.
► The chance of other road users misjudging how fast the speeding driver/rider is travelling.
► The probability of a rear end crash if the driver/rider has not accounted for the increased
speed by increasing the following distance.77
…and speed contributes to the severity of crashes
Percentage of Crashes with Deaths and Percentage of Crashes with Deaths and
Serious Injuries with respect to the Speed Serious Injuries with respect to the Speed
Limit (year 2008 through 2012) Limit (year 2013 through 2017)
100% 100%
90% 16% 17%
22% 22% 21% 90% 23% 18% 23%
27% 28% 24% 24% 23%
29%
80% 80%
70% 70%
60% 60%
50% 50%
40% 40%
30% 30%
20% 20%
10% 10%
0% 0%
20 30 50 60 70 80 100 20 30 50 60 70 80 100
Non DSI Percent DSI Percent Non DSI Percent DSI Percent78
Over the past decade speed was a major contributing
factor in DSI crashes…
Driving too Fast for the Conditions is defined as both driving at “excess speed” which refers to instances when vehicles
travel in excess of the legally declared speed limit and “inappropriate speed” which refers to instances when vehicles
travel at a speed which is unsuitable for the prevailing road and traffic conditions.79
Human tolerance to crashes
► The International Transport Forum’s (ITF’s) 2018 report on speed and crash risks
suggests that most unprotected road users survive if hit by a vehicle at up to only
30 km/h, a modern car can protect occupants up to 50 km/h in a side collision,
and a safe car can protect occupants up to 70 km/h in a head-on collision.
Source: https://www.itf-oecd.org/sites/default/files/docs/speed-crash-risk.pdf80
From the Safer speeds: public acceptance and
compliance report
► The acceptance survey undertaken in this study indicated there is some support for reduced
speed limits in some parts of urban areas, but less support for reducing rural speed limits.
► The application of suburban 40km/h speed limits in Hamilton shows that the biggest
reduction in operating speed is a result of engineering improvements. Speed limit signs and
road markings on their own have a limited impact on the operating speeds.
► The acceptance web survey shows that the majority of drivers agreed our roads would be
safer if we all drove a little slower. There was also a high level of understanding that serious
and fatal crashes are related to travel speeds.
► The acceptance survey also shows that drivers would be more likely to slow down, if certain
supplementary information explaining the reason for speed limit change was provided.81
Speed limits do not match the risk and function of
our roads
A significant number of speed limits in New Zealand do not reflect the safe travel
speeds for our roads.
Waikato Region: Percentage of road at safe and appropriate travel speeds compared to current
speed limits (based on NZ Transport Agency’s Speed Management Guide)
Existing speed limit (km/hr) Percentage of road with appropriate travel speed per speed bracket
110 100 80 60 50 40 30
Rural 100 0 13% 49% 38%
80 2% 55% 43%
Urban 100 6% 24% 47% 22% 1%
80 44% 42% 13% 1%
50 2% 24% 73% 1
Speed could go up
Speed is appropriate
Speed is inappropriate82
Other potential sources
• Transport Dashboard https://www.transport.govt.nz/resources/transport-dashboard/
• Understanding trends in roadside air quality: https://www.nzta.govt.nz/resources/research/reports/596
• Exposure to dust on unsealed roads: https://www.nzta.govt.nz/resources/research/reports/590
• Rail safety risks: https://www.nzta.govt.nz/resources/research/reports/632
• Safety of urban traffic signals: https://www.nzta.govt.nz/resources/research/reports/588
• Safety for rural road cyclists: https://www.nzta.govt.nz/resources/research/reports/589
• Safer speeds: https://www.nzta.govt.nz/resources/research/reports/563
• Mobile phone use survey: https://www.nzta.govt.nz/resources/research/reports/556
• Used car buyers ed brief: https://infohub.nzta.govt.nz/otcs/cs.dll/overview/6634873
• Commuter movements interactive map
• Student movements map
• ‘State Highway feedback’ map
• Safe Roads Alliance (in MapHub)
• Proactive treatment strategy (SafetyNET)
• Reactive treatment strategy (SafetyNET)
• Seatbelt wearing, cycle helmet compliance, child safety restraint use, speed – these now reside with MoT:
http://www.transport.govt.nz/research/roadsafetysurveys/
• http://www.transport.govt.nz/research/roadsafetysurveys/publicattitudestoroadsafety-survey/
• https://www.nzta.govt.nz/roads-and-rail/highways-information-portal/processes/corridor-
management/corridor-management-plans/
• Data Tools page: https://www.nzta.govt.nz/planning-and-investment/learning-and-resources/transport-
data/data-and-tools/
• Safety and security data on MOT website: http://www.transport.govt.nz/ourwork/tmif/safetyandsecurity/You can also read