Link Real Estate
Investment Trust

Corporate Presentation
September 2016
←
→
Page content transcription
If your browser does not render page correctly, please read the page content below

Link Real Estate Investment Trust Corporate Presentation September 2016
Link at a Glance

     Link is…                                                          We own…
                • REIT listed in Hong Kong                             In Hong Kong (2)
     #1         • REIT in Asia by market capitalisation
                                                                                       160                     10 million sq ft
                                                                                       Properties              Retail space
                       Free float publicly held by
     100%              institutions and private investors

     Spanning Hong Kong, Beijing and Shanghai,
                                                                         884,000 sq ft                         72,000
                                                                         Under development                     Car park spaces
     our portfolio includes

                                                                       In Mainland China (2)

         Retail       Fresh         Car parks     Offices                              2                       1.8 million sq ft
       facilities    markets                                                           Properties              Retail and office space

     Improving asset quality                                           Portfolio mix by value      (3)                         2.5% 4.2%
                                                            Future

                                                                                                                            3.8%
     and DPU growth                       Property Re-
     through                              development                       Hong Kong retail
                                                                            Hong Kong car park                            16.9%
                         Asset            Property
                                                            New

                         Disposal         Development                       Hong Kong office
       Asset            Asset             Asset                             Mainland China retail                                          72.6%
                                                            Core

       Management       Enhancement       Acquisition                       Mainland China office

Notes:
(1) All data for the financial year ended 31 March 2016 (unless stated otherwise).
(2) As at 30 June 2016.
(3) Portfolio value as at 31 March 2016, minus assets disposed on 31 May 2016 and including acquisition of 700 Nathan Road which was completed
    on 15 April 2016.                                                                                                                              P.2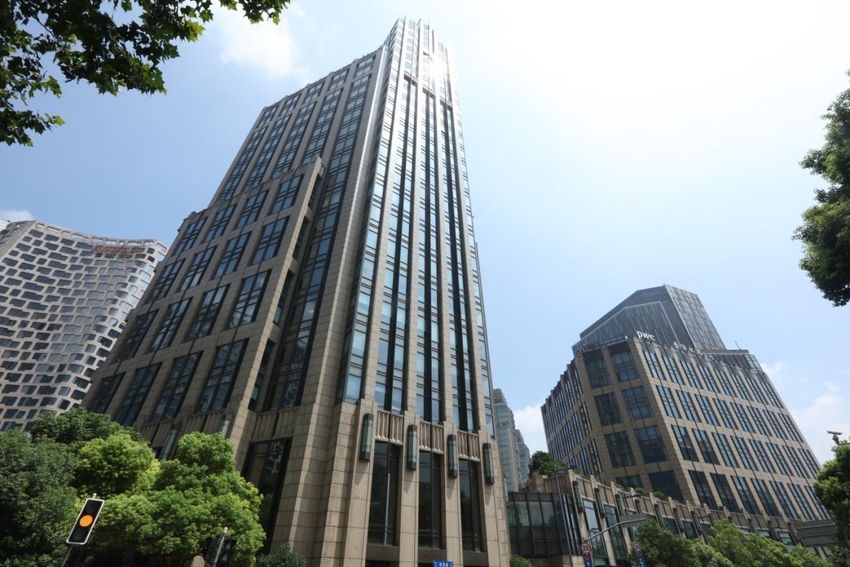
We Link People to a Brighter Future

       Our business growth drivers          What we care about         What we do

                                                                 1   Building a more
                   Asset                      Asset/Brand            productive and higher
                Management
                                                                     quality portfolio

Property Re-                     Asset
                                                  Staff
Development                   Enhancement
                                                                 2   Maintaining a prudent
                                                                     and flexible capital
                                                 Tenant              structure
                Capital
               Recycling
                                                Corporate
                                               Governance        3   Developing a strong
  Property                       Asset                               management team
Development                     Disposal

                                                Economy
                  Asset                                          4   Helping our tenants and
                Acquisition                                          communities grow
                                                                     while delighting
                                               Community
                                                                     shoppers

                                              Environment
                                                                                               P.3
Values We Created

          Revenue                             Net property                           95.3%(2)                    78%
                                                income                               Occupancy in                Retention
        HK$8,740                               HK$6,513                              Hong Kong                   rate
         million                                million
                        5-Year                                  5-Year
                        CAGR                                    CAGR                       Enhancement
                        +10.3%                                  +12.3%               44    projects         26.3%
                                                                                           completed to     Reduction in energy
                                                                                           date             consumption since 2010
         Valuation                            Distribution
                                                per unit
       HK$160,672                                206.18
         million
                         5-Year
                                                HK cents
                                                                 5-Year
                                                                                     HK$27.9 million
                                                                                     Donated through Link Together
                         CAGR                                    CAGR
                                                                                     Initiatives since 2013
                         +19.0%                                  +13.3%

                                                                                     Global recognition

     A/ Stable &                       2.57%                  16.5%
     A2/ Stable(3)                     Effective              Gearing ratio
     Rating from S&P                   interest rate
     and Moody’s

Notes:
(1) All data for the financial year ended 31 March 2016 (unless stated otherwise).
(2) As at 30 June 2016.                                                                                                              P.4
(3) As at 25 July 2016.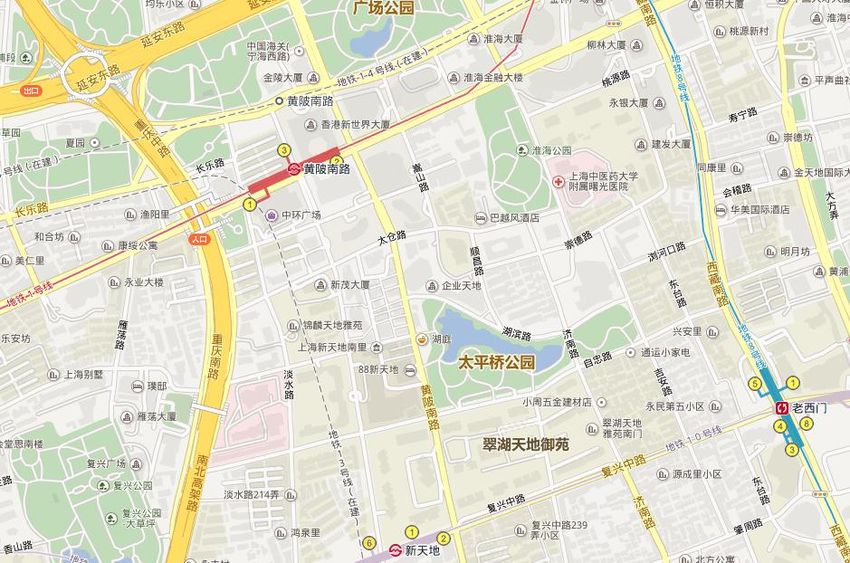
Delivering Sustainable Growth

                                         (1)                                                 (4)                        (4)                  (HK cents)
                   DPU 5Y CAGR                                                        DPU                  Unit Price
 300                  13.3%                                                                                                                     250

                                                                                                                                                230
                                               (2)
 250           Unit Price 5Y CAGR                                                                                             206.18            210
                      15.7%
                                                                                                   182.84                                       190
 200
                                                                        165.81                                                                  170
                                           146.46
 150                                                                                                                                            150
                129.52
                                                                                                                                                130
 100
                                                                                                                                                110

                                                                                                                                                90
  50
                                                                                                                                                70

    0                                                                                                                                           50
  31/08/2011    29/02/2012
                2011/2012  31/08/2012       28/02/2013
                                            2012/2013 31/08/2013       28/02/2014
                                                                       2013/2014  31/08/2014       28/02/2015
                                                                                                   2014/2015 31/08/2015       29/02/2016
                                                                                                                              2015/2016  31/08/2016

                              Compound annualised total return since listing +20.6%(3)

Notes:
(1) 5-Year CAGR for the past 5 financial years.
(2) 5-Year CAGR from 31 August 2011 to 31 August 2016.
(3) A combination of unit price appreciation and distribution paid out since listing in 25 November 2005 to 31 August 2016.
(4) Unit price rebased as at 31 August 2011 market close (i.e. 31 August 2011 = 100).                                                                 P.5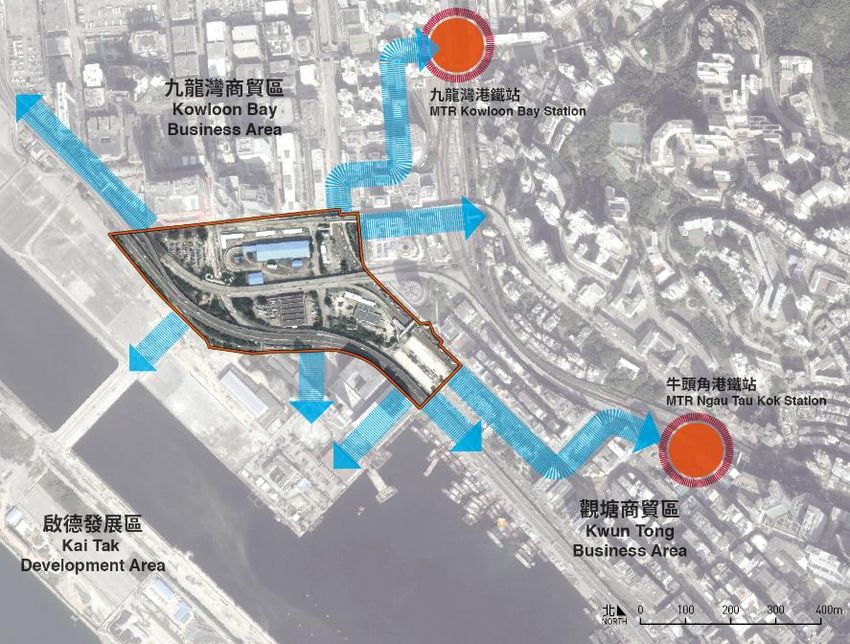
Each Growth Driver Adding to DPU Growth

   DPU (1)
                                                                              Sustain DPU growth

     FY2006 FY2007 FY2008 FY2009 FY2010 FY2011 FY2012 FY2013 FY2014 FY2015 FY2016
                                                                            and
                                                                           beyond

             Asset Management                      Asset Enhancement   Asset Acquisition   Property Development

Note:
(1) For illustration purpose only, not to scale.                                                                  P.6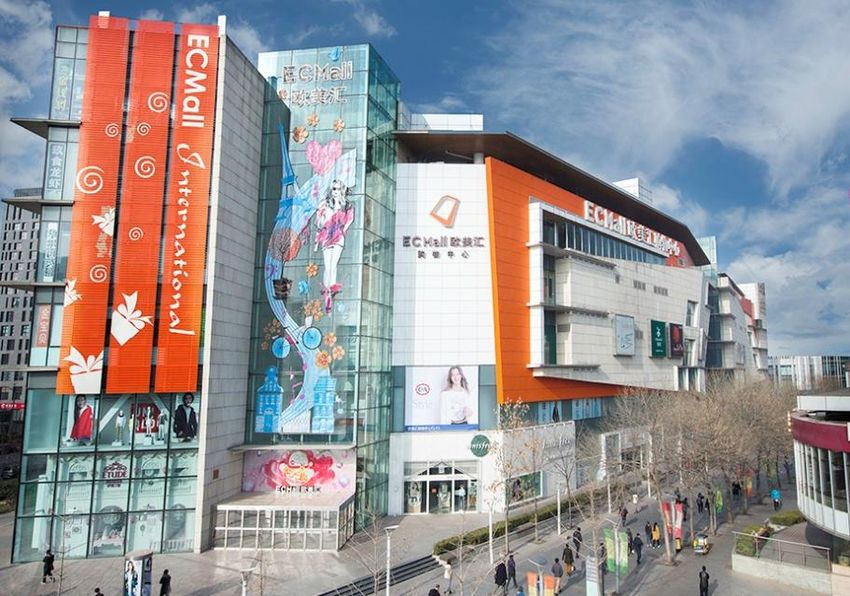
Hong Kong Portfolio
Resilient Retail Portfolio

                       Stable occupancy                                                      Non-discretionary trade mix

(%)                                                                                                              8       1

                                                   96.0%                                                                                  62.4% food
                                                               95.3%                                                                        related
                                       94.8%
                94.1%       94.4%                                                               7                                           trades
                                                                                               6           Trade mix
      92.9%
                                                                                                               by
                                                                                               5
                                                                                                            monthly                  2
                                                                                                              rent

                                                                                                     4

                                                                                                                     3
                                                                                                                                                    Jun-16
                                                                                   1. Food and beverage                                             26.4%
                                                                                   2. Supermarket and foodstuff                                     21.2%
                                                                                   3. Markets/ Cooked food stalls                                   14.8%
                                                                                   4. Services                                                      10.7%
                                                                                   5. Personal care/ Medicine                                        6.4%
                                                                                   6. Education/ Welfare and ancillary                               1.2%
      Mar-12    Mar-13      Mar-14     Mar-15      Mar-16      Jun-16
                                                                                   7. Valuable goods (jewellery, watches and clocks)                 0.8%
                                                                                   8. Others   (1)                                                  18.5%
Note:
(1) Including clothing, department store, electrical and household products, optical, books and stationery, newspaper, leisure and entertainment.        P.8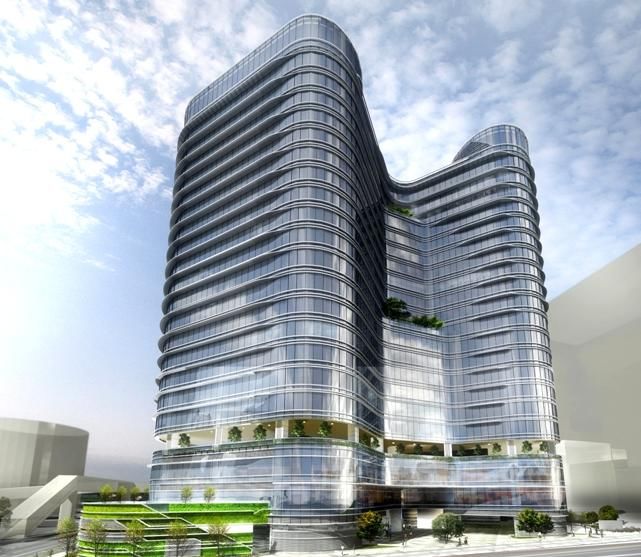
Tenants Outperforming the Market

            Tenants sales growth supported by                                             Stable rent-to-sales ratio implies rent is
         continuous efforts in trade mix refinement                                         still within tenants’ affordable range

(YoY)

                                                                                                                              14.7%
        7.3%

                                                                  4.3%                     12.1%                                              12.2%
                                             3.8%
               3.1%         2.8% 2.6%
                                                                                                             10.3%

                                                                      -6.2%

                                                 -10.8%

                                                                                                                                        (3)
  Food & Beverage Supermarkets &           General Retail (3)      Overall                 Food &       Supermarkets & General Retail         Overall
                    Foodstuff                                                             Beverage        Foodstuff

                 Apr – Jun 16 (Link)          Apr – Jun 16 (HK)                                                       Apr – Jun 16

Notes:
(1) Percentage figures represent year-on-year change in tenants’ average monthly sales per square foot of the respective periods.
(2) A ratio of base rent plus management fee to tenants’ gross sales.
(3) Including services, personal care/ medicine, valuable goods and others.                                                                             P.9
Asset Management Model to Enhance Value

     Business & financial
        improvement                    Asset Management team
                                       •    Led by Director of Asset Management (HK), Link’s former
  • NPI uplift & valuation growth
                                            Director of Leasing
  • Tenant sales growth
                                       •    5 dedicated Asset Managers to oversee 20+ Link’s largest
                                            and strategically most important projects
                                       •    Manage operations, drive customer focus, enhance
                                            efficiency and create value for each cluster
  Operational management               •    Understand both tenants’ and customers’ needs to develop
                                            long-term asset plans
  • Operational efficiency
  • Better resource allocation
                                     No. of clusters                                      5 (1)

                                     No. of assets(2) per cluster                         3-5

                                     Total area per cluster                               Approx 500-740k sq ft
   Sustainable delivery of
      quality service                % of Hong Kong portfolio under
                                                                                          ~36% by valuation (3)
                                     Asset Management Model
  • Tenant/shopper relationship
                                    Notes:
  • Customer experience             (1) 5 clusters in Tseung Kwan O, Kowloon East, Central Kowloon, Tuen Mun and Tin Shui Wai.
                                    (2) Comprises of Destination and Community Shopping Centres.
                                    (3) Valuation as at 31 March 2016, minus assets disposed on 31 May 2016 and including
                                        acquisition of 700 Nathan Road which was completed on 15 April 2016.
                                                                                                                                 P.10
Portfolio Segmentation
To Better Tailor Management Approach
Destination
(flagship assets)
Neighbourhood
(relatively smaller assets)
Lok Fu Plaza
Link’s HK retail
portfolio
Wan Tsui
Commercial Complex
Hoi Fu Community
Shopping Centre (mid-size shopping centres)
No. of Retail Total Average monthly Occupancy
properties(1) Rentals (2) area(1) unit rent(1) rate(1)
(HK$’M) (‘000 sq ft) (HK$ psf) (%)
Destination 6 1,044 1,302 70.8 97.3
Community 38 3,013 4,173 60.8 97.0
Neighbourhood 86 1,883 4,530 35.3 94.6
Note:
(1) As at 31 March 2016, excludes assets disposed on 31 May 2016. P.11
(2) For the financial year ended 31 March 2016.Continuous Demand in Car Park Spaces
Income per space
Rental per month
(HK$M) (HK$)
2,022
1,767
1,846
1,566
Key growth drivers
1,378 1,656
1,222 465
1,494 Growth in private car
registration
432
1,315
386 Stagnant growth in
1,166 car park spaces
342
301 Increased visitation to
1,381 enhanced shopping
1,224 centres
1,108
973
865
2011/2012 2012/2013 2013/2014 2014/2015 2015/2016
Monthly Hourly Car park income per space per month
P.12Park & Dine App Enriching Customer Experience
Over 81,000 downloads since launch in 2015.
New initiatives
• 7-hour free parking for “Park & Ride” users
• Extended e-queuing for easy dining
• One-hour free wifi for app users
• Real-time parking information available
P.13Creating Value through Asset Enhancement
Overview
Number of projects completed since IPO 44
Project ROI target >15%
CAPEX per year HK$600-800 million
Expected number of projects to be completed
4-6 projects
each year
Completed asset enhancement projects in FY2015/2016
Tin Shing
Tsing Yi Long Ping Shopping Centre
Commercial Complex Temple Mall North Commercial Centre Wo Che Plaza (incl. fresh market)
HK$105M / 15.6%(2) HK$306M / 15.5%(2) HK$133M / 17.1%(2) HK$36M / 23.5%(2) HK$195M / 15.6%(2)
Notes:
(1) All data for the financial year ended 31 March 2016 (unless stated otherwise).
(2) Represents CAPEX / ROI of the project.
(3) Estimated return on investment (“ROI”) is calculated based on projected annualised net property income post-project minus net property income
pre-project divided by estimated project capital expenditures and loss of rental. P.14Continuous Asset Enhancement Pipeline to 2020
Projects underway Tin Chak (Tin Shui Wai)
HK$26M / mid 2016 (1) 3 11 projects underway
9 Total CAPEX=
1 2 1
2
HK$1,386M(1)
10 Tai Hing (Tuen Mun)
11 HK$75M / late 2016 (1)
5 Hau Tak (Tseung Kwan O)
Chung Fu (Tin Shui Wai) Tin Yiu (Tin Shui Wai) Butterfly Plaza (Tuen Mun) HK$174M / late 2016(1)
HK$280M / mid 2017(1) HK$164M / early 2017(1) HK$329M / mid 2016 (1)
7
3 4 5 6
Sau Mau Ping (Kwun Tong)
4 HK$72M / late 2016 (1)
Wah Ming Fu Tung Lung Hang 8 Lei Tung (Ap Lei Chau)
(Fanling) (Tung Chung) (Tai Wai)
HK$83M / mid 2016 (1)
HK$72M / early 2017(1) HK$30M / early 2017(1) HK$81M / mid 2017(1)
Pipeline extending to 2020
FY2016/2017 FY2017/2018 FY2018/2019 FY2019/2020
Projects underway 11 (HK$1,386M)
Projects to commence 8 (HK$808M)
Others under planning >16 (>HK$1,300M)
Note:
(1) Estimated costs/ target completion date as at 31 March 2016. P.15700 Nathan Road: Mass-market Commercial
Complex with Excellent Connectivity
Pioneer
Centre
MOKO
Mong Kok
Typical
East MTR
700 Nathan floorplate:
Road approx.
Footbridge
Argyle
11,000 sq.ft.
Centre
Langham
Place
Grand Footbridge
Plaza connecting to
Argyle Centre
Artist rendering
• Acquired in April 2016 at HK$5,910M
• Total GFA of 284,800 sq ft (tower: 170,600 sq ft; retail podium: 114,200 sq ft)
• Located directly above Mong Kok MTR Station, one of the busiest stations in Hong Kong Direct access
• Renovating into a modern retail podium and tower targeting mass-market retail, food to MTR station
in basement
and beverage and service trades
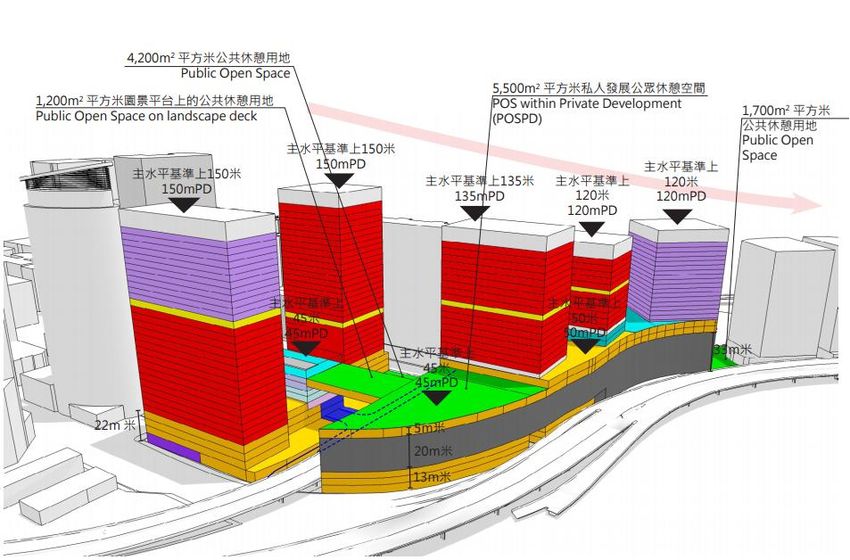
• Start operations around the end of 2017 P.1677 Hoi Bun Road: Best-in-class Grade-A
Commercial Development in Kowloon East
Artist rendering
Proposed
monorail
system
Kai Tak
(under construction)
Kowloon Bay
Kowloon East
Action Area
Ngau Tau Kok
Kwun Tong • Joint development by Link (60%) and
Nan Fung Development (40%)
The project
• Total cost of approx. HK$10.5B
Located within Kowloon • Total GFA of 884,000 sq. ft.
East Action Area which is (office: 803,000 sq ft; retail: 81,000 sq ft)
planned to become a
commercial hub with • Twin towers with connected floors and a
offices, hotels and three-level retail podium that will meet the
exhibition space highest standards of a green building
• Scheduled to be completed in 2019
Source: Energizing Kowloon East P.17Recycle Capital through Asset Disposal
Rationale Disposal criteria
• Part of the strategy for capital recycling and to enhance
portfolio quality Relatively smaller assets
Use of proceeds
• For debt repayment and general working capital Lack of synergy
Unit buyback to neutralise loss in distribution
For new investments to expand and upgrade portfolio
Limited AE potential
No. of disposed Total area Total transacted Premium to
properties (sq ft) price (HK$M) valuation
FY2014/2015 9 308,992 2,956 33%
FY2015/2016 5 181,055 1,716 30%
FY2016/2017 9 329,152 3,652 19%
Total 23 819,199 8,324
P.18Mainland China Portfolio
EC Mall in Beijing:
Exceptional Performance

                                                           EC Mall

                                                           Selected tenants

Total area: 70,946 sqm

• Acquired in April 2015 at RMB2,500M
• Located at Zhongguancun, the “Silicon Valley of China”
  and well-connected by metro lines                                                   As at
• Regional destination mall offering mass market retail                       30 June 2016
  products including trendy retail and strong F&B          Occupancy                98.6%
• Achieved reversion rate at 38.7% for FY2015/2016
                                                                                         P.20
Corporate Avenue 1 & 2 in Shanghai:
Preferred Choice for Local Giants and MNCs
As at
30 June 2016
Office
98.2%
Occupancy
Selected tenants
Disney
Corporate
Avenue 5
Andaz
Hotel
Total area: 98,080 sqm
CA
Langham 1&2
• Acquired in August 2015 at RMB6,600M Hotel
Corporate
Platinum
• Situated in Xintiandi, one of the most renowned and Tower
Avenue 3
affluent central business districts in Shanghai Shanghai
• Equipped with excellent hardware and grade-A Xintiandi
specifications
• Achieved office reversion rate at 12.8% for FY2015/2016
P.21Outlook & Strategy
Remain Confident amidst
Weakening Macro Conditions

 Hong Kong                                                                                   Monthly Median Household Income
                                                                              (YoY)                 by Type of Housing
 Slower but positive GDP                         Continuous low
                                                                              14%                 Public                  Overall
 growth                                          unemployment rate
                                                                              12%

 +1.7% (2Q16, YoY)                               3.4% (2Q16)                  10%
                                                                               8%
                                                                               6%
                                                                                                                                        +4.5%
                                                                               4%
 Stable retail sales value                       Steady growth in monthly      2%                                                       +3.4%
 growth for non-                                 median household income       0%

                                                                                    06/2012
                                                                                    08/2012
                                                                                    10/2012
                                                                                    12/2012
                                                                                    02/2013
                                                                                    04/2013
                                                                                    06/2013
                                                                                    08/2013
                                                                                    10/2013
                                                                                    12/2013
                                                                                    02/2014
                                                                                    04/2014
                                                                                    06/2014
                                                                                    08/2014
                                                                                    10/2014
                                                                                    12/2014
                                                                                    02/2015
                                                                                    04/2015
                                                                                    06/2015
                                                                                    08/2015
                                                                                    10/2015
                                                                                    12/2015
                                                                                    02/2016
                                                                                    04/2016
                                                                                    06/2016
 discretionary trades                            for public housing

 +2.6% (2Q16, YoY)                               +3.4% (2Q16, YoY)                                     Moving Quarter
 Source: HK Census & Statistics Department

 Mainland China Tier-1 cities                                                 (YoY)           Gross domestic product growth

 Moderate GDP growth                           Strong retail sales of goods   10.0%

                                                                                                                                      +6.7%
 +6.7% (2Q16, YoY)                             +10.2% (2Q16, YoY)             8.0%

                                                                              6.0%
 Source: National Bureau of Statistics

                                                                              4.0%
 Increasing per capita                         Improving Shanghai CBD
 disposable income of urban                    office rental index            2.0%
 households
                                                                              0.0%
 +8.7% (1H16, YoY)                             +7.5% (2Q16, YoY)                      2012      2013       2014    2015     1Q2016   2Q2016

 Source: Beijing Statistical Information Net   Source: JLL

                                                                                                                                              P.23
Healthy Balance Sheet through
Strong Capital Management
Diverse funding sources Committed debt
5 1
Mar-16 maturity (1)
HK$’B
22.0% 19.9%
1. Bank loans – revolving 6.9
5.0 years
Total 2. Bank loans – term 6.4 Total debt
4 committed 2
3. MTN – listed 3.9 HK$27.0B Effective interest
facilities (all unsecured) rate (1)
18.5% 4. MTN – unlisted 9.8
HK$ 34.6B
28.3% 5. Undrawn facilities 7.6 2.57%
3
11.3%
Asia’s first
property company
Extending maturity with longer tenor debt (1) (2) to issue Green
Bond
5.2 5.3
5
4
4.5
3.9
US$500M
3 3.4 4.9 2.5 in July 2016
2 4.2 1.1 3.9
1 1.5 1.7 1.3
1.0 1.1 1.4 1.2 0.9 1.0
0.5 0.7
0 0.3 0.1 0.1 0.4
FY2016/2017 2017/2018 2018/2019 2019/2020 2020/2021 2021/2022 2022/2023 2023/2024 2024/2025 2025/2026 2026/2027 2027/2028 2028/2029 2029/2030
MTN Bank loans Undrawn facilities
Notes:
(1) As at 31 March 2016. P.24
(2) All amounts are face value.Focus on Strategic Priorities and Execution
1
• Enhance quality through Management guidance
Building a More improving management and
Productive and Higher innovation
Quality Portfolio Portfolio Mix
• Target stable growth for NPI
2 Core Market Hong Kong
Maintaining a Prudent • Maintain optimal credit ratings
and Flexible Capital Mainland China (1) Below 12.5%
Structure • Increase capital efficiency
Office (1) Below 12.5%
3
• Retain and develop talent Property In HK only and
Developing a Strong
Management Team • Promote diversity and development (2) below 10%
inclusiveness
Capital Management
4 Helping our Tenants • Provide a platform to grow Ensure attractive cost of funding
and Communities with tenants
Grow while Delighting • Extend the reach and impact Gearing ratio (3) Below 25%
Shoppers of Link Together Initiatives
Notes:
(1) By value of total portfolio.
(2) Investment cap for property development is 10% of gross asset value as stipulated in the HK REIT Code.
(3) Regulatory limit for gearing ratio is 45% under HK REIT Code. P.25Appendix
Additional Data 1:
Income Statement Summary
                                                                                      Year ended                  Year ended
                                                                                     31 Mar 2016                 31 Mar 2015                      YoY
                                                                                          HK$’M                       HK$’M                         %
   Revenue (1)                                                                                 8,740                       7,723                  13.2
   Property operating expenses                                                               (2,227)                     (2,054)                   8.4
   Net property income                                                                         6,513                       5,669                  14.9
   General and administrative expenses                                                         (368)                       (437)              (15.8)
   Interest income                                                                                   6                         32             (81.3)
   Finance costs on interest bearing liabilities                                               (508)                       (359)                  41.5
   Gain on disposal of investment properties                                                     396                         445              (11.0)
   Profit before taxation, change in fair values of
    investment properties and transactions with                                                6,039                       5,350                  12.9
    Unitholders
   Change in fair values of investment properties                                            11,263                      22,699               (50.4)
   Taxation                                                                                    (953)                       (819)                  16.4
   Non-controlling interest                                                                      (54)                            -                N/A
   Profit for the year, before transactions with
                                                                                             16,295                      27,230               (40.2)
   Unitholders
Note:
(1) Revenue recognised during the year comprise retail and commercial properties rentals of HK$6,506M, car parks rentals of HK$1,846M and other
    revenues of HK$388M.                                                                                                                            P.27
Additional Data 2:
Distribution Statement Summary
Year ended Year ended
31 Mar 2016 31 Mar 2015 YoY
HK$’M HK$’M %
Profit for the year, before transactions with Unitholders 16,295 27,230 (40.2)
Change in fair values of investment properties
(11,209) (22,699) (50.6)
attributable to Unitholders
Deferred taxation on change in fair values of
24 - N/A
investment properties attributable to Unitholders
Other non-cash income (101) (46) 119.6
Depreciation charge on investment properties under
(67) - N/A
China Accounting Standards
Gain on disposal of investment properties, net of
(375) (421) (10.9)
transaction costs
Total distributable income 4,567 4,064 12.4
Discretionary distribution 67 128 (47.7)
(1)
Total distributable amount 4,634 4,192 10.5
Distribution per unit (HK cents) 206.18 182.84 12.8
Note:
(1) Discretionary distribution was related to adjustment for depreciation charge on investment properties under China Accounting Standards during the
year. P.28Additional Data 3:
Financial Position & Investment Properties
Financial Position Summary
As at As at As at
HK$’M 31 Mar 2016 30 Sep 2015 31 Mar 2015
Total Assets 163,452 157,405 143,144
Total Liabilities 36,011 35,209 25,038
Non-controlling interest 54 31 -
Net Assets Attributable to Unitholders 127,387 122,165 118,106
Units in Issue (M) 2,243.1 2,252.5 2,291.8
Net Asset Value Per Unit $56.79 $54.24 $51.53
Fair Value of Investment Properties
As at As at As at
HK$’M 31 Mar 2016 30 Sep 2015 31 Mar 2015
At beginning of period / year 138,383 138,383 109,899
Acquisition 10,974 (1) 10,974 1,320
Exchange adjustments (225) (49) -
Additions 1,594 658 6,969
Disposals (1,317) - (2,504)
Change in fair values of investment properties 11,263 5,785 22,699
160,672 155,751 138,383
Reclassify to “Investment properties held for sale” (3,060) (1,317) -
At end of period / year 157,612 154,434 138,383
Note:
(1) Represents acquisitions of EC Mall in Beijing and Corporate Avenue 1 & 2 in Shanghai. P.29Additional Data 4:
Valuation
As at As at
HK$’M 31 Mar 2016 31 Mar 2015
Retail properties 114,492 107,326
Car parks 28,888 25,177
Property under development 6,300 5,880
Properties in Mainland China 10,992 -
Total 160,672 138,383
Income Capitalisation Approach – Capitalisation Rate
Hong Kong
Retail properties 3.40 – 5.20% 3.40 – 5.20%
Retail properties: weighted average 4.54% 4.57%
Car parks 3.80 – 6.00% 3.80 – 6.00%
Car parks: weighted average 4.78% 4.78%
Overall weighted average 4.59% 4.61%
Mainland China(1)
Retail properties 4.50 – 5.00% N/A
Office properties 4.00% N/A
DCF Approach – Discount Rate
Hong Kong 7.50% 7.50%
Mainland China (1)
Retail properties 8.00 – 9.00% N/A
Office properties 7.50% N/A
Independent valuer: CBRE
Note:
(1) Acquisitions of EC Mall in Beijing and Corporate Avenue 1 & 2 in Shanghai were completed on 1 April 2015 and 31 August 2015, respectively. P.30Additional Data 5:
HK Portfolio - Revenue Analysis
Percentage
Year Year contribution
ended ended Year ended
31 Mar 2016 31 Mar 2015 YoY 31 Mar 2016
HK$’M HK$’M % %
Retail rentals:
Shops (1) 4,974 4,638 7.2 59.8
Markets / Cooked Food Stalls 805 767 5.0 9.7
Education / Welfare and Ancillary 147 145 1.4 1.8
Mall Merchandising 169 161 5.0 2.0
Car park rentals:
Monthly 1,381 1,224 12.8 16.6
Hourly 465 432 7.6 5.6
Expenses recovery and other miscellaneous revenue:
Property related revenue (2) 378 356 6.2 4.5
Total 8,319 7,723 7.7 100.0
Notes:
(1) Rental from shops includes turnover rent of HK$134 million (2015: HK$169 million).
(2) Including other revenue from retail properties of HK$374 million (2015:HK$353 million) and car park portfolio of
HK$4 million. (2015:HK$3 million). P.31Additional Data 6:
HK Portfolio - Expenses Analysis
Percentage
Year Year contribution
ended ended Year ended
31 Mar 2016 31 Mar 2015 YoY 31 Mar 2016
HK$’M HK$’M % %
Property managers’ fees, security
580 554 4.7 27.4
and cleaning
Staff costs 365 381 (4.2) 17.2
Repair and maintenance 213 201 6.0 10.1
Utilities 298 300 (0.7) 14.1
Government rent and rates 271 236 14.8 12.8
Promotion and marketing expenses 117 108 8.3 5.5
Estate common area costs 118 113 4.4 5.6
Other property operating expenses 155 161 (3.7) 7.3
Total property expenses 2,117 2,054 3.1 100.0
P.32Additional Data 7:
HK Portfolio - Retail Properties by Valuation
Retail Average monthly
Valuation rentals unit rent Occupancy rate
HK$’M HK$’M HK$ psf %
Year ended As at As at As at As at
No. of As at 31 Mar 31 Mar 31 Mar 31 Mar 31 Mar
properties 31 Mar 2016 2016 2016 2015 2016 2015
(1)
Destination 6 21,463 1,044 70.8 62.3 97.3 96.7
Community 38 58,590 3,013 60.8 55.8 97.0 96.2
Neighbourhood 95 34,439 1,998 34.9 32.8 94.8 93.3
5 properties
disposed in Dec - - 40 - 25.1 - 91.9
2015
Overall 139 114,492 6,095 50.0 45.4 96.0 94.8
Note:
(1) Temple Mall North (formally Lung Cheung Plaza), Temple Mall South (formerly Wong Tai Sin Plaza) and H.A.N.D.S
(formerly On Ting Commercial Complex and Yau Oi Commercial Centre) have been merged together, rebranded and are considered as 2 destination
shopping centres. P.33Additional Data 8:
HK Portfolio - Retail Trade Mix by Monthly Base Rent
As at As at
31 Mar 2016 31 Mar 2015
% %
Food and Beverage 26.4 25.2
Supermarket and Foodstuff 21.9 22.8
Markets / Cooked Food Stalls 14.1 14.1
Services 10.7 11.1
Personal Care/ Medicine 6.3 6.1
Education / Welfare and Ancillary 1.2 1.3
Valuable Goods (Jewellery, Watches and Clocks) 0.7 0.6
Others (1) 18.7 18.8
Total 100.0 100.0
Note:
(1) Including clothing, department store, electrical and household products, optical, books and stationery, newspaper, leisure and entertainment. P.34Additional Data 9:
HK Portfolio - Portfolio Metrics
As at As at
31 Mar 2016 31 Mar 2015 Change
Average monthly unit rent (psf pm)
Shops HK$ 50.6 HK$ 45.7 10.7%
Overall (ex Self use office) HK$ 50.0 HK$45.4 10.1%
Occupancy rate
Shops 97.1% 96.5% 0.6ppts
(1)
Markets/Cooked Food Stalls 89.1% 86.4% 2.7ppts
Education/Welfare and Ancillary 92.4% 87.2% 5.2ppts
Overall 96.0% 94.8% 1.2ppts
Year ended Year ended YoY
31 Mar 2016 31 Mar 2015 Change
Composite reversion rate
Shops 29.0% 23.3 % 5.7ppts
(1)
Markets/Cooked Food Stalls 10.4% 12.0% (1.6)ppts
Education/Welfare and Ancillary 14.3% 20.0% (5.7)ppts
Overall 25.9% 22.0 % 3.9ppts
Net property income margin 74.6% 73.4 % 1.2ppts
Car park income per space per month HK$ 2,022 HK$ 1,767 14.4%
Note:
(1) Despite a slower increase in reversion due to partnership with experienced fresh market operators, improvements in occupancy and cost savings
have been observed. P.35Additional Data 10:
HK Portfolio - Lease Expiry Profile
As % of total area As % of monthly rent
As at 31 March 2016 % %
2016/17 26.8 30.6
2017/18 23.4 27.5
2018/19 24.0 21.4
2019/20 4.9 4.4
2020/21 and beyond 10.4 11.4
Short-term Lease and Vacancy 10.5 4.7
Total 100.0 100.0
P.36Additional Data 11:
Key Credit Metrics by Rating Agencies
As at As at S&P Moody’s
31 Mar 16 (3) 31 Mar 15 (3) (A / Stable) (A2 / Stable)
Total debt / total assets 16.5% 11.9% N/A < 30%
Debt / debt and equity (1) 17.5% 10.9% < 35% N/A
FFO (2) / debt 17.8% 29.6% > 15% N/A
EBITDA interest coverage 10.0 x 13.6x N/A > 3.5x
Total debt / EBITDA 4.4 x 3.2x N/A < 5.0x
Notes:
(1) Equity is equal to net assets attributable to Unitholders.
(2) Funds from operations is calculated by net cash generated from operating activities with adjustments for operating lease expense, interest
expenses and income.
(3) Figures based on reports of rating agencies. P.37Additional Data 12:
Credit Profile – Strong Credit Metrics
Total Debt (1) / Total Asset Total Debt / EBITDA
>30% – Moody’s rating trigger >5.0x – Moody’s rating trigger
4.4x
16.0% 16.5%
13.6%
11.0% 11.9% 3.2x 3.2x
3.0x
2.5x
11/12 12/13 13/14 14/15 15/16 11/12 12/13 13/14 14/15 15/16
EBITDA Interest Coverage Funds from Operations (2) / Total Debt
13.6x
12.6x 39.3%
10.0x 10.0 x 32.2%
27.8% 29.6%
8.6xAdditional Data 13:
Year-on-year Change of HK Retail Sales Value
Year-on-Year Change of Retail Sales Value
60%
Global financial crisis
50%
Foods & alcoholic
40% drinks
Supermarkets
30% Tech bubble burst
20% Restaurant receipts
10%
Jewellery
0%
92 93 94 95 96 97 98 99 00 01 02 03 04 05 06 07 08 09 10 11 12 13 14 15 1Q 2Q Department stores
-10% 16 16
Clothing
-20%
SARS outbreak
-30%
-40%
Asian financial crisis
Source: Census & Statistics Department P.39Additional Data 14:
District Revitalisation will Re-energise Mong Kok
Existing/completed Future improvement/
revitalisation MOKO revitalisation plans
URA 600-626 Greening and Streetscape
Shanghai Street Improvement
Project
(Preservation of Mong Kok Footbridge
heritage buildings ) Identity Project
(Improve physical
URA Sai Yee Street/ 700 Nathan
appearance of the
Fa Yuen Street Project Road
footbridge)
(Residential/specialty
sports-related retail)
Sai Yee Street
Redevelopment Project
MacPherson Place (Government offices to be
(Residential, relocated in 2017-2018 with
playground and demolition works to be
stadium) completed by 2019)
Langham Place
(Retail/office) Mong Kok Footbridge
Extension
Source: Planning Department P.40Additional Data 15:
Kowloon East Office Market Update
Kowloon East single-owned office Rental gap between Central and
vacancy rate comparable to Central Kowloon East expected to narrow
120
Overall HK: 3.3%
Central: 1.4% 100
HKD per sq ft per month, NFA
5.2%
Kowloon East: 5.2%
1Q2016 Vacancy rate
(Single ownership:1.8% 80
HK$ 71
0.8% Strata-titled: 10.7%)
60
1.4% 40
20
3.3%
0
4Q11
4Q07
4Q08
4Q10
4Q12
4Q13
4Q14
4Q15
4Q09
0% 2% 4% 6% 8% 10%
Vacancy Rate
Kowloon East Hong Kong East Central Overall Overall Central Hong Kong East Kowloon East
Source: JLL, 1Q2016
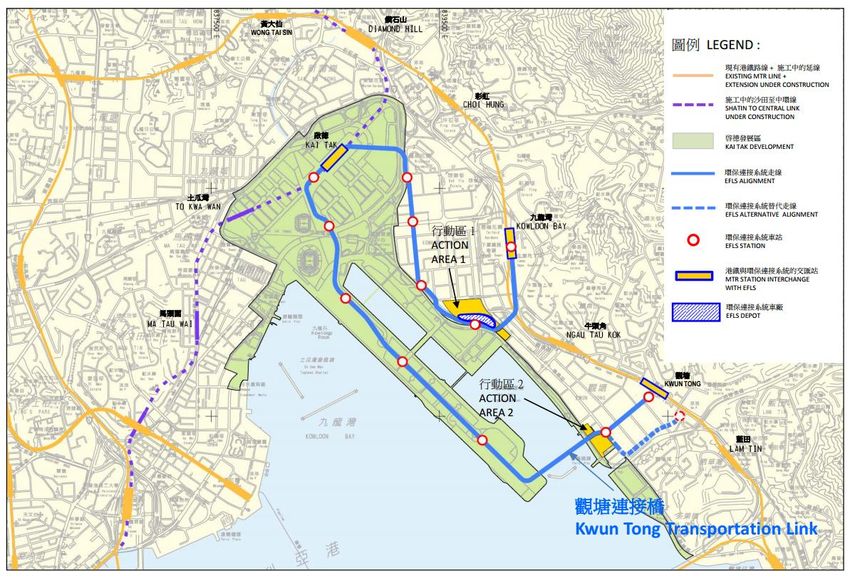
P.41Additional Data 16: Kowloon East - Environmentally Friendly Linkage System to enhance connectivity Source: Energizing Kowloon East Office P.42
Additional Data 17:
Kowloon East Action Area
Preliminary Outline Development Plan
                                         82,100m2          Land use                    GFA (sqm)             %
                                          Link’s project
                                                           Office                           287,500      58%
                                                           Retail / F&B /                   117,200      23%
                                                           Entertainment
                                                           Hotel                             74,400      15%
                                                           Others (1)                        20,200          4%
                                                           Total                            499,300
                                                           Note:
                                                           (1) Including SME Business Showcase Space and
                                                           Support Centre, CC&T Use / Urban Farming / Food
                                                           Workshop and Transport Facility (excluding
                                                           Environmentally Friendly Linkage System) .

Source: Energizing Kowloon East Office                                                                       P.43
Additional Data 18:
Office Supply in Shanghai Core CBDs
Direct comparables to
Corporate Avenue 1 & 2
Source: DTZ Cushman & Wakefield, May 2016 P.44Additional Data 19:
Land Utilisation in Hong Kong 2014
0.6%
2.7% Woodland/Shrubland/Grassland/Wetland
6.9%
0.4% Agriculture
2.3%
2.3% Other Urban or Built-up Land
2.3%
Transportation
5.1%
Open Space
4.8% Institutional
Industrial
6.1%
66.5% Commercial
Residential
Water Bodies
Barren Land
Very limited land for commercial use in Hong Kong
Source: Planning Department, HKSAR P.45Additional Data 20:
Top retail-focused REITs in the world
US$B
80.0
70.0 67.8
60.0
50.0
40.0
30.0 27.3 25.9
19.9
20.0 16.9 16.3 16.0
12.6 11.8 11.4
8.7 7.7
10.0 6.7 5.8 5.6 5.6 4.7
2.4
0.0
Link is the largest REIT in Asia
Note: Comparison of selected major REITs in the world based on market capitalisation.
Source: Bloomberg as of 31 August 2016Additional Data 21:
Expanded business model
To secure long-term growth trajectory
FUTURE
Improve asset quality PROPERTY
+ RE-
DPU growth DEVELOPMENT
NEW
ASSET PROPERTY
DISPOSAL DEVELOPMENT
ASSET ASSET ASSET
MANAGEMENT ENHANCEMENT ACQUISITION
CORE
P.47Disclaimer
This document has been prepared by Link Asset Management Limited in its capacity as the Manager (the “Manager”) of Link Real Estate
Investment Trust (“Link REIT”) solely for use at the presentations/meetings held and may not be reproduced or redistributed without
permission. Neither this document nor any copy may be taken or transmitted into or distributed, directly or indirectly, in the United States or
to any U.S. person (within the meaning of Regulation S under the United States Securities Act of 1933, as amended). Neither this document
nor any copy may be taken or transmitted into or distributed or redistributed in Canada or to the resident thereof. The distribution of this
document in other jurisdictions may be restricted by law and persons into whose possession this document comes should inform
themselves about, and observe any such restrictions. By attending this presentation/meeting, you are deemed to agree to be bound by the
foregoing restrictions and represent that you have understood and accepted the terms of this disclaimer. Any failure to comply with these
restrictions may constitute a violation of applicable securities laws.
All information and data are provided for reference only. All opinions expressed herein are based on information available as of the date
hereof and are subject to change without notice. The slides forming part of this document have been prepared solely as a support for oral
discussion about Link REIT. No representation or warranty, express or implied, is made as to, and no reliance should be placed on, the
fairness, accuracy, completeness or suitability of any information or opinion contained herein. None of Link REIT, the Manager, or any of its
directors, officers, employees, agents or advisors shall be in any way responsible for the contents hereof, nor shall they be liable for any loss
arising from use of the information contained in this presentation or otherwise arising in connection therewith.
This document may contain forward-looking statements. The past performance of Link REIT is not necessary indicative of the future
performance of Link REIT and that the actual results may differ materially from those set forth in any forward-looking statements herein.
Nothing contained in this document is, or shall be relied on, as a promise or forecast as to the future.
This document does not constitute an offer or invitation to purchase or subscribe for any securities of Link REIT and neither any part of it
shall form basis of or be relied upon in connection with any contract, commitment or investment decision whatsoever. No action has been
taken or will be taken by Link REIT, the Manager or any of its directors, officers, employees, agents or advisers, to register this document as
an offering document or otherwise to permit public distribution of this document.
P.48You can also read