Port Terminals 2018 - Transnet
←
→
Page content transcription
If your browser does not render page correctly, please read the page content below
A
         A

U       D

        Port Terminals 2018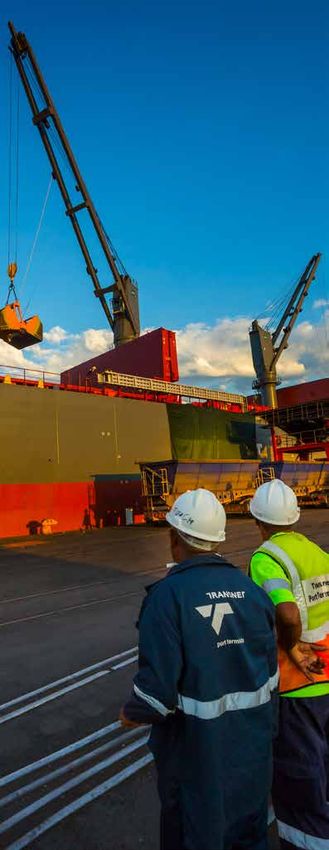
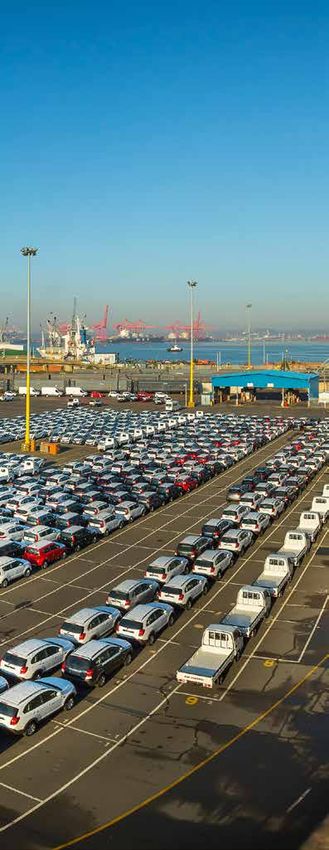
TRANSNET Port Terminals         2

Highlights
• Revenue grew by 11% to R12,4 billion
• Container and automotive volumes performed well and
  exceeded their budgets by 4%
• EBITDA increased by 10% to R4,2 billion
• R1,4 billion was spent on capacity creation and maintenance
  projects during the 2018 financial year
• The Durban Container Terminal (DCT) Pier 2 received
  23 replacement straddle carriers to improve reliability of
  the fleet and operational efficiencies
• The container terminals maintained their train turnaround
  times below the targeted four hours in 2018 while the bulk
  terminals maintained their train turnaround times below the
  targeted 109 minutes at Saldanha, 11 hours at Richards Bay
  and 12 hours at Port Elizabeth
• A total of 1 589 employees were trained on Lean Six Sigma to
  improve operational efficiencies and safety in the workplace

Business overview
Transnet Port Terminals (Port Terminals) is South Africa’s leading
operator of container, dry bulk, break-bulk and automotive
terminals. Through its strategic role in the management of these
key trading hubs, Port Terminals ensures year-round
connectivity of the South African economy with other major
global economic powerhouses. As a vital facilitator of trade
between the South African and global markets, Port Terminals
continuously strives to improve the reliability and efficiency of
its operations through holistic business innovation in order to
reduce business costs.

Port Terminals operates container terminals at the ports of
Durban, Ngqura, Port Elizabeth and Cape Town. The division
currently has a cumulative annual capacity of more than 6
million twenty-foot equivalent units (TEUs). The Durban and
Cape Town container terminals are operating close to capacity,
however, plans are in place to increase the capacity in these
regions.

Operations within the bulk sector are characterised by handling
dry bulk commodities through a network of conveyor belts,
tipplers, stackers, reclaimers and ship loading and unloading
equipment. Port Terminals handles mineral bulk at the ports of
Richards Bay, Port Elizabeth and Saldanha, and handles
agricultural bulk commodities at the ports of Durban and East
London.

Port Terminals handles steel, timber, granite, project cargo,
abnormal and other commodities through its break-bulk
operations in multi-purpose terminals at all seven ports. In some
instances, traditional bulk cargo can be handled at break-bulk
terminals utilising a skip operation.

Port Terminals operates automotive terminals at the ports of
Durban, East London and Port Elizabeth. These facilities handle
a variety of vehicles driven onto and off the vessel.

Port Terminals will become one of the top five global port
terminal operators by 2022. This will be achieved through a
strong, unifying vision supported by a high-performance culture
to achieve:
• Financial sustainability and growth;
• Operational excellence supported by predictable, reliable and
  efficient terminal-handling services;
• A cohesive port ecosystem that is integrated, efficient,
  sustainable and customer focused; and
• Proactive planning across the ecosystem to achieve
  operational excellence and financial growth.
TRANSNET Port Terminals        3

                                                                       Beit Bridge

                                                                  LIMPOPO

                                                                                           Maputo
                                                     GAUTENG             MPUMALANGA
                                 NORTH
                                 WEST

                                 Sishen
                                                                                                                      Transnet Corporate Centre
                                                     FREE STATE
                                                                              KWAZULU-   Richards Bay                 Johannesburg
                                                                              NATAL

                                                                            Durban

                 NORTHERN CAPE                                                                                        Port Terminals
                                                          EASTERN CAPE                                                Richards Bay, Durban, East
                                                                                                                      London, Ngqura, Port Elizabeth,
                                                                                                                      Saldanha, Cape Town
Saldanha                                                 East
                                                       London
                  WESTERN                 Ngqura
                   CAPE
 Cape Town                  Mossel Bay        Port
                                         Elizabeth

Regulatory environment                                                                        During the 2018 financial year there was a deterioration in weather
                                                                                              conditions with heavy winds and storms having a significant impact
The National Ports Act, No 12 of 2005 (Ports Act) is the enabling                             on operations.
legislation for Transnet Port Terminals and promulgates the
parameters within which terminals operate in South Africa. With 21                            Revenue for the year was R12,4 billion against a target of
Terminal Operator licences across South Africa, Port Terminals has                            R12,2 billion, and EBITDA met its target of R4,2 billion.
developed a Compliance Risk Management Plan, as well as a
Critical Control Framework and Control Self Assessments (CSAs)
for the Ports Act. The CSAs are rolled out across the business                                Operational performance
biannually, and ensure compliance with the Ports Act and Terminal
Operator licences. Port Terminals submits annual reports on                                   Core initiatives for 2018
operations, performance, finance, SHEQ and competition to
                                                                                              • Target EBITDA of R4,15 billion in 2018
Transnet National Ports Authority, which then conducts mandatory
annual audits on all the terminals.                                                           • Investment of R1,6 billion in new and existing port infrastructure
                                                                                              • Volume targets for the 2018 financial year:
                                                                                                –– Containers: 4,5 million TEUs
Performance context                                                                             –– Bulk cargo: 92,1 million tons
                                                                                                –– Break-bulk cargo: 12 million tons
During the year under review, most sectors experienced a slow
start to the year, however, market conditions picked up in the                                  –– Automotive units: 677 572 units
middle of the year, ending the year on a high. Manganese
performed well throughout the year due to increased international
demand, while magnetite and automotive volumes declined in the
second half of the year.
TRANSNET Port Terminals 4
Overview of key performance indicators
2017 2018 2018 2019
Key performance area and indicator Unit of measure Actual Target Actual Target
Financial sustainability
Revenue R million 11 150 12 190 12 393 13 439
EBITDA R million 3 794 4 153 4 172 4 637
Operating profit margin % 20,7 18,1 19,9 20,7
Return on average total assets % 13,3 12,4 15,5 16,5
Revenue per employee (permanent) R million 1,6 1,5 1,7 1,7
Average tariff increase
– Containers % 7,63 6,4 5,4 6,0
– Automotive % n/a 6,4 7,1 6,0
Capacity creation and maintenance
Capital expenditure1 R million 1 208 1 582 1 365 2 722
Operational excellence
Volume growth
Containers ‘000 TEUs 4 396 4 496 4 664 4 625
Break-bulk mt 10,0 12,0 11,2 19,5
Bulk mt 88,05 92,1 91,0 86,5
Vehicles units 679 792 677 572 704 052 725 401
Container dwell time
DCT – Pier 1
Imports days 2,7 ≤3 3,1 ≤3
Exports days 4,7 ≤5 5,3 ≤5
Transshipments days 5,4 ≤10 6,6 ≤10
DCT – Pier 2
Imports days 2,2 ≤3 2,5 ≤3
Exports days 5,5 ≤5 6,1 ≤5
Transshipments days 5,9 ≤10 7,8 ≤10
Cape Town Container Terminal (CTCT)
Imports days 2,2 ≤3 2,7 ≤3
Exports days 4,3 ≤5 5,8 ≤5
Transshipments days 7,15 ≤15 7,2 ≤15
Moves per gross crane hour
DCT – Pier 1 number 26 26 25 26
DCT – Pier 2 (prime berths – 108, 203 204) number 24 32 23 32
CTCT number 32 33 30 33
Port Elizabeth number 25 25 23 25
Ngqura Container Terminal (NCT) number 31 32 25 32TRANSNET Port Terminals 5
2017 2018 2018 2019
Key performance area and indicator Unit of measure Actual Target Actual Target
Container moves per ship working hour
DCT – Pier 1 number 45 53 46 50
DCT – Pier 2 number 55 70 53 65
CTCT number 53 56 45 56
Port Elizabeth number 45 36 37 36
NCT number 63 66 50 66
Train turnaround time
DCT – Pier 1 hours 2,9 ≤4 2,4 4
DCT – Pier 2 hours 3,5 ≤4 2,2 4
CTCT hours 1,0 ≤4 1,1 4
NCT hours 3,8 ≤4 3,9 4
Saldanha minutes 112 ≤109 105 109
Richards Bay hours 8,4 ≤11 8,4 11
Port Elizabeth hours 9,8 ≤12 7,9 12
Truck turnaround time
DCT – Pier 1 minutes 37 ≤35 35 35
DCT – Pier 2 minutes 79 ≤35 72 35
CTCT minutes 21 ≤35 36 35
NCT minutes 32 ≤35 36 35
Richards Bay Multi-Purpose Terminal (Bulk) minutes 25 ≤35 22 35
Loading rate (per hour)
Saldanha Iron Ore Terminal2 tons 8 564 8 094 8 576 8 100
Richards Bay Dry Bulk Terminal (RB DBT) – Loading tons 752 800 785 n/a
RB DBT – Unloading tons 405 500 391 n/a
Sustainable developmental outcomes
Employment
Employee headcount3 total 8 891 8 194 8 816 8 132
Health and safety
Disabling injury frequency rate (DIFR) rate 0,71 ≤0,71 0,67 0,70
1
Capital expenditure excludes capitalised borrowing costs.
2
Dual loading rate.
3
Total employee headcount includes fixed-term contract employees.TRANSNET Port Terminals 6
Financial performance review
Year ended Year ended
31 March 31 March
2018 2017 %
Salient features R million R million change
Revenue 12 393 11 150 11,1
– Containers 6 287 5 722 9,9
– Dry bulk 3 522 3 315 6,2
– Break–bulk 1 816 1 455 24,8
– Automotive 768 658 16,7
Operating expenses (8 221) 7 356 11,8
– Energy costs (617) (522) 18,2
– Maintenance (379) (332) 14,2
– Materials (481) (419) 14,8
– Personnel costs (4 412) (3 924) 12,4
– Other (2 332) (2 159) 8,0
Profit from operations before depreciation, derecognition,
amortisation and items listed below (EBITDA) 4 172 3 794 10,0
Depreciation, derecognition and amortisation (1 705) (1 481) 15,1
Profit from operations before items listed below 2 467 2 313 6,7
Impairments and fair value adjustments (249) (684) (63,6)
Net finance costs (252) (396) (36,4)
Profit before taxation 1 966 1 234 59,3
Total assets (excluding CWIP) 15 396 16 638 (7,5)
Profitability measures
EBITDA margin1 % 33,7 34,0 (0,1)
Operating margin2 % 19,9 20,7 (0,4)
Return on average total assets (excluding CWIP)3 % 15,5 13,3 16,5
Asset turnover (excluding CWIP)4 times 0,8 0,64 25,0
Capital investments5 1 365 1 208 13,0
Employees
Number of employees (permanent) number 7 096 7 087 0,1
Revenue per employee 1,75 1,57 11,5
1
EBITDA expressed as a percentage of revenue.
2
Profit from operations before impairment of assets, fair value adjustments, net finance costs and taxation expressed as a percentage of revenue.
3
Profit from operations before impairment of assets, fair value adjustments, net finance costs and taxation expressed as a percentage of average total assets,
excluding capital work-in-progress (CWIP).
4
Revenue divided by average total assets, excluding CWIP.
5
Actual capital expenditure (replacement plus expansion), excluding borrowing costs and including capitalised decommissioning liabilities.
Performance commentary • As a result of the above, EBITDA increased by 10% to R4,2 billion
(2017: R3,8 billion) meeting the 2018 target. The EBITDA margin
Financial sustainability decreased marginally from 34,0% to 33,7% in 2018.
• Return on average total assets increased from 13,3% to 15,5%
• Revenue grew by 11% to R12,4 billion (2017: R11,2 billion), in 2018. This is as a result of higher than budgeted operating
exceeding the budget by 1,7%. This was as a result of good profits as well as lower average assets, which were impacted by
volume performance and higher revenue achieved in the lower capital spend and asset impairment.
automotive and break-bulk sectors.
• Net operating expenses grew by 11,8% to R8,2 billion from the
prior year (2017: R7,4 billion). While costs have been tightly Looking ahead
managed, some of the key drivers of the higher costs were: • Port Terminals anticipates an increase in revenue of 8,4% to
–– Energy, which increased by 22% on the back of above- R13,4 billion in the 2019 financial year.
inflation price increases as well as significant volume growth • There will be strong focus on operations and supply chain
across all sectors; and efficiency enhancements in order to unlock capacity in the bulk
–– Additional repairs and maintenance spend of 14% on ageing sectors, promote additional export channels for manganese and
bulk and other operating equipment as well as equipment that optimise service delivery within the Durban Container precinct
was damaged during the October storm in Durban.TRANSNET Port Terminals 7 Capacity creation and maintenance • Capital expenditure for the year was R1,4 billion – 13% below the budget of R1,6 billion due to underspend in the Port Elizabeth manganese plant refurbishment as well as a delay in award for the execution of the C01 conveyor at Richards Bay. • The Port Elizabeth Bulk Terminal plant conveyors and stacker reclaimers underwent a partial refurbishment to enable continued operations until 2022. • DCT Pier 2 received 23 replacement straddle carriers to improve the fleet reliability and operational efficiencies. • DCT also received 29 hauler and trailer combinations to enable indirect operations at the terminal. Looking ahead The planned seven-year capacity creation projects to facilitate volume growth include the following: • The Cape Town phase 2B project, which involves resurfacing work and the creation of a truck staging area and ancillary works, will increase the terminal’s capacity by 0,4 million TEUs, from 1,0 million TEUs to 1,4 million TEUs. • The introduction of mobile ship loaders at the Saldanha Multi-Purpose Terminal will increase its capacity from 8,7 million tons per annum (mtpa) to 10 mtpa. • The development of a dedicated bulk export terminal at Ngqura will create capacity to handle 12 mtpa of manganese. • The berth deepening and lengthening at the North Quay of DCT Pier 2 will restore berth capacity to 2,9 million TEUs. • Capacity in East London’s automotive terminal will be increased by 25 000 units per year. • Berth 702 at the Richards Bay Dry Bulk Terminal (RB DBT) will be converted from an import to an export berth in order to cater for higher export volumes. • A combination of a third tippler and a multi-purpose ship loader at the RB DBT will boost dry bulk exports by an additional 4 mtpa. Market segment competitiveness Containers • Container volumes performed well, exceeding the budget for the year under review by 4% and increasing by 6,1% year on year. • Imports, exports and transshipments were 2%, 6% and 4% above budget respectively. • The global economic upswing boosted volumes, resulting in increased demand for containerised goods. • The Durban terminals had a slow start to the year and suffered a temporary reduction in capacity following the storm that hit the port in October 2017 but the terminals recovered well in the final quarter of the year to exceed the budgeted volumes. • The Port Elizabeth and Ngqura container terminals have significantly outperformed their expected volumes as a result of increased transshipment volumes. • CTCT has been severely impacted by deteriorating weather conditions, with some customers opting to bypass the terminal, which resulted in the terminal’s volumes falling 11% below the budget. Bulk • Volumes in the bulk sector performed 1% below budget for the year. Bulk export commodities were negatively impacted by changing market conditions due to changes in demand. • Manganese volumes performed well, exceeding expected volume throughput by 19%. This was primarily driven by increased international demand for the commodity and significant volumes being exported through Saldanha.
TRANSNET Port Terminals       8

• Iron ore volumes were 1% below budget as a result of adverse        • Collaborate closely with Freight Rail and National Ports
  weather conditions, derailments and supply challenges.                Authority to improve operational efficiencies and strengthen
• Coal volumes were 12% below budget due to unfavourable                Port Terminals’ position as a gateway terminal to serve both
  demand at the beginning of the year despite markets picking up        local and regional economies;
  in the latter part of the year.                                     • Provide integrated and competitive pricing structures to attract
• Magnetite volumes were 31% below budget having been                   and maintain market share;
  negatively affected by unfavourable commodity prices and high       • Develop competitive value propositions to provide customers
  freight costs. Limited demand and adverse weather conditions          with complete logistics solutions through supply chain
  further impacted volumes.                                             integration;
• Chrome volumes were 2% below budget. Volumes were negatively        • Commence the project to deepen and lengthen the North Quay
  impacted by unfavourable market conditions and lower commodity        at DCT Pier 2 in conjunction with the National Ports Authority.
  prices in the first half of the year. Chrome has, however, shown      The terminal will have three deep water berths and a capacity of
  some improvement in the second half of the year.                      2,9 million TEUs upon completion in 2025;
• The agricultural terminals transitioned back from net imports to    • Explore opportunities to partner with the private sector to
  net exports during the year as the South African agricultural         increase maize and wheat volumes in Durban and East London;
  sector recovered from the drought.                                  • Continue to drive volume growth through new business
                                                                        opportunities and optimise existing capacity through improved
                                                                        operational efficiency and reliability; and
Break-bulk
                                                                      • Focus on volume growth and increasing market share in the bulk
• Break-bulk volumes were 7% below budget for the year primarily        and break-bulk segments by exploring new market opportunities.
  due to increased competition from other terminal operators and
  changes in commodity prices.
• Ferromanganese, rock phosphate and coal at the Richards Bay         Operational excellence
  Multi-Purpose Terminal (MPT) performed well due to favourable       • Port Terminals’ primary measure of operational efficiency is
  market conditions and higher commodity prices.                        average moves per SWH. Port Terminals did not achieve the 2018
• Chrome ore and ferrochrome volumes were below budget as               target and the average SWH has declined across most container
  China looked to influence prices by lowering demand.                  terminals compared to the same period last year.
• Steel and general cargo performed well at the Durban MPT,           • DCT’s Pier 1 marginally improved its SWH performance from
  however, due to heightened competition from other terminal            45 to 46 moves despite the impact of the October storm on
  operators this terminal did not meet its expected volumes.            equipment and operations. The SWH at DCT’s Pier 2 declined
• Volumes at the Cape Town MPT were significantly below budget          from 55 in the prior year to 53 moves in 2018. This was primarily
  as a result of fierce competition among the terminal operators.       due to low availability and reliability of key equipment as well as
                                                                        congestion during to the bumper reefer season in the first half
                                                                        of the year. In the latter half of the year, operations were
Automotive                                                              impacted by the severe storm which saw a significant amount of
• Automotive volumes exceeded the budget by 4% due to an                equipment being damaged and a temporary reduction in the
  increase in international demand as the global automotive             terminal’s operational capacity. The terminal recovered from this
  economy recovers.                                                     incident and performance in the last quarter significantly
                                                                        improved.
• Volumes at the Durban Car Terminal were 3% above budget due
  to higher import and transshipment volumes.                         • The Ngqura Container Terminal’s SWH decreased from 63 to
                                                                        50 moves due to limitations in people resources, which is being
• East London Car Terminal volumes were also 3% above budget
                                                                        addressed. The terminal has also experienced a significant
  due to higher export volumes and increased consumer demand.
                                                                        deterioration in weather conditions, which has had a negative
• Port Elizabeth Car Terminal exceeded expected volumes by 8%           impact on operations. The SWH at CTCT declined from 53 to
  despite the withdrawal of General Motors from South Africa.           45 moves in 2018, primarily due to poor weather conditions as
                                                                        well as equipment reliability challenges. Port Terminals will
Looking ahead                                                           focus on weather mitigation strategies to improve and sustain
Volume targets for the 2019 financial year:                             operating performance at Ngqura and Cape Town in 2019.
• Containers: 4,6 million TEUs                                        • The average moves per Gross Crane Hour (GCH) declined by 12%
• Bulk cargo: 86,5 million tons                                         to 25 moves (2017: 28 moves), falling short of the 2018 targets
                                                                        across the container terminals. Some of the key reasons include
• Break-bulk cargo: 19,5 million tons
                                                                        the poor reliability and availability of key operating equipment,
• Automotive units: 725 401 units                                       the impact of the October storm on the Durban terminals’
                                                                        operations and a significant deterioration in weather conditions.
Port Terminals will:
                                                                      • The container terminals maintained their train turnaround time
• Continue to market its complementary network of ports to grow         below the targeted four hours in 2018 while the bulk terminals
  volumes, counter new entrants to the market and increase              maintained their train turnaround times below the targeted
  maritime connectivity;                                                109 minutes at Saldanha, 11 hours at Richards Bay and 12 hours
• Aggressively market transshipments at local, regional and global      at Port Elizabeth.
  levels, while marketing Ngqura and Port Elizabeth as container      • The average truck turnaround time was 40 minutes against a
  and automotive transshipment hubs respectively;                       target of 35 minutes. This adverse variance was attributable to
• Increase the volume (moves/tons/units) per ship working hour          truck turnaround time at DCT Pier 2 which was negatively
  (SWH) to turn vessels around faster and attract shipping lines to     impacted by equipment challenges. The terminal has, however,
  South African ports;                                                  shown signs of improvement in the last quarter. Poor weather
                                                                        conditions also impacted the Cape Town and Ngqura terminals.
TRANSNET Port Terminals 9
Looking ahead • A total of 442 managers and supervisors underwent various
leadership programmes.
Port Terminals will:
• In all, 190 artisans were assessed on outcomes-based modular
• Seek to increase SWH to 55 moves in the 2019 financial year by learning.
focusing on the following efficiency improvements:
• A total of 1 589 employees trained on Lean Six Sigma.
–– Resourcing gangs and supporting equipment to maximise
• Youth programmes:
crane deployment across vessels;
–– 146 apprentices in training;
–– Rolling out Lean Six Sigma principles to improve productivity
in key operational areas; –– 27 young professionals in training; and
–– Employing wind mitigation strategies, such as anti-sway –– 15 engineers in training.
technology on cranes as well as new technology to address
vessel ranging; Health and safety
–– Working collaboratively with shipping lines to optimise
stowage thus enabling higher productivity; • Port Terminals achieved a DIFR of 0,67 against a target of 0,71.
–– Leveraging technology to enable more efficient planning of • Due to Transnet’s decision to implement the Transnet Integrated
vessels; and Management Approach (TIMA), aimed at ensuring consistency
and integration of process for the entire group, NOSA audits
–– Creating a base layer of business intelligence and prescriptive
have been discontinued in most terminals and have only been
analysis of operational statistics.
conducted in the Eastern Cape.
• Maintain truck turnaround time below the target of 35 minutes;
• The Eastern Cape performed as follows:
• Continue engaging customers in an effort to reduce container
–– Ngqura Container Terminal received a NOSCAR with an effort
dwell times and increase capacity;
score of 95,6%;
• Maintain train turnaround times below four hours at the
–– East London Car Terminal received a NOSCAR with an effort
container terminals, 12 hours at the Port Elizabeth Bulk
score of 97,2%;
Terminal, 11 hours at the Richards Bay Dry Bulk Terminal and
below 109 minutes at the Saldanha Iron Ore Terminal; –– East London Multi-Purpose Terminal received a five-star
rating with an effort score of 92,73%;
• Facilitate operational efficiencies across all sectors by
improving the reliability and availability of equipment through –– Port Elizabeth Car Terminal received a NOSCAR with an effort
the implementation of a preventative maintenance strategy as score of 95,49%;
well as leveraging technology, such as the Internet of Things for –– Port Elizabeth Container Terminal received a five-star rating
asset management; with an effort score of 91,05%; and
• Work collaboratively with the National Ports Authority to –– Port Elizabeth Multi-Purpose Terminal received a five-star
minimise the impact of infrastructure projects on operations; rating with an effort score of 91,38%.
• Focus on cultivating an innovative culture and establishing • Port Terminals performed exceedingly well at the Transnet Group
partnerships with other organisations for research and Annual Safety Competition. The Richards Bay Fire Fighting Team
development; and took the third spot in the Fire Fighting Category, the Ngqura
• Focus on enhancing leadership skills at all employee levels to First Aid team took the number two spot in the First Aid
improve accountability and create a high-performance culture. category and Shantal Chetty, a Safety Health and Environment
Representative, took the third spot in the SHE Rep category.
Human capital
Governance and ethics
• Black employees represented 87% of the total employee base
(target: 88%). Social accountability
• Female employees represented 28% of the total employee base • Port Terminals’ employees donated hundreds of pairs of new
(target: 29,7%). school shoes to disadvantaged schools. The Shoes on Feet
• People with disabilities represented 1.3% of the total employee campaign, which was started in 2014 as a tribute to Nelson
base (target: 3,1%). Mandela, has made a difference in the lives of thousands of
• Port Terminals achieved its objective of being rated a Level 2 students across the country.
B-BBEE contributor. • Port Terminals’ employees also donated 5-litre bottles of water
to drought stricken areas across Cape Town.
• The Sustainability Team donated vegetables harvested from the
Organisational readiness
head office vegetable gardens to St Martin’s Children’s Home in
Skills development February 2018.
• The Sustainability Team and employee volunteers spent Arbour
• Port Terminals spent 2,5% (direct, indirect and skills levies cost)
Day at St Monica’s Children and Youth Care Centre in Bluff, south
of its total labour bill on employee training and skills
of Durban, in order to revive the home’s wilted food garden. The
development.
team planted a variety of vegetable seeds and saplings at the
• A total of 925 employees underwent sector-specific training, home, which will produce fresh vegetables for the children.
such as Operator Lifting Equipment, Operator Bulk Handling
• Port Terminals marked 16 Days of Activism against women and
Equipment, Cargo Co-ordinators and Planners (an additional
child abuse with head office employees participating in a march
1 828 employees completed refresher and re-certification
to create awareness.
training).TRANSNET Port Terminals 10
The following table details Port Terminals’ top five risks and the key mitigation activities.
Key risks Mitigating activities
1. Adverse sustainability events leading • Delkor plant refurbishment project
to business discontinuity • FEL 1 business case for Richards Bay desalination plant
• Increase the reverse osmosis plant capacity at Saldanha
2. Labour instability leading to business • Collaborate with financial institutions to offer financial wellness programmes for
discontinuity events employees affected by new shift patterns and the new short-term incentive scheme
• Sign off agreement with labour for new shift patterns
3. C
hanges in regulatory environment with • Richards Bay road weighbridge verification project
regard to the mandatory weighing of cargo • Richards Bay belt scales upgrade project
with compliant weighing instruments, this • Allocate a budget for compliance with the Radio Frequency Spectrum Plan
has required additional capital funding.
• Installation of weighbridges at the container terminals
4. Poor governance leading to financial • Update all outdated standard operating procedures
losses and reputational damage • Implement a follow-up system for line managers to review and act upon declared
information
• Implement the Ethics Management Plan
5. Non-compliance with safety policies • Close out legal compliance and occupational survey findings
and procedures leading to injuries • Appoint a resource per shift to monitor compliance with operator relicensing
and fatalities • Undertake a signage survey
• Fire risk assessment execution (all terminals)
• Implement Transnet Integrated Management Approach (TIMA) procedures
• Internal audits
• Roll out new risk assessment procedure
• Railway safety audits planning
• Audit safety critical controls
• Monitoring the compliance of standard operating procedures training
• Implement the fire prevention strategy for Richards Bay
• Implement behaviour-based system training and awareness campaigns
• Conduct random quarterly compliance monitoring of safety, health and environment
file requirements
Opportunities
• Port Terminals is exploring opportunities to expand its service offerings across the transport value chain. Back of port opportunities are
being explored to create inland terminals and offer warehousing and value-add services in the container, mineral bulk and automotive
segments.
• Port Terminals supports Transnet’s international strategy by applying cargo handling and logistics strengths and capabilities to countries
in Africa.
• Port Terminals is also exploring opportunities to partner with the private sector.
• Port Terminals continues to grow volumes as the South African economy recovers and commodity prices improve.
• The Transnet Value Chain Coordinator strategy continues to facilitate improvements in operational efficiencies and logistics integration
between port and rail. This creates opportunities to shift more cargo from road to rail, which will ease congestion on the roads and reduce
carbon emissions for a more sustainable future.www.transnet.net
You can also read