Cost-Effectiveness of the 2021 IECC for Residential Buildings in Arkansas - July 2021
←
→
Page content transcription
If your browser does not render page correctly, please read the page content below
PNNL-31586

             Cost-Effectiveness of the
             2021 IECC for Residential
             Buildings in Arkansas

             July 2021

             Victor R Salcido
             Yan Chen
             YuLong Xie
             Zachary T Taylor

                           Prepared for the U.S. Department of Energy
                           under Contract DE-AC05-76RL01830

                      Choose an item.
DISCLAIMER
This report was prepared as an account of work sponsored by an agency of the
United States Government. Neither the United States Government nor any agency
thereof, nor Battelle Memorial Institute, nor any of their employees, makes any
warranty, express or implied, or assumes any legal liability or responsibility
for the accuracy, completeness, or usefulness of any information, apparatus,
product, or process disclosed, or represents that its use would not infringe
privately owned rights. Reference herein to any specific commercial product,
process, or service by trade name, trademark, manufacturer, or otherwise does not
necessarily constitute or imply its endorsement, recommendation, or favoring by
the United States Government or any agency thereof, or Battelle Memorial
Institute. The views and opinions of authors expressed herein do not necessarily
state or reflect those of the United States Government or any agency thereof.
PACIFIC NORTHWEST NATIONAL LABORATORY
operated by
BATTELLE
for the
UNITED STATES DEPARTMENT OF ENERGY
under Contract DE-AC05-76RL01830
Printed in the United States of America
Available to DOE and DOE contractors from the
Office of Scientific and Technical Information,
P.O. Box 62, Oak Ridge, TN 37831-0062;
ph: (865) 576-8401
fax: (865) 576-5728
email: reports@adonis.osti.gov
Available to the public from the National Technical Information Service
5301 Shawnee Rd., Alexandria, VA 22312
ph: (800) 553-NTIS (6847)
email: orders@ntis.gov
Online ordering: http://www.ntis.gov
Choose an item.PNNL-31586 Cost-Effectiveness of the 2021 IECC for Residential Buildings in Arkansas July 2021 Victor R Salcido Yan Chen YuLong Xie Zachary T Taylor Prepared for the U.S. Department of Energy under Contract DE-AC05-76RL01830 Pacific Northwest National Laboratory Richland, Washington 99354
PNNL-31586

       Highlights

              The 2021 IECC provides cost-effective levels of energy efficiency
                   and performance for residential buildings in Arkansas

       Moving to the 2021 International Energy Conservation Code (IECC) is cost-effective for both
       single-family and low-rise multifamily residential buildings in Arkansas. The 2021 IECC will
       provide statewide energy savings of 30.2% across all climate zones compared to the current
       state energy code. This equates to $ 760 of annual utility bill savings for the average Arkansas
       household. It will reduce statewide CO2 emissions over 30 years by 6,831,000 metric tons,
       equivalent to the annual CO2 emissions of 1,486,000 cars on the road (1 MMT CO2 = 217,480
       cars driven/year). Updating the state energy code based on the 2021 IECC will also stimulate
       the creation of high-quality jobs across the state. Adopting the 2021 IECC in Arkansas is
       expected to result in homes that are energy efficient, more affordable to own and operate, and
       based on current industry standards for health, comfort and resilience.

       The average expected statewide economic impact (per dwelling unit) of upgrading to the 2021
       IECC is shown in the tables below based on cost-effectiveness and carbon metrics established
       by the U.S. Department of Energy.1

       Consumer Impact
                                                                               Compared to the 2015 IECC
                                     Metric                                       with amendments
        Life-cycle cost savings of the 2021 IECC                                       $17,602
        Net annual consumer cash flow in year 1 of the 2021 IECC2                        $552
        Annual (first year) energy cost savings of the 2021 IECC ($)3                       $760
                                                                       4                   30.2%
        Annual (first year) energy cost savings of the 2021 IECC (%)

       1
         A weighted average is calculated across building configurations and climate zones.
       2
         The annual cash flow is defined as the net difference between annual energy savings and annual cash
       outlays (mortgage payments, etc.), including all tax effects but excluding up-front costs (mortgage down
       payment, loan fees, etc.). First-year net cash flow is reported; subsequent years' cash flow will differ due
       to the effects of inflation and fuel price escalation, changing income tax effects as the mortgage interest
       payments decline, etc.
       3
         Annual energy savings is reported at time zero, before any inflation or price escalations are considered.
       4
         Annual energy savings is reported as a percentage of end uses regulated by the IECC (HVAC, water
       heating, and interior lighting).

Highlights                                                                                                            ii
PNNL-31586
Statewide Impact - Emissions
Statewide Impact First Year 30 Years Cumulative
Energy cost savings, $ 1,230,000 451,300,000
CO2 emission reduction, Metric tons 13,050 6,831,000
CH4 emissions reductions, Metric tons 0.83 434
N2O emissions reductions, Metric tons 0.117 61
NOx emissions reductions, Metric tons 9.35 4,897
SOx emissions reductions, Metric tons 9.81 5,137
Statewide Impact – Jobs Created
Statewide Impact First Year 30 Years Cumulative
Jobs Created -- Reduction in Utility Bills 51 1,604
Jobs Created -- Construction Related Activities 80 2,526
Highlights iiiPNNL-31586
Acronyms and Abbreviations
AVERT U.S. EPA Avoided Emissions and GeneRation Tool
BC3 Building Component Cost Community
BECP Building Energy Codes Program
CH4 Methane
CO2 Carbon Dioxide
CPI consumer price index
DOE U.S. Department of Energy
E.O. Executive Order
eGRID EPA Emissions & Generation Resource Integrated Database dataset
EIA Energy Information Administration
EPA Environmental Protection Agency
ERI Energy Rating Index
GHG greenhouse gas
IAM Integrated assessment models
ICC International Code Council
IECC International Energy Conservation Code
LCC Life-Cycle Cost
NAHB National Association of Home Builders
N2O Nitrous Oxide
NOX Nitrogen Oxides
PNNL Pacific Northwest National Laboratory
SOX Sulfur Oxides
Acronyms and Abbreviations ivPNNL-31586
Contents
Highlights .................................................................................................................................... ii
Acronyms and Abbreviations...................................................................................................... iv
Contents ..................................................................................................................................... v
Figures ........................................................................................................................................ v
Tables v
1.0 Cost-Effectiveness Results for the 2021 IECC for Arkansas ............................................ 1
1.1 Life-Cycle Cost .................................................................................................... 1
1.2 Consumer Cash Flow .......................................................................................... 2
1.3 Simple Payback Period ........................................................................................ 3
2.0 Overview of the Cost-Effectiveness Analysis Methodology .............................................. 5
2.1 Estimation of Energy Usage and Savings ............................................................ 5
2.2 Climate Zones...................................................................................................... 6
2.3 Fuel Prices ........................................................................................................... 7
2.4 Financial and Economic Parameters .................................................................... 8
2.5 Aggregation Scheme ........................................................................................... 8
3.0 Incremental Construction Costs ..................................................................................... 10
4.0 Energy Cost Savings ..................................................................................................... 12
5.0 Societal Benefits............................................................................................................ 14
5.1 Benefits of Energy Codes .................................................................................. 14
5.2 Greenhouse Gas Emissions .............................................................................. 14
5.3 Jobs Creation through Energy Efficiency ........................................................... 16
6.0 References .................................................................................................................... 17
Figures
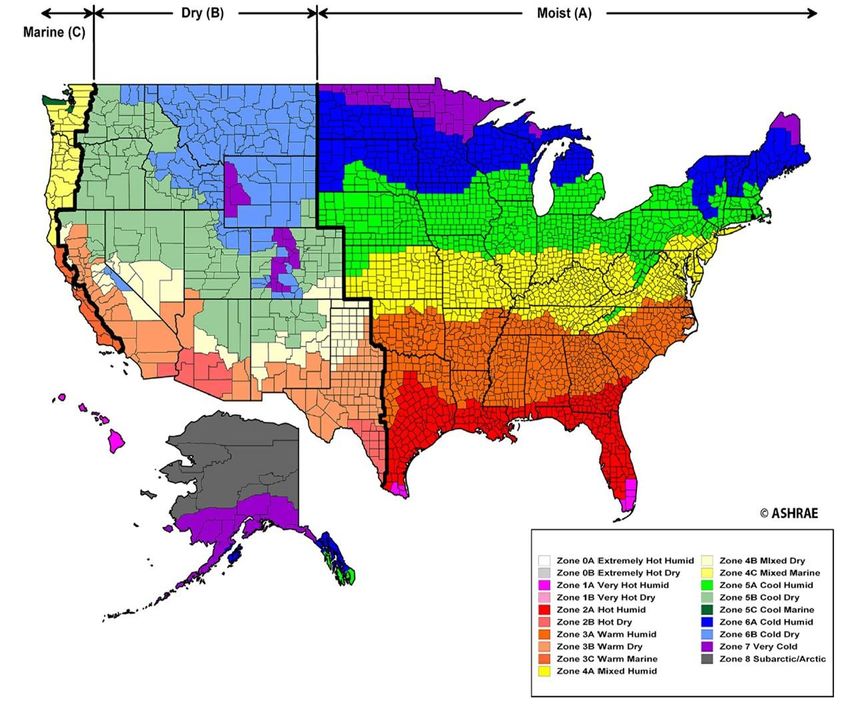
Figure 1. National Climate Zones ................................................................................................ 7
Tables
Table 1. Life-Cycle Cost Savings of the 2021 IECC compared to the 2009 IECC
with amendments ................................................................................................. 2
Table 2. Consumer Cash Flow from Compliance with the 2021 IECC Compared to
the 2009 IECC with amendments......................................................................... 3
Table 3. Simple Payback Period for the 2021 IECC Compared to the 2009 IECC
with amendments ................................................................................................. 4
Table 4. Fuel Prices used in the Analysis .......................................................................... 7
Table 5. Economic Parameters Used in the Analysis ......................................................... 8
Contents vPNNL-31586
Table 6. Heating Equipment Shares .................................................................................. 9
Table 7. Foundation Type Shares ...................................................................................... 9
Table 8. Construction Shares by Climate Zone .................................................................. 9
Table 9. Total Single-Family Construction Cost Increase for the 2021 IECC
Compared to the 2009 IECC with amendments ($) ............................................ 10
Table 10. Total Multifamily Construction Cost Increase for the 2021 IECC
Compared to the 2009 IECC with amendments ($) ............................................ 11
Table 11. Annual (First Year) Energy Costs for the 2009 IECC with amendments ............. 12
Table 12. Annual (First Year) Energy Costs for the 2021 IECC ......................................... 12
Table 13. Total Energy Cost Savings (First Year) for the 2021 IECC Compared to
the 2009 IECC with amendments....................................................................... 13
Table 14. Greenhouse Gas Emission Factors for Arkansas by Fuel Type ......................... 15
Table 15. Societal Benefits of the 2021 IECC .................................................................... 16
Table 16. Jobs Created from the 2021 IECC ..................................................................... 16
Tables viPNNL-31586
1.0 Cost-Effectiveness Results for the 2021 IECC for
Arkansas
This section summarizes the cost-effectiveness analysis in terms of three primary economic
metrics applicable to the homeowner:
• Life-Cycle Cost (LCC): Full accounting over a 30-year period of the cost savings,
considering energy savings, the initial investment financed through increased mortgage
costs, tax impacts, and residual values of energy efficiency measures
• Consumer Cash Flow: Net annual cost outlay (i.e., difference between annual energy cost
savings and increased annual costs for mortgage payments, etc.)
• Simple Payback Period: Number of years required for energy cost savings to exceed the
incremental first costs of a new code, ignoring inflation and fuel price escalation rates
LCC savings is the primary metric established by the U.S. Department of Energy (DOE) to
assess the economic impact of residential building energy codes. Simple payback period and
the Consumer Cash Flow analysis are reported to provide additional information to
stakeholders, including states which have established a range of alternative economic metrics.
Both the LCC savings and the year-by-year cash flow values from which it is calculated assume
that initial costs are mortgaged, that homeowners take advantage of mortgage interest tax
deductions, that individual efficiency measures are replaced with like measures at the end of
their useful lifetimes, and that efficiency measures may retain a prorated residual value at the
end of the 30-year analysis period.
Societal benefits such as benefits from energy codes as well as reduction of carbon emissions
and jobs generated from moving to the 2021 IECC are discussed in Section 5.0.
A complete description of the DOE methodology for assessing the cost-effectiveness of building
energy codes is available on energycodes.gov1.
1.1 Life-Cycle Cost
The Life-Cycle Cost (LCC) analysis computes overall cost savings per dwelling unit resulting
from implementing the efficiency improvements of a new energy code. LCC savings is based on
the net change in overall cash flows (energy savings minus additional costs) resulting from
implementing a new energy code, and balances incremental costs of construction against
longer-term energy savings, including consideration for costs of operations and replacements,
as needed. LCC savings is a sum over an analysis period of 30 years. Future cash flows, which
vary from year to year, are discounted to present values using a discount rate that accounts for
the changing value of money over time. LCC savings is the primary economic metric
established by DOE for assessing the cost-effectiveness of building energy codes.
Table 1 shows the LCC savings (discounted present value) over the 30-year analysis period for
the 2021 IECC compared to the 2015 IECC with amendments.
1
https://www.energycodes.gov/sites/default/files/documents/residential_methodology_2015.pdf
Cost-Effectiveness Results for the 2021 IECC for Arkansas 1PNNL-31586
Table 1. Life-Cycle Cost Savings of the 2021 IECC compared to the 2009 IECC with
amendments
Climate Zone Life-Cycle Cost Savings ($)
3A 17,332
3AWH 14,028
4A 19,520
State Average 17,602
Note: Warm-humid climate zones are labeled "WH"
1.2 Consumer Cash Flow
The Consumer Cash Flow results are derived from the year-by-year calculations that underlie
the Life-Cycle Cost savings values shown above. The specific cash flow values shown here
allow an assessment of how annual cost outlays are compensated by annual energy savings
and the time required for cumulative energy savings to exceed cumulative costs, including both
increased mortgage payments and the down payment and other up-front costs.
Table 2 shows the per-dwelling-unit impact of the improvements in the 2021 IECC on Consumer
Cash Flow compared to the 2009 IECC with amendments.
Cost-Effectiveness Results for the 2021 IECC for Arkansas 2PNNL-31586
Table 2. Consumer Cash Flow from Compliance with the 2021 IECC Compared to the 2009
IECC with amendments
State
Cost/Benefit 3A 3AWH 4A
Average
Incremental down
A payment and other $578 $578 $636 $591
first costs
Annual energy
B $773 $660 $850 $783
savings (year one)
Annual mortgage
C $200 $200 $220 $204
increase
Net annual cost of
mortgage interest
deductions,
D $26 $26 $29 $27
mortgage insurance,
and property taxes
(year one)
E
= Net annual cash flow
$547 $434 $602 $552
savings (year one)
[B-(C+D)]
F Years to positive
= savings, including 2 2 2 2
[A/E] up-front cost impacts
Note: Item D includes mortgage interest deductions, mortgage insurance, and
property taxes for the first year. Deductions can partially or completely offset
insurance and tax costs. As such, the "net" result appears relatively small or is
sometimes even negative.
1.3 Simple Payback Period
The simple payback period is a straightforward metric including only the costs and benefits
directly related to the implementation of energy-saving measures associated with a code
change. It represents the number of years required for the energy savings to pay for the cost of
the measures, without regard for inflation, changes in fuel prices, tax effects, measure
replacements, resale values, etc. The simple payback period is useful for its ease of calculation
and understandability. Because it focuses on the two primary characterizations of a code
change—cost and energy performance—it allows an assessment of cost effectiveness that is
easy to compare with other investment options and requires a minimum of input data. DOE
reports the simple payback period because it is a familiar metric used in many contexts, and
because some states have expressed the desire for this metric. However, because it ignores
many of the longer-term factors in the economic performance of an energy-efficiency
investment, DOE does not use the payback period as a primary indicator of cost effectiveness
for its own decision-making purposes.
Cost-Effectiveness Results for the 2021 IECC for Arkansas 3PNNL-31586
Table 3 shows the simple payback period for the 2021 IECC. The simple payback period is
calculated by dividing the incremental construction cost by the annual energy cost savings
assuming time-zero fuel prices. It estimates the number of years required for the energy cost
savings to pay back the incremental cost investment without consideration of financing of the
initial costs through a mortgage, the favored tax treatment of mortgages, the useful lifetimes of
individual efficiency measures, or future escalation of fuel prices.
Table 3. Simple Payback Period for the 2021 IECC Compared to the 2009 IECC with
amendments
Climate Zone Payback Period (Years)
3A 6.0
3AWH 7.0
4A 6.0
State Average 6.0
Cost-Effectiveness Results for the 2021 IECC for Arkansas 4PNNL-31586
2.0 Overview of the Cost-Effectiveness Analysis
Methodology
This analysis was conducted by Pacific Northwest National Laboratory (PNNL) in support of the
DOE Building Energy Codes Program. DOE is directed by federal law to provide technical
assistance supporting the development and implementation of residential and commercial
building energy codes. The national model energy codes—the International Energy
Conservation Code (IECC) and ANSI/ASHRAE/IES Standard 90.1—help adopting states and
localities establish minimum requirements for energy-efficient building design and construction,
as well as mitigate environmental impacts and ensure residential and commercial buildings are
constructed to modern industry standards.
The current analysis evaluates the cost-effectiveness of the 2021 edition of the IECC, relative to
the 2009 IECC with amendments. The analysis covers one- and two-family dwelling units,
townhouses, and low-rise multifamily residential buildings covered by the residential provisions
of the IECC. The analysis is based on the prescriptive requirements of the IECC. The IECC's
simulated performance path (Section 405) and Energy Rating Index (ERI) path (Section 406)
are not in the scope of this analysis, as they are generally based on the core prescriptive
requirements of the IECC, and due to the unlimited range of building configurations that are
allowed. Buildings complying via these paths are generally considered to provide equal or better
energy performance compared to the prescriptive requirements, as the intent of these paths is
to provide additional design flexibility and cost optimization, as dictated by the builder, designer
or homeowner.
The current analysis is based on the methodology by DOE for assessing energy savings and
cost-effectiveness of residential building energy codes (Taylor et al. 2015). The LCC analysis
perspective described in the methodology appropriately balances upfront costs with longer term
consumer costs and savings and is therefore the primary economic metric by which DOE
evaluates the cost-effectiveness of building energy codes.
2.1 Estimation of Energy Usage and Savings
In order to estimate the energy impact of residential code changes, PNNL developed a single-
family prototype building and a low-rise multifamily prototype building to represent typical new
residential building construction (BECP 2012, Mendon et al. 2014, and Mendon et al. 2015).
The key characteristics of these prototypes are:
• Single-Family Prototype: A two-story home with a roughly 30-ft by 40-ft rectangular shape,
2,376 ft2 of conditioned floor area excluding the conditioned basement (if any), and window
area equal to 15% of the conditioned floor area equally distributed toward the four cardinal
directions.
• Multifamily Prototype: A three-story building with 18 dwelling units (6 units per floor), each
unit having conditioned floor area of 1,200 ft2 and window area equal to approximately 23%
of the exterior wall area (not including breezeway walls) equally distributed toward the four
cardinal directions.
These two building prototypes are further expanded to cover four common heating systems
(natural gas furnace, heat pump, electric resistance, oil-fired furnace) and four common
foundation types (slab-on-grade, heated basement, unheated basement, crawlspace), leading
to an expanded set of 32 residential prototype building models. This set is used to simulate the
Overview of the Cost-Effectiveness Analysis Methodology 5PNNL-31586
energy usage for typical homes built to comply with the requirements of the 2021 IECC and
those built to comply with the requirements of the for one location in each climate zone1 in the
state using DOE’s EnergyPlus™ software, version 9.5 (DOE 2021). Energy savings of the 2021
IECC relative to the 2015 IECC with amendments, including space heating, space cooling,
water heating, lighting and plug loads are extracted from the simulation results.
2.2 Climate Zones
Climate zones are defined in ASHRAE Standard 169, as specified in ASHRAE Standard 90.1,
and include eight primary climate zones in the United States, the hottest being climate zone 1
and the coldest being climate zone 8. Letters A, B, and C are applied in some cases to denote
the level of moisture, with A indicating humid, B indicating dry, and C indicating marine. Figure 3
shows the national climate zones. For this state analysis, savings are analyzed for each climate
zone in the state using weather data from a selected city within the climate zone and state, or
where necessary, a city in an adjoining state with more robust weather data.
1
One location is simulated for each combination of climate zone, moisture regime (Moist, Dry, Marine)
and humidity designation (Warm-Humid, Not Warm-Humid) that exists in the state.
Overview of the Cost-Effectiveness Analysis Methodology 6PNNL-31586
Figure 1. National Climate Zones
2.3 Fuel Prices
The energy savings from the simulation analysis are converted to energy cost savings using the
most recent state-specific residential fuel prices from DOE’s Energy Information Administration
(EIA 2020a, EIA 2020b, EIA 2020c). The fuel prices used in the analysis are shown in Table 4.
Table 4. Fuel Prices used in the Analysis
Electricity Gas Oil
($/kWh) ($/Therm) ($/MBtu)
0.105 1.07 2.519
Overview of the Cost-Effectiveness Analysis Methodology 7PNNL-31586
2.4 Financial and Economic Parameters
The financial and economic parameters used in calculating the LCC and annual consumer cash
flow are based on the latest DOE cost-effectiveness methodology (Taylor et al. 2015) to
represent the current economic scenario. The parameters are summarized in Table 5 for
reference.
Table 5. Economic Parameters Used in the Analysis
Parameter Value
Mortgage interest rate (fixed rate) 3%
Loan fees 1% of mortgage amount
Loan term 30 years
Down payment 12% of home value
Nominal discount rate (equal to mortgage rate) 3%
Inflation rate 1.4%
Marginal federal income tax 12%
Marginal state income tax 5.9%
Property tax 0.52%
2.5 Aggregation Scheme
Energy results, weighted by foundation and heating system type, are provided at the state level
and separately for each climate zone within the state. The distribution of heating systems for
Arkansas is derived from data collected by the National Association of Home Builders data
(NAHB 2009) and is summarized in Table 6. The distribution of foundation types is derived from
the Residential Energy Consumption Survey data (RECS 2013) and is summarized in Table 7.
The single-family and multifamily results are combined for each climate zone in the state and
the climate zone results are combined to calculate a weighted average for the state using 2019
new residential construction starts from the 2010 U.S. Census data (Census 2010). The
distribution of single- and multifamily building starts is summarized in Table 8.
Overview of the Cost-Effectiveness Analysis Methodology 8PNNL-31586
Table 6. Heating Equipment Shares
Share of New Homes
(percent)
Heating System Single-Family Multifamily
Natural Gas 41.1 41.1
Heat Pump 31.5 31.5
Electric Resistance 27.4 27.4
Oil 0 0
Table 7. Foundation Type Shares
Slab-on- Heated Unheated
Foundation Type grade Basement Basement Crawlspace
Share of New Homes (percent) 66.7 0 0 33.3
Table 8. Construction Shares by Climate Zone
Share of New Homes
Climate Zone (percent)
Single-Family Multifamily
3A 76.4 23.6
3AWH 76.4 23.6
4A 76.4 23.6
Overview of the Cost-Effectiveness Analysis Methodology 9PNNL-31586
3.0 Incremental Construction Costs
In order to evaluate the cost-effectiveness of the changes introduced by the 2021 IECC over the
2015 IECC, PNNL estimated the incremental construction costs associated with these changes.
For this analysis, cost data sources consulted by PNNL include:
• Building Component Cost Community (BC3) data repository (DOE 2012)
• Construction cost data collected by Faithful+Gould under contract with PNNL (Faithful +
Gould 2012)
• RS Means Residential Cost Data (RSMeans 2020)
• National Residential Efficiency Measures Database (NREL 2014)
• Price data from nationally recognized home supply stores
The consumer price index (CPI) is used to adjust cost data from earlier years to the study year
(U.S. Inflation Calculator 2021).
The estimated costs of implementing the prescriptive provisions of the 2021 IECC over the 2009
IECC with amendments are taken from earlier PNNL studies that evaluated the cost-
effectiveness (Lucas et al. 2012), (Mendon et.al. 2015) and (Taylor et al. 2019). The national
scope costs from those studies are adjusted to reflect local construction costs in using location
factors provided by RSMeans (2020). The incremental costs of implementing the provisions of
the 2021 IECC over the 2018 IECC are described in National Cost Effectiveness of the
Residential Provisions of the 2021 IECC (Salcido et al. 2021).
Table 9 and Table 10 show the incremental construction costs associated with the 2021 IECC
compared to the 2009 IECC with amendments for an individual dwelling unit. Table 9 shows
results for a house and Table 10 shows results for an apartment or condominium. These have
been adjusted using a construction cost multiplier, 0.8389, to reflect local construction costs
based on location factors provided by RSMeans (2020).
Table 9. Total Single-Family Construction Cost Increase for the 2021 IECC Compared to the
2009 IECC with amendments ($)
Single-family Prototype House
Heated
Climate Zone Crawlspace Slab Unheated Basement
Basement
3A $4,944 $0 $5,375 $0
3AWH $4,944 $0 $5,375 $0
4A $5,542 $0 $5,973 $0
Incremental Construction Costs 10PNNL-31586
Table 10. Total Multifamily Construction Cost Increase for the 2021 IECC Compared to the
2009 IECC with amendments ($)1
Multifamily Prototype Apartment/Condo
Heated
Climate Zone Crawlspace Slab Unheated Basement
Basement
3A $2,045 $0 $2,109 $0
3AWH $2,045 $0 $2,109 $0
4A $1,995 $0 $2,058 $0
1
In the multifamily prototype model, the heated basement is added to the building, and not to the
individual apartments. The incremental cost associated with heated basements is divided among all
apartments equally.
Incremental Construction Costs 11PNNL-31586
4.0 Energy Cost Savings
Table 11 and Table 12 show the estimated the annual per-dwelling unit energy costs of end
uses regulated by the IECC as well as miscellaneous end use loads, which comprise heating,
cooling, water heating, lighting, fans, mechanical ventilation and plug loads that result from
meeting the requirements of the 2021 IECC and the 2009 IECC with amendments
Table 11. Annual (First Year) Energy Costs for the 2009 IECC with amendments
2009 IECC with amendments
Climate Zone Water
Heating Cooling Lighting Fans Vents Total
Heating
3A $848 $347 $239 $172 $112 $37 $2,515
3AWH $595 $385 $224 $172 $111 $37 $2,285
4A $965 $287 $250 $172 $104 $37 $2,574
State Average $858 $336 $241 $172 $110 $37 $2,514
Table 12. Annual (First Year) Energy Costs for the 2021 IECC
2021 IECC
Climate Zone Water
Heating Cooling Lighting Fans Vents Total
Heating
3A $456 $246 $90 $123 $75 $18 $1,765
3AWH $315 $274 $83 $123 $74 $18 $1,645
4A $444 $236 $95 $123 $76 $18 $1,749
State Average $445 $246 $91 $123 $75 $18 $1,755
Energy Cost Savings 12PNNL-31586
Table 13 shows the first-year energy cost savings as both a net dollar savings and as a
percentage of the total regulated end use energy costs. Results are weighted by single- and
multifamily housing starts, foundation type, and heating system type.
Table 13. Total Energy Cost Savings (First Year) for the 2021 IECC Compared to the 2009
IECC with amendments
First Year Energy Cost First Year Energy Cost
Climate Zone
Savings Savings (percent)
3A $750 29.8%
3AWH $640 28.0%
4A $826 32.1%
State Average $760 30.2%
Energy Cost Savings 13PNNL-31586
5.0 Societal Benefits
5.1 Benefits of Energy Codes
It is estimated that by 2060, the world will add 2.5 trillion square feet of buildings, an area equal
to the current building stock. As a building's operation and environmental impact is largely
determined by upfront decisions, energy codes present a unique opportunity to assure savings
through efficient building design, technologies, and construction practices. Once a building is
constructed, it is significantly more expensive to achieve higher efficiency levels through later
modifications and retrofits. Energy codes ensure that a building's energy use is included as a
fundamental part of the design and construction process; making this early investment in energy
efficiency will pay dividends to residents of Arkansas for years into the future.
5.2 Greenhouse Gas Emissions
The urban built environment is responsible for 75% of annual global greenhouse gas (GHG)
emissions while buildings alone account for 39%.1 On January 20, 2021, President Biden issued
Executive Order (E.O.) 13990,2 which noted that it is essential that agencies capture the full
costs of greenhouse gas emissions as accurately as possible, including by taking global
damages into account and that doing so facilitates sound decision-making, recognizes the
breadth of climate impacts, and supports the international leadership of the United States on
climate issues.
While carbon dioxide emissions represent the largest share of greenhouse gas emissions,
building electricity use and fossil fuel consumption on site also contribute to the release of other
emissions, two of which, methane (CH4) and nitrous oxide (N2O) are significant greenhouse
gases in their own right.
For natural gas and for fuel oil combusted on site, emission metrics are developed using
nationwide emission factors from U.S. Environmental Protection Agency publications for CO2,
NOx, SO2, CH4 and N2O (EPA 2014). For electricity, marginal carbon emission factors are
provided by the U.S. Environmental Protection Agency (EPA) AVoided Emissions and
GeneRation Tool (AVERT) version 3.0 (EPA 2020). The AVERT tool forms the basis of the
national marginal emission factors for electricity also published by EPA on its Greenhouse Gas
Equivalencies Calculator website and are based on a portfolio of energy efficiency measures
examined by EPA. AVERT is used here to provide marginal CO2 emission factors at the State
level.3 AVERT also provides marginal emission factor estimates for gaseous pollutants
1
Architecture 2030
2
Exec. Order No. 13990, 86 Fed. Reg. 7037 (January 20, 2021)
3
AVERT models avoided emissions in 14 geographic regions of the 48 contiguous United States and
includes transmission and distribution losses. Where multiple AVERT regions overlap a state’s
boundaries, the emission factors are calculated based on apportionment of state electricity savings by
generation across generation regions. The most recent AVERT 3.0 model uses EPA emissions data for
generators from 2019. Note that AVERT estimates are based on marginal changes to demand and reflect
current grid generation mix. Emission factors for electricity shown in Table 14 do not take into account
long term policy or technological changes in the regional generation mix that can impact the marginal
emission benefits from new building codes.
Societal Benefits 14PNNL-31586
associated with electricity production, including NOx and SO2 emissions. While not considered
significant greenhouse gases, these are EPA tracked pollutants. The current analysis uses
AVERT to provide estimates of corresponding emission changes for NOx and SO2 in physical
units but does not monetize these.
AVERT does not develop associated marginal emissions factors for CH4 or N2O. To provide
estimates for the associated emission reductions for CH4 and N2O, this report uses emission
factors separately provided through the U.S. Environmental Protection Agency (EPA) Emissions
& Generation Resource Integrated Database (eGRID) dataset. eGRID is a comprehensive
source of data on the environmental characteristics of almost all electric power generated in the
United States and the emission characteristics for electric power generation for each of the
above emissions can also be found aggregated down to the state level in eGRID (EPA 2021a).
The summary emission factor data provided by eGRID does not provide marginal emission
factors, but instead summarizes emission factors in terms of total generation emission factors
and non-baseload generation emission factors. Non-baseload emission factors established in
eGRID are developed based on the annual load factors for the individual generators tracked by
the EPA (EPA 2021b). Because changes in building codes are unlikely to significantly impact
baseload electrical generators, the current analysis uses the 2019 non-baseload emission
factors established in eGRID by state to estimate CH4 or N2O emission reductions due to
changes in electric consumption.
Table 14 summarizes the marginal carbon emission factors available from AVERT, eGRID and
the EPA Greenhouse Gas Equivalencies Calculator.
Table 14. Greenhouse Gas Emission Factors for Arkansas by Fuel Type
Electricity Natural Gas Fuel Oil
GHG lb/MWh (lb/mmcf) (lb/1000 gal)
CO2 1,833 120,000 23,000
SO2 1.538 0.6 12
NOX 1.301 96 19
N2O 0.022 0.23 0.45
CH4 0.133 2.3 0.7
Societal Benefits 15PNNL-31586
Table 15 shows the annual first year and projected 30-year energy cost savings. This table also
shows first year and projected 30-year greenhouse gas (CO2, CH4, and N2O) emission
reductions, in addition to NOx and SO2 reductions.
Table 15. Societal Benefits of the 2021 IECC
Statewide Impact First Year 30 Years Cumulative
Energy cost savings, $ 1,230,000 451,300,000
CO2 emission reduction, Metric tons 13,050 6,831,000
CH4 emissions reductions, Metric tons 0.83 434
N2O emissions reductions, Metric tons 0.117 61
NOx emissions reductions, Metric tons 9.35 4,897
SOx emissions reductions, Metric tons 9.81 5,137
5.3 Jobs Creation through Energy Efficiency
Energy-efficient building codes impact job creation through two primary value streams:
1. Dollars returned to the economy through reduction in utility bills and resulting increase in
disposable income, and;
2. An increase in construction-related activities associated with the incremental cost of
construction that is required to produce a more energy efficient building.
When a home or building is built to a more stringent energy code, there is the long-term benefit
of the home or building owner paying lower utility bills.
• This is partially offset by the increased cost of that efficiency, establishing a relationship
between increased building energy efficiency and additional investments in construction
activity.
• Since building codes are cost effective, (i.e., the savings outweigh the investment), a real
and permanent increase in wealth occurs which can be spent on other goods and services
in the economy, just like any other income, generating economic benefits in turn creating
additional employment opportunities.
Table 16 also shows the number of jobs created because of efficiency gains in the 2021 IECC.
Results are weighted by single- and multifamily housing starts, foundation type, and heating
system type.
Table 16. Jobs Created from the 2021 IECC
Statewide Impact First Year 30 Years Cumulative
Jobs Created -- Reduction in Utility Bills 51 1,604
Jobs Created -- Construction Related Activities 80 2,526
Societal Benefits 16PNNL-31586
6.0 References
BECP. 2012. Residential Prototype Building Models developed by DOE’s Building Energy
Codes Program. Available at http://www.energycodes.gov/development/residential/iecc_models/
U.S. Inflation Calculator. 2021. Consumer Price Index Data from 1913 to 2021. Coin News
Media Group LLC. Available at https://www.usinflationcalculator.com/inflation/historical-inflation-
rates/
U.S. Census Bureau. 2010. Characteristics of New Housing. U.S. Census Bureau, Washington,
D.C. Available at http://www.census.gov/construction/chars/completed.html
DOE. 2012. Building Component Cost Community. U.S. Department of Energy, Washington,
D.C. Available at http://bc3.pnnl.gov/
DOE. 2015. Determination Regarding Energy Efficiency Improvements in the 2015 International
Energy Conservation Code (IECC). U.S. Department of Energy, Washington, D.C. Available at
http://www.energycodes.gov/sites/default/files/documents/2015_IECC_Determination.pdf
DOE. 2021. EnergyPlus Energy Simulation Software, Version 9.5. U.S. Department of Energy,
Washington, DC. Available at https://energyplus.net/downloads
EIA. 2020a. Table 5.3. Average Price of Electricity to Ultimate Customers. U.S. Energy
Information Administration, Washington DC. Available at
https://www.eia.gov/electricity/monthly/epm_table_grapher.cfm?t=epmt_5_3
EIA. 2020b. Natural Gas. U.S. Energy Information Administration, Washington D.C. Available at
https://www.eia.gov/dnav/ng/ng_pri_sum_a_EPG0_PRS_DMcf_a.htm
EIA. 2020c. Natural Gas Heat Content. U.S. Energy Information Administration, Washington
D.C. Available at https://www.eia.gov/dnav/ng/ng_cons_heat_a_EPG0_VGTH_btucf_a.htm
EPA. 2014. Compilation of Air Pollutant Emission Factors, AP-42, Fifth Edition, Volume I:
Stationary Point and Area Sources (Chapter 1). U.S. Environmental Protection Agency,
Washington, D.C. Available at: https://www.epa.gov/air-emissions-factors-and-quantification/ap-
42-compilation-air-emissions-factors
EPA. 2020 AVoided Emissions and geneRation Tool (AVERT), User Manual Version 3.0. U.S.
Environmental Protection Agency, Washington, D.C. Available at
https://www.epa.gov/avert/avert-user-manual
EPA. 2021a. THE EMISSIONS & GENERATION RESOURCE INTEGRATED DATABASE
eGRID Technical Guide with Year 2019 Data. U.S. Environmental Protection Agency,
Washington, D.C. Available at https://www.epa.gov/sites/production/files/2021-
02/documents/egrid2019_technical_guide.pdf
EPA. 2021b. Emission Factors for Greenhouse Gas Inventories. U.S. Environmental Protection
Agency, Washington, D.C. Available at https://www.epa.gov/sites/production/files/2021-
04/documents/emission-factors_apr2021.pdf
References 17PNNL-31586
Faithful + Gould. 2012. Residential Energy Efficiency Measures: Prototype Estimate and Cost
Data. Faithful+Gould for Pacific Northwest National Laboratory. Available at
http://bc3.pnnl.gov/sites/default/files/Residential_Report.pdf
ICC. 2014. 2015 International Energy Conservation Code. International Code Council,
Washington, DC. Available at http://codes.iccsafe.org/app/book/toc/2015/I-
Codes/2015%20IECC%20HTML/index.html
ICC. 2017. 2018 International Energy Conservation Code. International Code Council,
Washington, DC. Available at https://shop.iccsafe.org/codes/2018-international-codes-and-
references/2018-international-energy-conservation-code/2018-international-energy-
conservation-coder.html
IWG – Interagency Working Group on Social Cost of Greenhouse Gases, United States
Government. 2016. Technical Support Document: Technical Update of the Social Cost of
Carbon for Regulatory Impact Analysis Under Executive Order 12866. Available at
https://www.epa.gov/sites/production/files/2016-12/documents/sc_tsd_august_2016.pdf
IWG – Interagency Working Group on Social Cost of Greenhouse Gases, United States
Government. 2021. Technical Support Document: Social Cost of Carbon, Methane, and Nitrous
Oxide Interim Estimates under Executive Order 13990. Available at
https://www.whitehouse.gov/wp-
content/uploads/2021/02/TechnicalSupportDocument_SocialCostofCarbonMethaneNitrousOxid
e.pdf
Lucas R.G., Z.T. Taylor, V.V. Mendon, and S.G. Goel. 2012. National Energy and Cost Savings
for New Single- and Multifamily Homes: A Comparison of the 2006, 2009 and 2012 Editions of
the IECC. Pacific Northwest National Laboratory, Richland, Washington. Available at
https://www.energycodes.gov/sites/default/files/documents/NationalResidentialCostEffectivenes
s.pdf
Mendon V.V. and Z.T. Taylor. 2014. Development of Residential Prototype Building Models and
Analysis System for Large-Scale Energy Efficiency Studies Using EnergyPlus. 2014
ASHRAE/IBPSA-USA Building Simulation Conference, Atlanta, GA.
Mendon V.V., A. Selvacanabady, M. Zhao, and Z.T. Taylor. 2015. National Cost-Effectiveness
of the Residential Provisions of the 2015 IECC. Pacific Northwest National Laboratory,
Richland, Washington. Available at
https://www.energycodes.gov/sites/default/files/documents/2015IECC_CE_Residential.pdf
NREL. 2014. National Residential Efficiency Measures Database. National Renewable Energy
Laboratory, Golden, Colorado. Available at http://www.nrel.gov/ap/retrofits/
NAHB. 2009. Builder Practices Reports. National Association of Home Builders, Upper
Marlboro, Maryland. Available at
http://www.homeinnovation.com/trends_and_reports/data/new_construction
RECS – Residential Energy Consumption Survey. 2013. 2009 RECS Survey Data. U.S. Energy
Information Administration. Washington D.C. Available at
https://www.eia.gov/consumption/residential/data/2009/
References 18PNNL-31586
RSMeans. 2020. 2020 RS Means Residential Cost Data. Construction Publishers &
Consultants. Norwell, MA. Available at http://www.rsmeans.com/
Salcido V.R., Y Chen, Y Xie, and ZT Taylor. 2021. National Cost Effectiveness of the
Residential Provisions of the 2021 IECC. Pacific Northwest National Laboratory, Richland
Washington. Available at
https://www.energycodes.gov/sites/default/files/documents/2018IECC_CE_Residential.pdf
Taylor Z.T., V.V. Mendon, and N. Fernandez. 2015. Methodology for Evaluating Cost-
Effectiveness of Residential Energy Code Changes. Pacific Northwest National Laboratory,
Richland, Washington. Available at
https://www.energycodes.gov/sites/default/files/documents/residential_methodology_2015.pdf
Taylor Z.T., V.V. Mendon, M. Zhao, and B. Liu. 2019. Energy Savings Analysis: 2018 IECC for
Residential Buildings. Pacific Northwest National Laboratory, Richland, Washington. Available
at https://www.energycodes.gov/sites/default/files/documents/EERE-2018-BT-DET-0014-
0008.pdf
References 19PNNL-31586 Pacific Northwest National Laboratory 902 Battelle Boulevard P.O. Box 999 Richland, WA 99354 1-888-375-PNNL (7665) www.pnnl.gov
You can also read