Rapporto Annuale Efficienza Energetica 2018: principali risultati - Alessandro Federici, Dipartimento Efficienza Energetica, ENEA
←
→
Page content transcription
If your browser does not render page correctly, please read the page content below
Rapporto Annuale Efficienza Energetica 2018:
principali risultati
 Alessandro Federici, Dipartimento Efficienza Energetica, ENEA

 Bologna, 24 luglio 2018
Italy’s National Energy Strategy 2017 - Targets

Targets to be achieved by 2030 are in line with both the plan of the
European Energy Union and the EU Energy Roadmap 2050:
• Enhancing Italy’s competitiveness, by continuing to bridge the
  gap between Italian energy prices and costs and European ones,
  in a global context of rising energy prices.
• Attaining Europe’s environmental and decarbonisation targets by
  2030 in sustainable ways, in line with the future targets set by
  COP21.
• Continuing to improve the security of energy supply and the
  flexibility of energy systems and infrastructures.
                                                                       2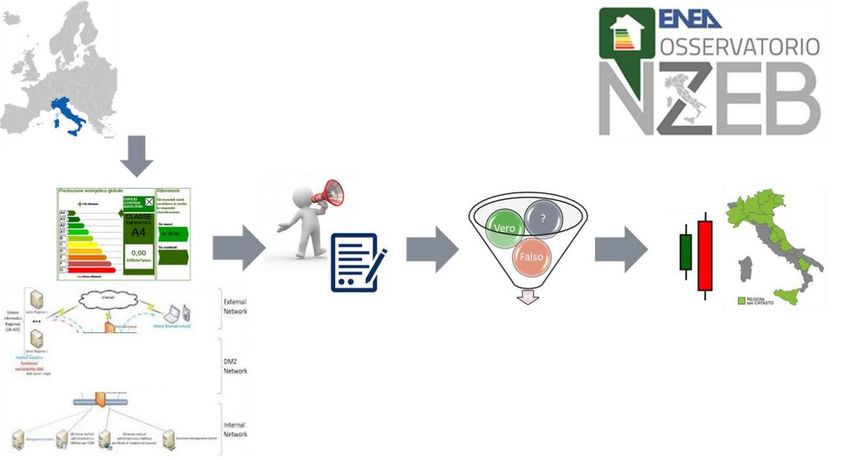
Italy’s National Energy Strategy 2017 - Energy sector

The path towards a decarbonized energy sector by 2050.

                                                         3
        Source: Ministry of Economic Development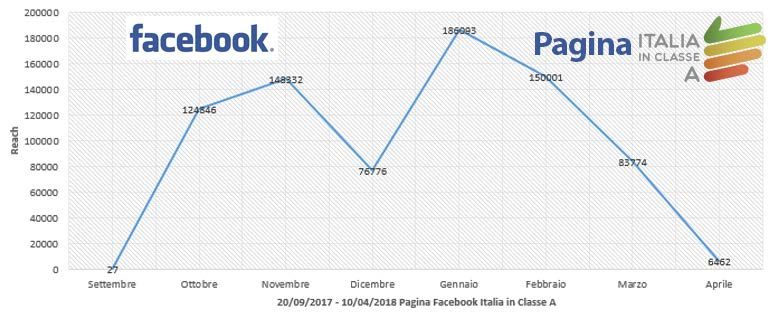
Italy’s National Energy Strategy 2017-Energy efficiency
                                                 Residential: revising, strengthening
                                                 and confirming the tax deduction
                                                 scheme for energy-efficiency
                                                 investments (so-called “Ecobonus”);
                                                 putting the energy-efficiency fund
                                                 into operation.
                                                 Services: adoption of Energy
                                                 Performance Contracting (EPC) for
                                                 the renovation of public buildings;
                                                 energy renovation programme for
                                                 public buildings.
      Source: Ministry of Economic Development
                                                                                  4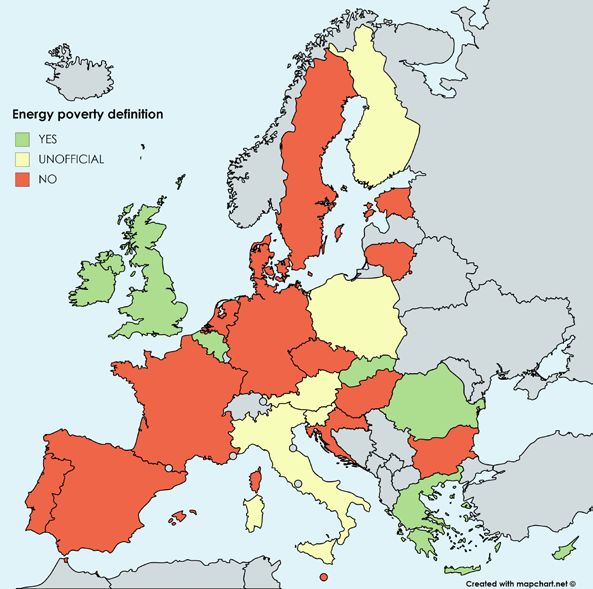
Italy’s National Energy Strategy 2017 - Governance

“Control room” between the Ministry of Economic Development and
the Ministry of the Environment and Protection of Land and Sea,
with:
• Other Ministries: Ministry of Economy and Finance; Ministry of
  Infrastructure and Transport; Ministry of Cultural Heritage and
  Activities and Tourism .
• Public Bodies: Representatives from Regions and Autonomous
  Provinces; periodic update from local government units.
• Technical bodies: if necessary, support from ENEA, GSE, ISPRA,
  RSE, etc.
                                                                    5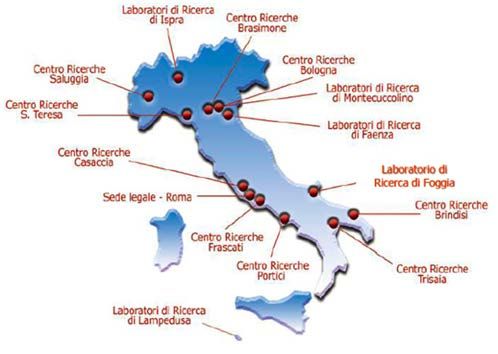
About ENEA
             ENEA is the Italian National
             Agency for New
             Technologies, Energy and
             Sustainable Economic
             Development.
             It is a public Research and
             Technology Organization
             operating in the fields of
             energy, environment and new
             technologies to support
             Country’s competitiveness
             and sustainable development.
                                    6
National Agency for Energy Efficiency
                An integral part of ENEA is the National Agency
                for Energy Efficiency, established by the Italian
                legislative decree no. 115 of 30th May 2008, as
                transposition of directive 2006/32/EC on energy
                end-use efficiency and energy services, which
                offers technical and scientific support to
                companies, supports the Public Administration
                in the preparation, implementation and control
                of national energy policies, and promotes
                training and information campaigns for the
                dissemination of energy efficiency culture.
                                                             7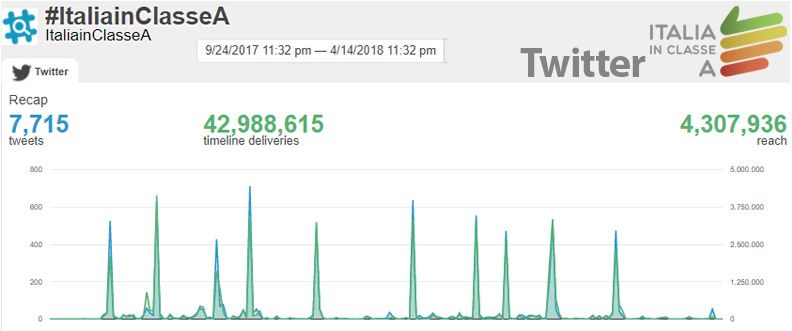
Key figures – International studies

           The 2018 International Energy Efficiency Scorecard of
           the American Council for an Energy-Efficient Economy
           (ACEEE) examines the efficiency policies and
           performance of 25 of the world’s top energy-consuming
           countries.
           Germany tied with Italy for the top spot in the ranking
           with a score of 75.5 out of 100.
           2016 RISE – Regulatory Indicators for Sustainable
           Energy of World Bank grades 111 countries in three
           areas: energy access, energy efficiency and renewable
           energy.
           Italy is in the “Top Ten”.                         8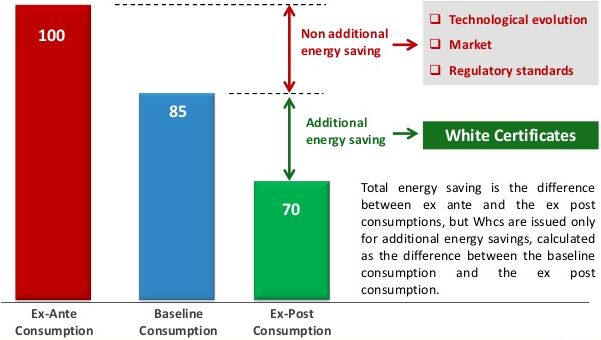
Key figures – Primary energy intensity, Italy
1700                                                                     240
                                                                               Gross
1650                                                                     220   Domestic
                                                                               Product
1600                                                                     200   (Billion €2010)
                                                                               (left)
1550                                                                     180
                                                                               Gross inland
1500                                                                     160   energy
                                                                               consumption
1450                                                                     140   (Mtoe)
                                                                               (right)
1400                                                                     120

                                                                               Energy
1350                                                                     100
                                                                               Intensity
                                                                               (toe/M€2010)
1300                                                                     80    (right)

                      Source: ENEA elaboration of EUROSTAT, ISTAT data
                                                                                      9
Key figures – Primary energy intensity, EU countries
             200

                                                               EU-28
             180
                                                               Euro Zone

             160                                               France
toe/M€2010

                                                               Germany
             140

                                                               Italy
             120
                                                               UK

             100                                               Spain

              80

                                 Source: EUROSTAT
                                                                 10
Key figures – Final energy intensity in industry, Italy
140 Industry
Manufacturing
120
Iron and steel
100
Chemicals
80
Non metallic
minerals
60 Machining
40 Food
Paper
20
Textile
Source: ENEA elaboration of EUROSTAT, ISTAT data
11Key figures – ODEX index, Italy
140
130
Total efficiency
index
120
Industry
110
Transport
100
Residential
90
Services
80
70
Source: ODYSSEE project
12EED art. 7 – Obligation Scheme – White Certificates / 1
White Certificates are tradable
securities certifying achieved
energy saving in the final uses
of energy through energy
efficiency measures and
projects. The obligation scheme
was introduced by the
legislative decrees that Source: GSE
liberalised the electricity and the
WhCs issued only for
natural gas markets (Ministerial
additional savings
Decrees of 20 July 2004).
13EED art. 7 – Obligation Scheme – White Certificates / 2
The system rests on the obligation for electricity and gas distributors
with more than 50 000 end users to generate each year a certain amount
of savings or, alternatively, to purchase an equivalent amount of
certificates from non-obliges parties. Non obliged parties are electricity
and gas distributors with less than 50 000 end users, ESCOs, companies
with an energy manager or ISO 50001 certified.
30
Cumulative energy savings 25.7
25 23.8
21.8
20.1
20 17.4
Mtoe
14.9
15
11.8
10 8.5
5.2 Source: GSE
5 2.7
0.6 1.3
0 14
2006 2007 2008 2009 2010 2011 2012 2013 2014 2015 2016 2017EED art. 7 – Alternative measures – Ecobonus / 1
Tax deductions scheme for the energy
renovation of existing residential buildings
were introduced in Italy by the Budget Law
for 2007.
Ecobonus has been a key driver of energy
efficiency improvements in the housing
sector:
• More than 3.3 million of implemented
actions
• Almost 35.5 billion euros of leveraged
private investments
15EED art. 7 – Alternative measures – Ecobonus / 2
Maximum
Maximum eligible Deduction
Code Action eligible
deduction (€) (^) (%)
expense (€)
344 Reduction of heating energy demand of the whole building 100,000.00 65%
a) insulation of vertical walls, roof, slabs (*) 60,000.00 65%
b) windows and shutters replacement (*) 60,000.00 50%
Eligible c) installing solar shades (*) 60,000.00 50%
actions d) actions on common parts, involving over 25% of the building 40,000.00
70%
surface area (#)
e) same actions as in d) to achieve at least the average quality as
1/2 345 per tables 3 and 4 of Annex 1, of the Italy’s Ministerial Decree
40,000.00
75%
(#)
26/06/2015 “Guidelines for the Energy Certification Decree”
f) actions as in d) and e) implemented in seismic zones 1,2 and 3,
136,000.00
aimed to reduce seismic risks also, resulting in one lower class of 80%
(#)
the seismic risk classification
g) actions as in d) and e) implemented in seismic zones 1,2 and 3,
136,000.00
aimed to reduce seismic risks also, resulting in two or more lower 85%
(#)
classes of the seismic risk classifications
Source: ENEA
16EED art. 7 – Alternative measures – Ecobonus / 3
346 Installing solar panels to produce domestic hot water 60,000.00 65%
i. condensing boilers that are at least class A
30,000.00 50%
efficient
ii. condensing boilers that are at least class A
efficient and require the installation of advanced 30,000.00 65%
a) full or
thermoregulation systems
partial
replacement iii. condensing hot air generators 30,000.00 65%
Eligible of heating
iv. high efficiency heat pumps, with low enthalpy
actions systems with 30,000.00 65%
geothermal systems
347 systems
equipped with v. hybrid appliances with heat pump integrated
1/2 30,000.00 65%
(**) with a condensation boiler
vi. micro-CHP systems 100,000.00 65%
vii. replacing conventional water heaters with
30,000.00 65%
heat pump boiler for domestic hot water
b) installation of biomass heating system 30,000.00 50%
c) installation of Building Automation systems 65%
Source: ENEA
17EED art. 7 – Alternative measures – Ecobonus / 4
The Budget Law 2018 has extended the possibility of tax credit transfer
to all taxpayers and all eligible actions: tax credit can be transferred to
suppliers who implemented works or to other private entities, with the
possibility of an only one subsequent transfer to other entities than
suppliers, as long as they are linked to the works that implied the tax
deduction.
For taxpayers out of the no-tax area, credit cannot be transferred to
credit institutions and financial intermediaries.
ENEA will develop a programme for both documentary and on-site
checks of the main implemented actions, carried out on a sample basis.
18EED art. 7 – Alternative measures – Thermal Account
The Ministerial Decree of 28 December Energy audit + Energy
Performance Certificate
2012 introduced a new incentive system for Building Automation
Lighting
actions to improve energy efficiency and
Solar shading
generate thermal energy from renewable
NZEB
sources. It is the first scheme encouraging Condensing boiler
public administrations to implement energy Windows and shutters
efficiency improvement actions in buildings Envelope
and technical installations. 0 500 1000
n
1500 2000 2500
Source: GSE
In 2017 the Thermal Account showed a clear acceleration for the public
administration (from 141 requests in 2016 to 333 in 2017, +136%), for
almost 62 million euros of investments.
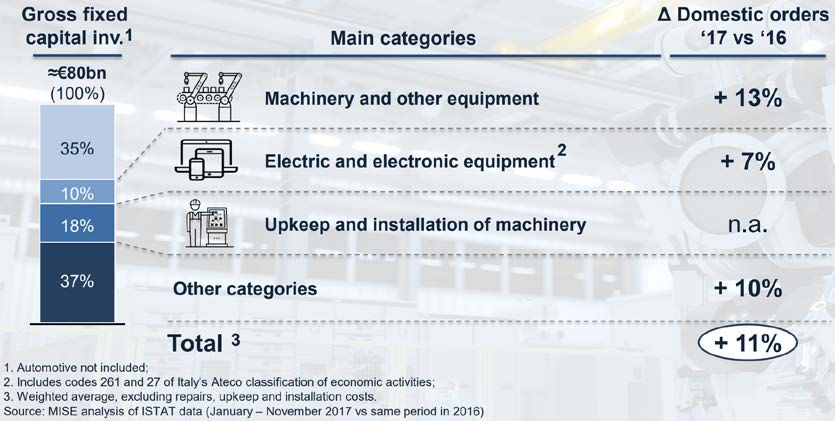
19EED art. 7 – Alternative measures – Impresa 4.0
Hyper depreciation (250%)
investments in new tangible
assets, devices and
technologies enabling
companies’ transformation
to “Impresa 4.0” standards.
Nuova Sabatini: contribution partially covering interest paid by business
on bank loans of between 20,000 and 2,000,000 euros, with an annual
interest rate of 2.75% and is increased by 30% in the case of investment
in “Impresa 4.0” technologies.
20Achieved savings (final energy, Mtoe/year), 2011-2017
High-Speed Rail *
Italian Legislative
Regulations and
Decrees 192/05
and 26/6/15 **
National Plan *
Measure Energy
Impresa 4.0
Tax Relief *
Certificates
European
Achieved
Termico
White savings
Conto
target
(%)
Sector Achieved Expected
in 2017 ** by 2020
Residential 0.71 2.08 - - - 0.85 3.64 3.67 99.2%
Services 0.15 0.02 0.005 - - 0.04 0.22 1.23 17.5%
Industry 2.1 0.03 - 0.3 - 0.07 2.5 5.1 49.0%
Transport 0.01 - - - 1.68 - 1.69 5.5 30.7%
Total 2.97 2.13 0.005 0.3 1.68 0.96 8.05 15.5 51.9%
* Estimate for the year 2017.
** Estimate for the period January-September 2017. The residential sector includes the savings from the replacement of large household
appliances also.
Source: ENEA elaboration of data from the Ministry of Economic Development, ISTAT, Gestore dei Servizi Energetici S.p.A., ENEA, FIAIP, GFKEED art. 7: achieved savings (final, Mtoe), 2014-2017
New Savings achieved Cumulative savings
Notified measures Expected
2014 2015 2016 2017 * 2014-2017
in 2020
Mandatory scheme
0.872 0.859 1.101 1.341 4.174 12.51
White Certificates
Alternative measure 1
0.003 0.008 0.019 0.045 0.075 0.43
Conto Termico
Alternative measure 2
0.306 0.597 0.873 1.164 2.940 8.39
Tax relief
Alternative measure 3
0.000 0.000 0.000 0.000 0.000 0.18
National Energy Efficiency Fund
Alternative measure 4
0.000 0.000 0.000 0.300 0.300 4.00
Impresa 4.0 National Plan
Total savings 1.181 1.465 1.993 2.850 7.489 25.50
* Preliminary estimate on data not yet consolidated
Source: Elaboration of the Ministry of Economic Development based on data from ENEA and
22
Gestore dei Servizi Energetici S.p.ACost-effectiveness of incentive schemes
A preliminary assessment of the economic balance of the main incentive
schemes takes into account the cumulative amount over time of:
economic savings; excise duties; expenditure for investments in
efficient components/plants business turnover; tax and contributory
income (IRES, IRPEF, social security contributions, VAT, etc.).
Years I0 Savings Costs Cost-effectiveness
Mechanism Energy Financial
(n) (G€) (G€) (c€/kWh)
(Mtoe) (G€)
White Certificates 13 12.0 57.3 38.0 7.0 2.9
Ecobonus 11 34.6 8.6 5.4 20.5 8.6
PV (Feed-in Tariff) 12 82.7 134 (20 y)
32.0
Other electric RESSavings in the national energy bill
1,8 450
1,6 400
1,4 350
Mtoe/year
1,2 300
M€/year
1,0 250
0,8 200
0,6 150
0,4 100
0,2 50
0,0 0
2011 2012 2013 2014 2015 2016 2017
Gas saving (Mtoe, area) Oil saving (Mtoe, area)
White Certificates (Mtoe, bar) Tax relief (Mtoe, bar)
Conto Termico (Mtoe, bar) Decree 192/05 and 26/6/15 (Mtoe, bar)
Impresa 4.0 National Plan (Mtoe, bar) Measures in transport sector (Mtoe, bar)
Gas bill (M€, dotted line) Oil bill (M€, dotted line)
Source: ENEA 24Energy audit in the industry / 1
Together with the main
stakeholders, ENEA developed an
innovative scheme to analyse the
energy structure of the audited
production site. Through a multi-
level procedure, a tree scheme
allows to better define the energy
performance, for each energy
vector (electric, thermal, steam,
hot water, etc.), splitting annual
consumption by the different
users within the production site. Source: ENEA
25Energy audit in the industry / 2
ENEA developed different documents to provide operational advices to
auditors, to standardise reporting and accounting. A logic operational
path has been proposed, along which structuring and organising the
energy audit. Together with different trade associations, specific
guidelines were conceived to make the enterprises fully comply with
Legislative Decree 102/2014, in particular for multi-site enterprises.
26
Source: ENEAEnergy audit in the industry / 3
payback time less
Potential savings
Projects with
Audited sites
than 3 years
investments
enterprises
Number of
Necessary
(ktoe)
(M€)
ATECO sector
A - Agriculture, forestry and fishing 61 108 59 2.5 2.2
B - Mining and quarrying 40 75 31 5.7 3.5
C - Manufacturing 5,131 7,032 5,271 595.3 491.4
D - Electricity, gas, steam and air conditioning supply 232 492 194 38.1 32.2
E - Water supply, sewerage, waste management and remediation
324 921 276 24.3 18.7
activities
F - Construction 175 323 97 10.1 6.9
G - Wholesale and retail trade; repair of motor vehicles and
892 2,433 896 24.2 21.2
motorcycles
H - Transportation and storage 416 934 272 27.7 18.1
I - Accommodation and food service activities 110 309 112 2.6 3.1
J - Information and communication 160 664 255 19.6 20.6
K - Financial and insurance activities 244 597 151 2.4 2.3
L - Real estate activities 59 114 52 2.2 2.2
M - Professional, scientific and technical activities 255 316 66 1.4 1.0
N - Administrative and support service activities 250 449 62 1.0 0.8
Other 337 693 570 22.5 22
Total 8,686 15,460 8,364 779.6 646
Source: ENEAThe whole decision process
Public stakeholder
Investors Promotors Agencies Owners End users
Projects Firms
Source: ENEAEnergy renovation of existing residential buildings / 1
Year 2014-2016 2017
Technology/action GWh/y % GWh/y %
Walls 351 10.7% 146.6 11.3%
Slabs and roofs 603 18.4% 193.6 14.9%
Windows and shutters 1,531 46.6% 583.8 44.9%
Solar thermal 160 4.9% 36.6 2.8%
Solar shading 33 1.0% 25.6 2.0%
Condensing boilers 428 13.0% 223.2 17.1%
Geothermal plants 3 0.1% 0.5 0.0%
Heat pumps 138 4.2% 61.3 4.7%
Building automation 5 0.2% 10.1 0.8%
Other 30 0.4% 20.0 1.5%
Total 3,282 100% 1,301 100%
Source: ENEAEnergy renovation of existing residential buildings / 2
Energy consumption in households Annual average expense of households
36 Fuel
35.1 (€)
34.4
34.1 2014 2015 2016
34 Expenses
33.0
Electricity 550.0 574.4 595.0
31.5
32
30.5 31.731.7 Gas (b) 727.7 706.0 639.3
Mtoe
31.8
30.6 31.4
30 29.5 Diesel 21.7 19.5 18.6
29.9
28
Solid fuels (c) 71.3 71.1 68.0
28.5
27.1 Thermal energy 10.1 7.3 8.3
26
2001 2003 2005 2007 2009 2011 2013 2015 Total 1,380.7 1,378.3 1,329.2
Source: ISTAT
Source: ISTATEnergy renovation of existing residential buildings / 3
Energy efficiency actions can account for average savings of 15% on
total annual household spending on energy products (30% of the annual
expenditure for gas).
2014 2015 2016 2017
Overall Ecobonus savings (Mtoe/year) 0.093 0.094 0.096 0.112
Natural gas saved (Mm3) 107.73 109.19 111.25 130.14
Average cost of natural gas (€/m3, current
0.82 0.79 0.72 0.73
values)
Financial savings (M€) 88.6 86.7 80.4 95.2
Real estate units incentivized with Ecobonus
353,732 415., 28 465,751 625,646
actions (n)
Saving per household (€/year) 250.52 208.56 172.53 152.17
Source: ENEAEnergy renovation of existing residential buildings / 4
Investments Directly employed Allied industries Total employees
Year
(M€) (n) (n) (n)
2007 1,453 14,460 7,230 21,690
2008 3,500 34,832 17,416 52,248
2009 2,563 25,507 12,753 38,260
2010 4,608 45,859 22,929 68,788
2011 3,309 32,931 16,466 49,397
2012 2,883 28,692 14,346 43,037
2013 3,612 35,947 17,973 53,920
2014 3,066 30,513 15,256 45,769
2015 3,088 30,732 15,366 46,098
2016 3,309 32,931 16,466 49,397
2017 3,724 32,931 18,531 51,462
Average 3,192 31,394 15,885 47,279
Source: ENEA elaboration on data from CRESMEBarriers to energy renovation of buildings / 1
Barrier type and interview questions Agreement Neutral Disagreement Economic availability
Economic or socio-economic barriers
Despite the possibility of credit transfer, 20%/30% of expenses to
be covered is in any case too burdensome for a block of flats, 31% 41% 28%
regardless of the benefits from energy-efficient renovation.
The different economic situation of residents makes the decision
72% 21% 7%
difficult.
Technical and administrative barriers
Difficult to understand
Difficulty in efficiently managing the procedures (time
48% 42% 10%
management, cost of operations in terms of work done).
Information barriers
Residents struggle to understand the benefits of investments per Lack of common interest
79% 10% 11%
energy efficiency.
Residents are not informed about incentives. 48% 42% 10%
Conflicts of interest and social barriers
Owners and tenants have too many different and conflicting
79% - 21%
interests.
The various age brackets make it difficult to identify a common
73% 17% 10%
interest with respect to contingent energy-efficient interventions.
Bad relations among residents, differences between households,
the negative spirit and unfavorable residents’ atmosphere make 39% 45% 24%
the decision impossible.
Agree Undecided Disagree
So-called experts, who suggest solutions contrary to the majority,
31% 34% 35%
represent an obstacle to energy-efficient solutions.
Source: ISINNOVA - ENEABarriers to energy renovation of buildings / 2
Type of information tool Agreement Neutral Disagreement
Transparent description of the legal measures and type of works
79% 14% 7%
that can be incentivized
Support in spreading information to residents 76% 7% 17%
Notions on how to evaluate the economic benefits of
76% 10% 14%
investments
Tips on how to present an investment proposal at a meeting 72% 7% 21%
Support to handle meetings on these issues 62% 17% 21%
Defining the no-tax area and documents required to prove it 62% 14% 24%
Information on how to collaborate with energy service
59% 17% 24%
companies
Interventions aggregator (es. Community-led interventions for
45% 21% 34%
renovation) Source: ISINNOVA - ENEA
Economic assessment Handling meetings ESCOs’ involvement
Source: ISINNOVA - ENEA
Agree Undecided DisagreeFinancial tools / 1
Targets of financial tools
100%
80%
80%
61%
60% 54%
44%
40%
22%
20% 15%
5%
0%
SMEs Large Services ESCOs Households Block of flats Public
Enterprises Administration
Source: Abi Lab, Bank and Green Economy ObservatoryFinancial tools / 2
Enabling factors for a successful financing
90%
78% 78%
67%
60% 56%
44%
30%
0%
Bigger size of the Working project over Less bureaucracy Less complexity in the Lower payback period
investment all the debt repayment technical-economic
period validation of the
projects
Source: Abi Lab, Bank and Green Economy ObservatoryFinancial tools / 3
Target sectors for new financial products
70%
60% 60% 60%
60%
50%
40% 40% 40%
40%
30%
20%
20%
10%
0%
Services SMEs Large Households Block of flats ESCOs Public
enterprises Administration
Source: Abi Lab, Bank and Green Economy ObservatoryEnergy Performance Contracts (EPC) New EPC guidelines, released by ENEA in March 2017 and updated in October 2017, aim to provide public administrators with a tool to support and guide the drafting of EPC, customized on specific individual projects. In November 2017, the updated guidelines were under public consultation of the main involved stakeholders. A new version will be soon released. New guidelines are consistent with the Energy Efficiency Directive and the latest legislation, such as the Italian Legislative Decree 50/2016 as amended (New Code of Public Contracts), and the Italian Ministerial Decree 11 October 2017 concerning the Minimum Environmental Criteria of the assignment of design and works services.
Renovation of Central Government buildings

Programme for the Energy Renovation of Buildings of the Central Government
              Year                    Submitted projects   Selected projects   Budget of selected projects (€)
              2014                           30                   22                    10.769.620
              2015                           122                  47                    62.228.613
              2016                           89                   32                    60.207.917
              2017                           83                   39                    37.412.007
              Total                          324                 140                   170.618.157

  Source: Ministry of Economic Development

2014-2020 budget of 355M€, with the technical validation and selection
of submitted projects by ENEA and GSE.
Final ranking on the basis of the possibility of Public Private
Partnership for the implementation of the action also.
2007-2013 ERDF and Cohesion Funds
Energy efficiency projects concluded and paid off, and related available resources (M€)
Projects Total public Committment Total payment
Programme
(n) financing (M€) (M€) (M€)
Regional Operational Programmes (ROP), Regional Competitiveness and Employment (RCE) - ERDF 1,781 676.3 711.9 679.1
Regional Operational Programmes (ROP), Convergence (CONV) - ERDF 457 492.4 520.4 494.4
Interregional Operational Programme (IOP) "Renewable energy and energy saving", Axis II 1,091 742.6 722.5 731.7
Regional Action Plan of Cohesion and Development Fund (CDF) 92 586.9 588.3 587.4
Cohesion Plan of Action 14 60.8 62.8 61.1
National Operational Programme (NOP) ERDF Convergence "Networks & Mobility" 13 473.3 472.8 473.3
TOTAL energy efficiency projects concluded and paid off 3,448 3,032.3 3,078.7 3,027.0
TOTAL energy efficiency projects 4,130 10,011.9 6,839.8 5,320.3
of which started from 2014 onwards, concluded and paid off 1,752 1,251.8 1,320.7 1,275.2
Source: ENEA elaboration
More than 10 billion euros of public financing for energy efficiency 4,100
projects (about 83% of the total were concluded and paid off). Around
42% of all selected projects have been launched from 2014 onwards and
are concluded or paid off (1.25 billion euros of public funding).NZEBs – ENEA national observatory
International
and National
state of the art
Further data and Quality
Data from Energy
information control of Statistics and
Performance
through ad hoc data and indicators
Certificates
surveys information
Source: ENEANZEBs – ENEA national observatory The NZEB characteristics in Italy were set through the Italian Decree 26 June 2015 “Minimum requirements”: new and existing buildings are considered NZEBs if both the decree's performance requirements and the obligations regarding the integration of renewable sources dictated by Italian Legislative Decree 28/2011 are met. Thanks also to more stringent obligations, imposed in advance with respect to the 2019 and 2021deadlines, in 2016-2017 period the NZEBs in Italy are approximately 600, mainly new (80%) and residential buildings (88%). Without an approach focused on the life cycle of the building, the payback time of investment in NZEBs is in many cases longer than the useful life of the building itself. Initial costs vary from 3,000-3,500 €/m2 for detached houses to around 1,500 €/m2 for multi-family buildings.
Energy poverty / 1
The main causes of energy poverty are
linked to a complex interaction between
low income, inadequate energy
efficiency in housing and energy costs,
all of which are grafted into the debate
on the fight against climate change and
the fight against poverty.
Fuel poverty
Energy poverty           Common and
                         acknowledged
Energy vulnerability
                         definition
Energy insecurity                          Source: ENEA elaboration on ASSIST project
Energy poverty / 2
For 2017 Italy’s National Energy Strategy, approach based on UK Low
Income - High Costs (*) for assessing the incidence of energy poverty (**):
• High level of energy expenditure 20%
• Total expenditure (net of energy 16% European Commission
expenses) below the relative 12%
poverty threshold 8%
Faiella-Lavecchia
• Null value for the purchase of 4%
heating products for households 0%
with an overall expenditure
lower than the median Source: Ministry of Economic Development
* Hills, John (2011), “Fuel poverty: the problem and its measurement”, CASEreport, 69. Department for Energy and Climate Change, London, UK.
** Faiella, Ivan e Lavecchia, Luciano, (2015), "Energy Poverty in Italy" Politica economica, Società editrice il Mulino, issue 1, pages 27-76.Energy poverty / 3
Barrier Description
Behaviour Lack of awarness
Domestic energy consumption
Lack of information about:
Available solution and incentives
Conflicts Split incentives
Incentives Distorsion due to subsidies
Lack of savings
Financial
Low credit standing
Perception of risk Risk aversion
Source: Energy Efficiency for Low-Income Households, ITRE Report, European Parliament, 2016Energy poverty / 4
MATRIX OF
ENERGY POVERTY TOOLS Financial
tools Market-based
tools
IMPACT
HIGH
Informative
tools
LOW
Normative
tools
Fiscal tools
TEMPORARY STRUCTURAL
IMPACTEnergy poverty / 5
MATRIX OF
ENERGY POVERTY TOOLS
Gas and
ECOBONUS
electricity bonus
TEMPORARY STRUCTURAL
IMPACTOne-Stop-Shops Data, information, advise and good practices about: • high quality energy renovation project • analysis and identification of potential savings • implementation of the projects • guidance in the choice of companies • study of the related financing plan based on concessions, mortgages and/or incentive mechanisms, • after-sales assistance • insurance products
3-year Information & Training Programme: definition
       February 7th, 2017: one day of brain storming for
       the definition of the activities of the second year of
       the Programme.
       Anaylisys of barriers, key messages to be
       delivered and related tools and actions for:
        • SMEs and large enterprises
        • Credit sector
        • Public bodies
        • Households and blocks of flat
3-year Information & Training Programme: projects Source: ENEA
3-year Information & Training Programme: language / 1

   Facebook

   Twitter

   Youtube
                                          Source: Facebook

   Instagram

   LinkedIn

                                           Source: Twitter
               Male   Female
3-year Information & Training Programme: language / 2
Facebook
Twitter
Youtube
Source: Youtube
Instagram
LinkedIn
Source: Instagram
Male Female3-year Information & Training Programme: language / 3
Facebook
Twitter
Youtube
Instagram
LinkedIn
Source: LinkedInNext stops
• Ecobonus: credit transfer
• (Deep or NZEB) Renovation of (public) buildings
• Energy audits (in SMEs)
• Energy poverty
• Bankability of projects
• One-stop-shops
• ERDF and Cohesion FundsSWOT analysis
Strengths Weaknesses
Consolidated incentive mechanisms Requirement of specialised skills for ESCos and the
banking sector
Developed ESCo sector
Difficulty in implement long-term projects with the best
Developed accreditation/certification system cost/effectiveness ratio
Structural Funds planned at a regional level Low participation in life-long learning
High participation in the Covenant of Mayors Negative trend in the construction and automotive sectors
Opportunities Risks
Potential still high in different areas, with long- Difficulty in accessing credit
. term effects Constraints on public spending for public sector projects
Flexibility of Energy Performance Contract Short-term vision of entrepreneurs
Sharing information and project standardisation Poor economic attractiveness of projects/investments
Readdressing measures towards 2020 goals Regulatory instability
Dissemination of an energy saving cultureGRAZIE! alessandro.federici@enea.it
You can also read