Jefferies Industrials Conference - August 2020
←
→
Page content transcription
If your browser does not render page correctly, please read the page content below

Jefferies Industrials Conference
    August 2020
1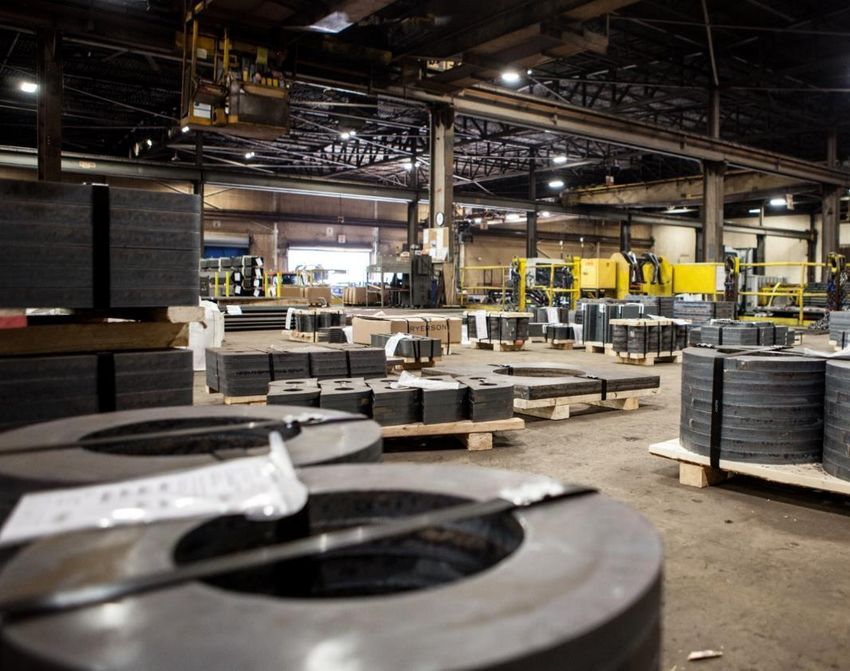
Important Information About Ryerson Holding Corporation
    These materials do not constitute an offer or solicitation to purchase or sell securities of Ryerson Holding Corporation (“Ryerson” or “the Company”) or its subsidiaries
    and no investment decision should be made based upon the information provided herein. Ryerson strongly urges you to review its filings with the Securities and
    Exchange Commission, which can be found at https://ir.ryerson.com/financials/sec-filings/default.aspx. This site also provides additional information about
    Ryerson.

    Safe Harbor Provision
    Certain statements made in this presentation and other written or oral statements made by or on behalf of the Company constitute "forward-looking statements" within
    the meaning of the federal securities laws, including statements regarding our future performance, as well as management's expectations, beliefs, intentions, plans,
    estimates, objectives, or projections relating to the future. Such statements can be identified by the use of forward-looking terminology such as “objectives,” “goals,”
    “preliminary,” “range,” "believes," "expects," "may," "estimates," "will," "should," "plans," or "anticipates" or the negative thereof or other variations thereon or
    comparable terminology, or by discussions of strategy. The Company cautions that any such forward-looking statements are not guarantees of future performance
    and may involve significant risks and uncertainties, and that actual results may vary materially from those in the forward-looking statements as a result of various
    factors. Among the factors that significantly impact our business are: the cyclicality of our business; the highly competitive, volatile, and fragmented metals industry in
    which we operate; fluctuating metal prices; our substantial indebtedness and the covenants in instruments governing such indebtedness; the integration of acquired
    operations; regulatory and other operational risks associated with our operations located inside and outside of the United States; impacts and implications of adverse
    health events, including the COVID-19 pandemic; work stoppages; obligations under certain employee retirement benefit plans; the ownership of a majority of our
    equity securities by a single investor group; currency fluctuations; and consolidation in the metals industry. Forward-looking statements should, therefore, be
    considered in light of various factors, including those set forth above and those set forth under "Risk Factors" in our annual report on Form 10-K for the year ended
    December 31, 2019, and in our other filings with the Securities and Exchange Commission. Moreover, we caution against placing undue reliance on these
    statements, which speak only as of the date they were made. The Company does not undertake any obligation to publicly update or revise any forward-looking
    statements to reflect future events or circumstances, new information or otherwise.

    Non-GAAP Measures
    Certain measures contained in these slides or the related presentation are not measures calculated in accordance with generally accepted accounting principles
    (“GAAP”). They should not be considered a replacement for GAAP results. Non-GAAP financial measures appearing in these slides are identified in the footnotes.
    A reconciliation of these non-GAAP measures to the most directly comparable GAAP financial measures is included in the Appendix.

2                                                                                                                                                                             2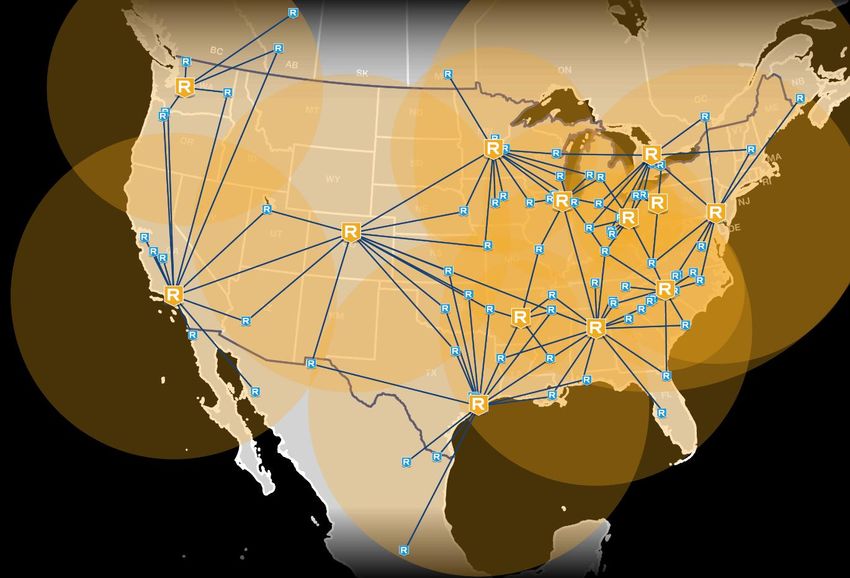
Business Overview
         Eddie Lehner        Molly Kannan
         President & Chief   Corporate Controller &
         Executive Officer   Chief Accounting Officer

3
Consistently Better In Every Way
    Successful Refinance of 11.00% 2022 Notes
    Achieved a coupon 250 bps lower on a reduced principal amount, favorable redemption terms which provide further
    deleveraging optionality, and an 8-year runway for future operating model enhancements.

    Credit Rating Upgrade Driven by an Improved Through-the-Cycle Operating Model
    Since the 2016 bond offering, each ratings agency that covers Ryerson has either upgraded Ryerson’s rating or issued a favorable
    first-time rating in recognition of the improved operating model, which illustrates stronger through-the-cycle performance, expanded
    customer base, larger market share, and a leaner, more variable cost structure post-COVID.

    Strong Real Estate Portfolio with Unrealized Appreciation
    Ryerson’s owned real estate has a value estimate of over $425M (>2x net book value) based on an extrapolation of the
    sale-leaseback transaction completed in Q4 2019, proving strong market value for Ryerson’s real estate.

    Lower Legacy Liabilities
    Ryerson’s fixed cash commitments have decreased significantly, driven by lower pension obligations and lower interest
    payments, which are expected to further decrease upon further improvements in the operating model & capital structure.

    Higher Book Value of Equity
    As of the end of the second quarter of 2020, Ryerson has increased book value of equity by $347M since 2010.

4                                                                                                                                          4
Intelligent Network
of Service Centers

 178
 Years

 ~   100
 Locations

  42,000
  Customers

  75,000
  Products

     Creating great customer
         experiences at
 Speed, Scale, & Consistency
  in a fragmented industrial metals
5           marketplace
Diverse End-Markets – More than 42,000 Active Customers
    Secular growth end markets emerging in climate/HVAC, cloud computing, and e-commerce

                                                                                                                        Includes electric
                                                                                                                            vehicles &
                                                                                                                             software
                                                                                                                          infrastructure
                                                                       Metal                    Industrial
                                                                     Fabrication               Equipment
                                                                    and Machine                   18%
                                                                     Shop 23%

                                                                                                        Commercial
                                                            Other 4%                                      Ground              Includes
                                                                                                       Transportation
                                                            Oil & Gas                                      16%               automation
                                                                4%

                                                               HVAC 6%
                                     Includes                                                    Consumer
                                    renewable                           Construction   Food
                                                                                                Durable 11%
                                      energy                             Equipment Processing &
                                                                            8%       Ag 10%

                                                                                                                              Includes
    End market percentages are based on 2019 sales as disclosed in Ryerson’s
    Annual Report on Form 10-K for the year ended December 31, 2019.
                                                                                                                          electric vehicles

6                                                                                                                                             6
COVID-19 Response: Dual Mandate
    Continuing to operate as an essential business adhering to our comprehensive COVID-19 response
    focused on the health and safety of employees as well as liquidity and recovery capacity

        Health & Safety                                        Liquidity & Recovery Capacity
        •COVID-19 Task Force commissioned and operating        •Working capital targets established, actions in progress
        •Sanitation best practices implemented in facilities   •Capex spend controls in place with revised budget of
        •Social distancing/workspace distancing                 $25M from $45M for 2020
        •Non-essential travel suspension                       •Footprint optimization plans accelerated
        •Remote work/alternating work migration                •Expense reduction plans and controls in place
        •Increased communication through various mediums       •Reduction of approximately 18% of the workforce
         including email, video, and routine huddles           •Officer and salaried employee compensation reductions
        •Reopening policies and procedures                     •CARES Act & Canada Legislation enablement – All
                                                                program aid evaluated and in play where applicable

7                                                                                                                          7
Strong Liquidity to Fund Operations and Investments
Ryerson has ample liquidity to fund operations throughout the COVID-19 crisis
    ($M)
                                                        •   Liquidity decreased quarter-over-quarter
                                                            due to a lower borrowing base from reduced
                                                            inventories and receivables.
                                                        •   We had drawn upon on our credit facility in
                                                            March consistent with Ryerson’s Pandemic
                                                            Response Plan given the resultant volatility
                                                            and uncertainty, and our cash position will
                                                            normalize as economic conditions normalize.
                                                        •   Also in-line with our pandemic response
                                                            plan, we established aggressive working
                                                            capital targets, and effectively reduced
                                                            inventories during the period by more than
                                                            95,000 tons, or approximately 20%, while
                                                            repositioning to match current levels of
                                                            demand.

8                                                                                                     8
Stronger Cycle Resilience: Better in the “Ups” & through the “Downs”
    Ryerson's Improvements Show Through When Comparing Recessionary Periods
                                                      1st Comparative Period                 2nd Comparative Period                      Current Period

         $M                                        2008         2009         2010         2014         2015         2016         2018         2019        1H 2020

         Gross Margin, excl. LIFO                  15.1%        9.2%        15.2%        17.6%        16.0%        19.7%        19.2%        16.9%        17.1%

         Expenses excl. D&A as a % of Sales        10.3%       14.6%        12.0%        11.9%        12.9%        14.2%        12.7%        12.8%        14.2%

         Adj. EBITDA, excl. LIFO                   $277        ($137)        $134         $218         $109        $178          $308         $190         $55

         Interest Coverage Ratio                    2.5x         ∞*          1.2x         2.0x         1.1x         2.0x         3.1x         2.0x         1.3x

         Cash Conversion Cycle                      103          101          86           94           91           80           75           78           82

         Net Debt                                  $900         $639        $1,128       $1,171        $958         $882        $1,130        $923         $793

         Leverage Ratio                             3.2x         ∞*          8.5x         5.4x         8.8x         5.0x         3.7x         4.9x         6.0x

         Pension Liability                         $296         $323         $306         $277         $238         $216         $181         $140         $130

         Book Value of Equity                      $392         $154        ($183)       ($125)       ($141)        ($49)        $76          $179         $164

         U.S. Industry Shipments, Tons              48M          31M         37M          45M          41M          39M          42M          39M          17M
         Bloomberg Commodity Index                  117          139          162          104          79           88           77           81           65

     •    Ryerson continues improving operating metrics and leverage ratios through the cycle from peak to trough.
     •    As of the end Q2 2020, Ryerson has increased net book value of equity by $347M since 2010.

                                    *2009 leverage ratio not meaningful since it is calculated as net debt / Adj. EBITDA, excl. LIFO and the latter was negative in 2009.
9                                                                                                                                                                           9
Successful Refinance: Achievements Illuminated & Optionality Secured
Ryerson has driven down net debt and fixed cash commitments as part of its transformation strategy
and has now secured a lower coupon and terms that grant optionality for further optimization
Net Debt ($M) Reduced Interest
2012 2016 2020
Principal Amount $900M $650M $500M
Coupon 9.75% 11.00% 8.50%
$1,130 $923 $793 Annual Interest $87.8M $71.5M $42.5M
2018 2019 Q2 2020
• Ryerson reduced net debt by $130M in the first half of 2020 to $793M, the lowest achieved in ten years.
• On July 22nd, Ryerson closed the refinance of its 11% Senior Secured Notes and issued $500M in 8.5% Senior Secured
Notes. The reduced coupon and principal amount is expected to save approximately $16M in annual interest expenses.
• Ryerson also secured favorable redemption terms, which will allow the Company to reduce the outstanding principal by up to
$100 million at 104% within the first two years, and up to 10% of the original principal in each of the first three years at 103%
10 10Best in Class Free Cash Flow Yield
Free cash flow yield over the past 22 quarters well above publicly traded peer group and
compares favorably with most companies over that time period
Annualized average figures
2015 - 2019 2015 - Q2 2020
Free cash flow $94M $133M
Market capitalization $330M $319M
Free cash flow yield 28% 42%
Improved operating profile had led to a 28% average free cash flow yield for the five-year period
of 2015-2019. Countercyclical cash flow generation thus far in 2020 has driven that average yield
up to 42%.
*Free cash flow calculated as net cash flow provided by (used in) operating activities plus proceeds from sales of property, plant, & equipment, less capital expenditures.
*Market capitalization represents an average of the beginning and ending shares outstanding, multiplied by average daily share price.
11 11Strategic Priorities for Obtaining Next Phase Targets
Reduce net leverage as further operating model
improvement realizations take effect
Ryerson digitalization initiatives and footprint
optimization work drive differentiation in the industry
Increase value-add as a percentage of sales as
investments of past five years take deeper root
Achieve Central Steel & Wire long-term, mid-cycle targets
for revenue, EBITDA and working capital management
2.0x Net Debt / Adj. $600m/$50M CS&W Net 20% Gross Margin,
6% U.S. Market Share 15% Value-Add Mix
EBITDA, excl. LIFO Sales/Adj. EBITDA, excl. LIFO excl. LIFO
12 12Navigating Through the Unprecedented 2020 Environment
Uncertainties Risks
Growth Supportive Factors
- Asynchronous Virus Uncertainty - Political Risk
- Low Imports
- Continued Fiscal and Monetary - Debt Levels
- Inventory Replenishment
Stimulus - Global Trade Tensions
- Fiscal Stimulus
- Working Capital Flywheel RPM’s
- Supply Side Responses
- Labor Market
- Reshoring Dislocations/Unemployment
- YITTB- Yes, It’s Time to Build - Business Investment Confidence
Movement - Consumer Confidence
13 13Eventually This Bill Comes Due … It’s Past Due Recent Events Further Underscore The Need 14 14
Ryerson Takeaways
     Moving Through and Looking Beyond The Pandemic

        Enhanced Operating Leverage Through Ongoing Operating Model Improvements

        Vastly Improved Collateralization

        Improved Through-The-Cycle Leverage

        Strong Liquidity

        Generating Positive Cash Flow from Operating Activities

        Lower Structural Legacy Liabilities

        Optionality for Further Deleveraging Secured Through New 8-year Notes

15                                                                                 15
YES, IT’S TIME
TO BUILD
#YITTB
16Appendix 17
Q2 2020 Key Financial Metrics
       Significant operating cash flow generation leading to lowest net debt level in ten years, liquidity & recovery
       capacity intact, Senior Secured Notes refinanced at a lower coupon with 8-year tenor & improved covenants

                                                                                                                                     Cash from
                                         Gross Margin,                        Diluted Adjusted                Adj. EBITDA, excl.
        Net Sales                                                                                                                    Operating
                                           excl. LIFO                        Earnings per Share                      LIFO
                                                                                                                                     Activities

Second Quarter
    $772M                                  16.8%                                  ($0.64)                        $21M               $103M
   -36% vs. Q2’19                      +30 bps vs. Q2’19                         -$1.09 vs. Q2’19              -$30M vs. Q2’19     +36M vs. Q2’19
   -24% vs. Q1'20                      -60 bps vs. Q1’20                         -$1.05 vs. Q1’20              -$13M vs. Q1’20     +30M vs. Q1’20

 First Half
       $1.8B                               17.1%                                  ($0.22)                        $55M               $176M
    -27% vs. 1H’19                     +30 bps vs. 1H’19                         -$1.46 vs. 1H’19              -$59M vs. 1H’19     +128M vs. 1H’19
A reconciliation of non-GAAP financial measures to the comparable GAAP measure is included in the Appendix.
.

  18                                                                                                                                              18
Generating Significant Free Cash Flow Through The Cycle
Improved operating profile expected to generate higher through-the-cycle quality of earnings & less cash flow
generation volatility
$5,310
$4,730
$4,408 $4,502
$3,896 $4,025 Generated
$3,460 $3,622
$3,365
$277
$3,066 $3,167
$2,860
$308
$1.1B
$223 $202 $218
$178 $184 $190
$1,782
of FCF despite
$170
$134
$109 business cycles
$55
and capital
-$137
expenditures of
2008 2009 2010 2011 2012 2013 2014 2015 2016 2017 2018 2019 H1 2020
$376M
$283 $280 $247 $217 $164
$158
$19 $33 $5 $25
($24)
($88)
($220)
$M 2008 2009 2010 2011 2012 2013 2014 2015 2016 2017 2018 2019 H1 2020 Total
Cash Flow from Operating Activities $281 $285 ($199) $55 $187 $48 ($73) $259 $25 ($3) $57 $193 $176 $1,291
Less: Capital Expenditures 30 23 27 47 41 20 22 22 23 25 38 46 12 $376
Plus: Asset Sales 32 18 6 11 12 5 7 10 3 4 6 70 0 $184
Free Cash Flow (FCF) $283 $280 ($220) $19 $158 $33 ($88) $247 $5 ($24) $25 $217 $164 $1,099
19 19Building a Better Ryerson: CS&W Transformation
Upon closing the acquisition in July of 2018, Ryerson gained an expanded footprint and complementary
product offering and has since been actively implementing Ryerson’s industry leading expense and working
capital management practices, driving towards achievement of our long-term, mid-cycle CS&W targets.
2018 2019 2020 2021 2022 2023
Refocus,
Rationalize Stabilize &
Retool &
Optimize
Grow
✓ Integrate complementary ❑ Improve working capital ❑ Invest in infrastructure & Achieve CS&W’s long-term,
product offering management equipment mid-cycle targets:
✓ Consolidate overlapping ❑ Streamline production & ❑ Upgrade technologies & ❑ Revenue $600M
locations logistics processes software ❑ Adj. EBITDA, excl.
✓ Execute structural expense LIFO of $50M
take outs
20 20CS&W Transformation: Q2 2020 Results
Two years since acquisition, CS&W has generated $146M in cash flows, or approximately 90% of its purchase price. While
affected by the second quarter’s pandemic induced demand weakness, CS&W’s expense decrease outpaced the volume
contraction and margins remained above 2019 levels.
20.4% 22.1% $146M
Gross Margin, excl. LIFO, above 2019 Decrease in Operating Expenses Cash Flows since acquisition,
levels despite pandemic environment Q2 ’20 vs. Q1 ‘20 ~90% of purchase price
Tons Shipped & Gross Margin, excl. LIFO Operating Expenses
*Operating expenses exclude restructuring charges
21 21Same-Store Financial Metrics Reconciliation
Central Steel & Wire contributed $216M in net sales to Ryerson’s first half results
First Half 2020
Central Steel & Ryerson Same Ryerson Holding
$M, Tons 000's
Wire Company Store Corporation
Tons Shipped 139 889 1,028
Net Sales $215.6 $1,566.5 $1,782.1
Gross Margin, excluding LIFO 21.8% 16.5% 17.1%
Warehousing, delivery, selling, general, &
$48.4 $231.4 $279.8
administrative expenses
As a percentage of revenue 22.4% 14.8% 15.7%
Adj. EBITDA, excl. LIFO $0.1 $54.9 $55.0
Adj. EBITDA % of sales 0.0% 3.5% 3.1%
22 22Annual Financial Highlights
Tons Sold (000’s) Average Selling Price Per Ton
2,024 1,897 1,903 2,000 2,268 2,381 $1,790 $1,670 $1,503 $1,682 $1,944 $1,891
2014 2015 2016 2017 2018 2019 2014 2015 2016 2017 2018 2019
Gross Margin & Gross Margin, excl. LIFO Adjusted EBITDA, excl. LIFO Margin %
Gross Margin % Gross Margin, excl. LIFO
20.0%
19.7%
19.2%
18.4%
17.9%
17.9%
17.6%
17.3%
17.2%
16.9%
16.4%
16.0%
6.0% 3.4% 6.2% 5.5% 7.0% 4.2%
2014 2015 2016 2017 2018 2019 2014 2015 2016 2017 2018 2019
A reconciliation of non-GAAP financial measures to the comparable GAAP measure is included in this Appendix.
23 23Quarterly Financial Highlights
Tons Sold (000’s) Average Selling Price Per Ton
623 598 541 566 462 $1,934 $1,847 $1,777 $1,785 $1,671
Q2 2019 Q3 2019 Q4 2019 Q1 2020 Q2 2020 Q2 2019 Q3 2019 Q4 2019 Q1 2020 Q2 2020
Gross Margin & Gross Margin, excl. LIFO Adjusted EBITDA, excl. LIFO Margin %
Gross Margin % Gross Margin, excl. LIFO
19.4%
18.8%
18.5%
18.1%
17.6%
17.4%
16.8%
16.5%
15.8%
15.0%
4.2% 2.7% 4.9% 3.4% 2.7%
Q2 2019 Q3 2019 Q4 2019 Q1 2020 Q2 2020 Q2 2019 Q3 2019 Q4 2019 Q1 2020 Q2 2020
A reconciliation of non-GAAP financial measures to the comparable GAAP measure is included in this Appendix.
24 24Ryerson’s Commitment to our Employees and Communities
Safety Sustainability Community Support
We consistently outperform the Although our operations by their nature do not The Ryerson Gives Back
Bureau of Labor Statistics, and, have a significant impact on the environment, program supports active
in the first half of 2020, our we continue to: employee involvement in
safety record as measured by ✓ Purchase metal produced using recycled numerous local community
OSHA’s TRI metric of total materials or scrap melted in electric arc volunteer activities, from serving
recordable incidents declined to furnaces and sell scrap to recyclers in food kitchens to children’s
a five-year low, indicating that ✓ Use propane fuel to operate forklifts causes and educational
our workplace is becoming even ✓ Install energy efficient lighting programs. Ryerson also awards
safer and our culture of ✓ Utilize energy efficient diesel tractors college sponsorship and tuition
workplace safety is being reimbursement.
internalized and embedded in
our behaviors.
25 25Experienced Management Team
Years in Years at Years in
Executive Title
Position Ryerson Industry
Eddie Lehner(1) President & Chief Executive Officer 5 8 31
Mike Burbach President - North / West Region 13 36 36
Kevin Richardson President - South / East Region 13 35 35
Molly Kannan(2) Controller and Chief Accounting Officer 6 13 13
John Orth Executive Vice President – Operations 3 3 28
Executive Vice President, General
Mark Silver 5 8 8
Counsel & Chief HR Officer
Srini Sundarrajan Chief Information Officer 2 2 2
Jim Claussen President - Central Steel & Wire 2 19 26
(1)
Eddie Lehner previously served as Ryerson's Executive Vice President and Chief Financial Officer.
(2)
Molly Kannan has served as Ryerson's Controller since 2015 and became Chief Accounting Officer in January 2020.
26 26Non-GAAP Reconciliation
EBITDA represents net income before interest and other expense on debt, provision (benefit) for income taxes, depreciation, and amortization.
Adjusted EBITDA gives further effect to, among other things, gain on the sale of assets, gain on insurance settlements, reorganization expenses,
purchase considerations and other transaction costs, gain (loss) on retirement of debt, and foreign currency transaction gains and losses. We believe
that the presentation of EBITDA, Adjusted EBITDA, and Adjusted EBITDA, excluding LIFO expense (income), provides useful information to investors
regarding our operational performance because they enhance an investor’s overall understanding of our core financial performance and provide a
basis of comparison of results between current, past, and future periods. We also disclose the metric Adjusted EBITDA, excluding LIFO expense
(income), to provide a means of comparison amongst our competitors who may not use the same basis of accounting for inventories. EBITDA,
Adjusted EBITDA, and Adjusted EBITDA, excluding LIFO expense (income), are three of the primary metrics management uses for planning and
forecasting in future periods, including trending and analyzing the core operating performance of our business without the effect of U.S. generally
accepted accounting principles, or GAAP, expenses, revenues, and gains (losses) that are unrelated to the day to day performance of our business.
We also establish compensation programs for our executive management and regional employees that are based upon the achievement of pre-
established EBITDA, Adjusted EBITDA, and Adjusted EBITDA, excluding LIFO expense (income), targets. We also use EBITDA, Adjusted EBITDA,
and Adjusted EBITDA, excluding LIFO expense (income), to benchmark our operating performance to that of our competitors. EBITDA, Adjusted
EBITDA, and Adjusted EBITDA, excluding LIFO expense (income), do not represent, and should not be used as a substitute for, net income or cash
flows from operations as determined in accordance with generally accepted accounting principles, and neither EBITDA, Adjusted EBITDA, and
Adjusted EBITDA, excluding LIFO expense (income), is necessarily an indication of whether cash flow will be sufficient to fund our cash requirements.
This release also presents gross margin, excluding LIFO expense (income), which is calculated as gross profit plus LIFO expense (or minus LIFO
income), divided by net sales. We have excluded LIFO expense (income) from gross margin and Adjusted EBITDA as a percentage of net sales
metrics in order to provide a means of comparison amongst our competitors who may not use the same basis of accounting for inventories as we do.
Our definitions of EBITDA, Adjusted EBITDA, and Adjusted EBITDA, excluding LIFO expense (income), as a percentage of sales may differ from that
of other companies. We also present net debt defined as total debt less cash and cash equivalents, and restricted cash from sales of property, plant,
and equipment, and marketable securities. We believe that net debt provides a clearer perspective of the Company’s overall debt situation and is used
by management to evaluate our progress toward improving our debt profile. Net debt should not be used as a substitute for total debt outstanding as
determined in accordance with GAAP.
27 27Non-GAAP Reconciliation: Adjusted EBITDA, excl. LIFO
($M) Q1 '19 Q2 '19 Q3 '19 Q4 '19 Q1 '20 Q2 '20
Tons Sold (000's) 619 623 598 541 566 462
Net Sales 1,230.8 1,204.9 1,104.4 961.5 1,010.3 771.8
Gross Profit 231.3 211.8 204.4 180.4 195.8 115.5
Gross Profit per Ton 374 340 342 333 346 250
Gross Margin 18.8% 17.6% 18.5% 18.8% 19.4% 15.0%
LIFO expense (income) (20.1) (12.9) (29.6) (6.5) (20.2) 14.1
Gross Profit, excluding LIFO 211.2 198.9 174.8 173.9 175.6 129.6
Gross Profit, excluding LIFO per Ton 342 319 293 321 310 281
Gross Margin, excluding LIFO 17.2% 16.5% 15.8% 18.1% 17.4% 16.8%
Warehousing, delivery, selling, general, and administrative expenses 163.7 164.6 165.6 142.9 155.7 124.1
Depreciation and amortization expense 14.2 14.5 15.6 14.1 13.3 13.6
Warehousing, delivery, selling, general, and administrative expenses
excluding depreciation and amortization 149.5 150.1 150.0 128.8 142.4 110.5
Warehousing, delivery, selling, general, and administrative expenses
excluding depreciation and amortization % of net sales 12.1% 12.5% 13.6% 13.4% 14.1% 14.3%
Net income (loss) attributable to Ryerson Holding Corporation 29.5 16.4 10.1 26.4 16.4 (25.6)
Interest and other expense on debt 23.9 23.9 23.2 22.2 21.7 19.3
Provision (benefit) for income taxes 13.0 5.5 6.3 7.7 2.9 (4.5)
Depreciation and amortization expense 14.2 14.5 15.6 14.1 13.3 13.6
EBITDA 80.6 60.3 55.2 70.4 54.3 2.8
Reorganization 0.9 2.0 4.0 2.4 0.8 3.8
Gain on sale of assets - - - (20.6) - -
Gain on insurance settlements - - (1.5) - - -
(Gain) loss on retirement of debt 0.2 - - - (0.8) (0.1)
Foreign currency transaction (gains) losses 0.6 0.2 0.4 (0.1) (0.1) 0.1
Purchase consideration and other transaction costs 0.9 0.9 1.0 1.3 0.4 -
Other adjustments (0.1) 0.2 - - - (0.1)
Adjusted EBITDA 83.1 63.6 59.1 53.4 54.6 6.5
LIFO expense (income) (20.1) (12.9) (29.6) (6.5) (20.2) 14.1
Adjusted EBITDA, excluding LIFO 63.0 50.7 29.5 46.9 34.4 20.6
Adjusted EBITDA Margin, excluding LIFO 5.1% 4.2% 2.7% 4.9% 3.4% 2.7%
Net income includes a vacation accrual adjustment of $11M in Q4 2019. `
28 28Non-GAAP Reconciliation: Annual
($M) 2008 2009 2010 2011 2012 2013 2014 2015 2016 2017 2018 2019
Tons Sold (000's) 2,505 1,881 2,252 2,433 2,149 2,038 2,024 1,897 1,903 2,000 2,268 2,381
Net Sales 5,309.8 3,066.1 3,895.5 4,729.8 4,024.7 3,460.3 3,622.2 3,167.2 2,859.7 3,364.7 4,408.4 4,501.6
Gross Profit 712.9 456.1 539.8 658.8 709.6 616.6 593.8 567.7 570.6 582.5 758.1 827.9
Gross Profit per Ton 284.6 242.5 239.7 270.8 330.2 302 293 299 300 291 334 348
Gross Margin 13.4% 14.9% 13.9% 13.9% 17.6% 17.8% 16.4% 17.9% 20.0% 17.3% 17.2% 18.4%
LIFO Expense (Income), net 91.5 (174.2) 52.4 48.6 (63.1) (33.0) 42.3 (59.5) (6.6) 19.9 90.2 (69.1)
Purchase Accounting Adjustments - - - - - - - - - - - -
Gross Profit, excluding LIFO 804.4 281.9 592.2 707.4 646.5 583.6 636.1 508.2 564.0 602.4 848.3 758.8
Gross Profit, excluding LIFO per Ton 321 150 263 291 301 286 314 268 296 301 374 319
Gross Margin, excluding LIFO 15.1% 9.2% 15.2% 15.0% 16.1% 16.9% 17.6% 16.0% 19.7% 17.9% 19.2% 16.9%
Warehousing, delivery, selling, general, and administrative expenses 586.1 483.8 506.9 539.7 508.9 480.1 509.2 450.8 447.5 481.4 614.7 636.8
IPO-related expenses - - - - - - 32.7 - - - - -
Depreciation and amortization expense 37.6 36.9 38.4 43.0 47.0 46.6 45.6 43.7 42.5 47.1 52.9 58.4
Warehousing, delivery, selling, general, and administrative expenses
excluding depreciation and amortization and IPO-related expenses 548.5 446.9 468.5 496.7 461.9 433.5 430.9 407.1 405.0 434.3 561.8 578.4
Warehousing, delivery, selling, general, and administrative expenses
excluding depreciation and amortization % of net sales 10.3% 14.6% 12.0% 10.5% 11.5% 12.5% 11.9% 12.9% 14.2% 12.9% 12.7% 12.8%
Net Income (Loss) attributable to Ryerson Holding Corporation 32.5 (190.7) (104.0) (8.1) 47.1 127.3 (25.7) (0.5) 18.7 17.1 106.0 82.4
Interest and other expense on debt 109.9 72.9 107.5 123.1 126.5 110.5 107.4 96.3 89.9 91.0 99.2 93.2
Provision (benefit) for income taxes 14.8 67.5 13.1 (11.0) (5.5) (112.3) (0.7) 3.7 7.2 (1.3) 10.3 32.5
Depreciation and amortization expense 37.6 36.9 38.4 43.0 47.0 46.6 45.6 43.7 42.5 47.1 52.9 58.4
EBITDA 194.8 (13.4) 55.0 147.0 215.1 172.1 126.6 143.2 158.3 153.9 268.4 266.5
Reorganization 15.3 19.9 19.1 17.8 5.8 11.5 5.4 9.7 6.6 4.1 6.1 9.3
Gain on sale of assets - (3.3) - - - - (1.8) (1.9) - - - (20.6)
Gain on settlements - - (2.6) - - - (0.4) (4.4) - - - (1.5)
Advisory service fee 5.0 5.0 5.0 5.0 5.0 5.0 28.3 - - - - -
(Gain) loss on retirement of debt (18.2) (2.7) - - 32.8 - 11.2 (0.3) 8.7 - 1.7 0.2
Gain on bond investment sale (6.7) -
Foreign currency transaction (gains) losses (1.0) 14.8 2.7 0.8 1.5 (3.7) (5.3) (1.5) 3.9 2.0 (2.5) 1.1
Impairment charges on assets - 19.3 1.4 9.3 1.0 10.0 - 20.0 5.2 0.2 - -
Gain on bargain purchase - - - (5.8) - - - - - - (70.0) -
Purchase consideration and other transaction costs - - - - 4.3 3.5 11.2 3.7 1.5 3.9 14.3 4.1
Other adjustments (3.3) (2.1) 0.5 0.4 (0.8) 4.2 - - 0.4 0.1 (0.2) 0.1
Adjusted EBITDA 185.9 37.5 81.1 174.5 264.7 202.6 175.2 168.5 184.6 164.2 217.8 259.2
LIFO (Income) Expense, net 91.5 (174.2) 52.4 48.6 (63.1) (33.0) 42.3 (59.5) (6.6) 19.9 90.2 (69.1)
Adjusted EBITDA, excluding LIFO 277.4 (136.7) 133.5 223.1 201.6 169.6 217.5 109.0 178.0 184.1 308.0 190.1
Adjusted EBITDA Margin, excluding LIFO, net 5.2% -4.5% 3.4% 4.7% 5.0% 4.9% 6.0% 3.4% 6.2% 5.5% 7.0% 4.2%
Net income includes gain on bargain purchase of $70M in 2018 for acquisition of CS&W and includes a favorable vacation accrual adjustment of $11M in 2019.
29 29Non-GAAP Reconciliations: Adjusted Net Income (Loss) & Net Debt
(Dollars and shares in millions, except per share data) Q2 '19 Q1 '20 Q2 '20
Net income (loss) attributable to Ryerson Holding Corporation $16.4 $16.4 ($25.6)
Restructuring and other charges 1.1 - 2.0
(Gain) loss on retirement of debt - (0.8) (0.1)
Provision (benefit) for income taxes (0.3) 0.2 (0.5)
Adjusted net income (loss) attributable to Ryerson Holding Corporation $17.2 $15.8 ($24.2)
Diluted adjusted earnings (loss) per share $0.45 $0.41 ($0.64)
Shares outstanding - diluted 37.9 38.2 38.1
(In millions) Q4 '18 Q2 '19 Q4 '19 Q1 '20 Q2 '20
Total debt $1,153 $1,116 $982 $1,096 $904
Less: cash and cash equivalents (23) (23) (11) (188) (100)
Less: restricted cash from sales of property,
- - (48) (15) (11)
plant, and equipment
Net debt $1,130 $1,093 $923 $893 $793
30 3031
You can also read


