H1 2019 RESULTS PRESENTATION - AUGUST 8, 2019 - CONTOURGLOBAL

Page created by Regina Baker
 
CONTINUE READING
H1 2019 RESULTS PRESENTATION - AUGUST 8, 2019 - CONTOURGLOBAL
H1 2019 Results Presentation
August 8, 2019
H1 2019 RESULTS PRESENTATION - AUGUST 8, 2019 - CONTOURGLOBAL
Disclaimer

The information contained in these materials has been provided by ContourGlobal plc (“ContourGlobal” or the “Company”) and has not been independently verified.
No representation or warranty, express or implied, is made as to, and no reliance should be placed on, the fairness, accuracy, completeness or correctness of the
information or opinions contained herein. It is not the Company’s intention to provide, and you may not rely on these materials as providing, a complete or
comprehensive analysis of the Company’s financial position or prospects. The information and opinions contained in these materials are provided as at the date of
this presentation and are subject to change without notice. Neither the Company nor any of its affiliates, advisors or representatives shall have any liability
whatsoever (in negligence or otherwise) for any loss whatsoever arising from any use of this presentation or its contents or otherwise arising in connection with this
presentation.

Certain statements in this presentation are “forward-looking statements.” All statements other than statements of historical facts included in this presentation,
including, without limitation, those regarding the Company’s financial position, business strategy, plans and objectives of management for future operations, are
forward-looking statements. These statements involve a number of factors that could cause actual results to differ materially, including, but not limited to, changes
in economic, business, social, political and market conditions, success of business and operating initiatives, and changes in the legal and regulatory environment and
other government actions. Forward-looking statements contained in this presentation regarding past trends or activities should not be taken as a representation that
such trends or activities will continue in the future. Any forward-looking statement made during this presentation or in these materials speaks only as of the date on
which it is made. The Company assumes no obligation to update or revise any forward-looking statements.

Information contained herein relating to markets, market size, market share, market position, growth rates, penetration rates and other industry data pertaining
to the Company’s business is based on the Company’s estimates and is provided solely for illustrative purposes. In many cases, there is no readily available external
information to validate market-related analyses and estimates, thus requiring the Company to rely on internal surveys and studies. The Company has also compiled,
extracted and reproduced market or other industry data from external sources, including third parties or industry or general publications, for the purposes of
its internal surveys and studies. Any such information may be subject to significant uncertainty due to differing definitions of the relevant markets and market
segments described.

This presentation contains references to certain non-IFRS financial measures and operating measures. These supplemental measures should not be viewed in isolation
or as alternatives to measures of the Company’s financial condition, results of operations or cash flows as presented in accordance with IFRS in its consolidated
financial statements. The non-IFRS financial and operating measures used by the Company may differ from, and not be comparable to, similarly titled measures used
by other companies. The non-IFRS adjustments for all periods presented are based upon information and assumptions available as of the date of this presentation.

                                                                                                                                                                    2
H1 2019 RESULTS PRESENTATION - AUGUST 8, 2019 - CONTOURGLOBAL
Agenda

       Key Highlights for H1 2019

       Operations

       Financial Results

       Growth

HAGN 47MW Wind Park (Austria)       Bonaire 28MW   Orellana CSP 50MW solar farm (Spain)

                                                                                          3
H1 2019 RESULTS PRESENTATION - AUGUST 8, 2019 - CONTOURGLOBAL
H1 2019: Strong Growth in All Key Financial Metrics
                Revenue ($m)                                              Adjusted EBITDA ($m)

                                                                                                       $50m increase
                                                                                                          from CSP
                                                                                                      acquisition, $46m
                                                                                                       net farm down
                                          617                                                357     gains, -$24m from
       535                                                                                           FX and $10m from
                                                                       262                           positive renewable
                                                                                                          resource

      H1 2018                          H1 2019                        H1 2018              H1 2019

       Proportionate EBITDA ($m)                                                FFO ($m)

                                                                                            48% cash
                                                                                           Conversion1

                                                                                                         Increased cash
                                                                                                         conversion vs.
                                                                                                          42% in H1 18
                                          300                                                 170
       226                                                              111

      H1 2018                          H1 2019                        H1 2018              H1 2019

          (1) Cash conversion rate defined as FFO / Adjusted EBITDA                                                       4
H1 2019 RESULTS PRESENTATION - AUGUST 8, 2019 - CONTOURGLOBAL
H1 2019 Consolidated Results
                                                                 Key Highlights

✓ Good progress in regards to achieving target of doubling Adjusted EBITDA by 2022

✓ Declaring a second quarterly dividend for 2019 of $24.75 million corresponding to 3.6901 USD cents per share, which
    is expected to be paid on September 6, covered by strong cash flow and in line with our policy of growing the dividend
    by at least 10% per annum

✓ Mexico CHP¹ acquisition expected to close in the third quarter of 2019 and to generate $110 million of Adjusted
    EBITDA on a full year basis

✓ Sale of 49% of our 250 MW Concentrated Solar Power portfolio in Spain in May 2019 with €134m cash proceeds

✓ €100 million 4.125% senior secured notes due 2025 issued subsequent to the end of the half year at 106.0% of par
    corresponding to a yield to maturity of 3.024% to fund further growth

✓ Reflecting the timing of the closing of the Mexico CHP acquisition, we expect 2019 Adjusted EBITDA to be in the lower
    half of our previously communicated guidance of $720-770 million for the full year at constant foreign exchange rate2

                                          Ongoing Strong Growth and Cash Generation

                 (1) CHP – Combined Heat and Power
                 (2) 0.8851 for EUR/USD, and 3.914 for BRL/USD                                                               5
H1 2019 RESULTS PRESENTATION - AUGUST 8, 2019 - CONTOURGLOBAL
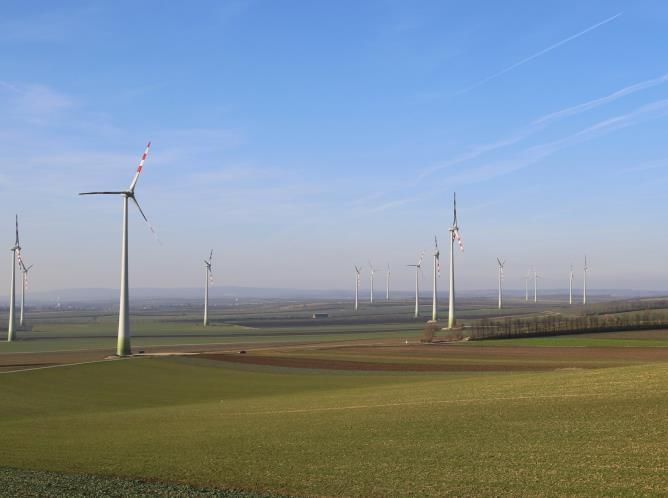
2. Operations
Karl Schnadt
Executive Vice President & Chief Operating Officer

KivuWatt – Methane Gas Extraction Facility & Power Plant (Rwanda)   6
H1 2019 RESULTS PRESENTATION - AUGUST 8, 2019 - CONTOURGLOBAL
Industry Leading Health & Safety Performance
Target Zero achieved in H1 2019

Leading the Sector in Health and Safety Performance
                                                                                                                                                                 0.90
   LTIR(1) - PEERS (2) (2018) VS CG                                                         LTIR
                                                                                                                                 (3)
                                                                                            Selected Peers Top Quartile = 0.20
                                                                                                                         (4)                          0.68
                                                                                            US Utilities Average = 0.6
                                                                                                                                               0.54
                                                                                                                                 0.49   0.50

                                                                                                      0.36    0.38        0.38
                                                                             0.27    0.27     0.30
                                             0.17   0.18       0.19   0.20
                              0.12   0.14
                       0.03
               0.00

‘Target Zero’ Remains ContourGlobal’s Key Priority
LTIR
2.5                                                                                                                                                          0.08
                      0.06
  2                                                                                                                                                          0.06

1.5                                                   0.03                                   0.03                                                            0.04

  1                    2                                                                                                                                     0.02
                                                                                                                                        0
0.5                                                        1                                   1                                                             0

  0                                                                                                                                                          -0.02
                      2016                            2017                                   2018                                 H1 2019
                                                                         # of LTIs            LTIR

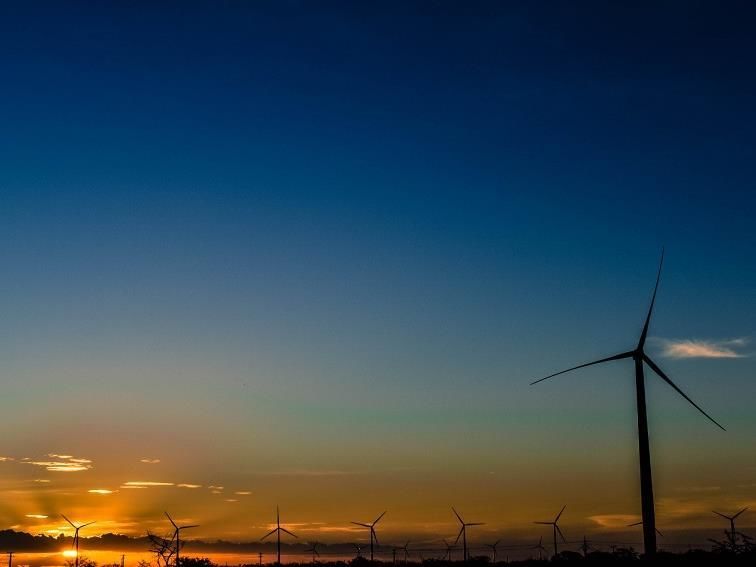
                                            Our 2019 TRIR(5) is 0.13 vs. a target of 0.14                                                                                                 Inka Wind Farm, Peru

(1) Lost time injury rate (LTIR) is an industry standard reporting convention for calculating injuries in the workplace. LTIR measures recordable lost time incident (LTI) rates on the basis of 200,000 working
hours (2) Source: peers information as 2018 reported in annual reports/sustainability reports published by companies normalized to basis of 200,000 working hours (3) Selection of comparable peers from
study performed by Black & Veatch (4) Based on the 2018 Bureau of Labor Statistics report (5) TRIR: total recordable incident rate is an industry standard reporting convention for calculating recordable
injuries in the workplace. TRIR is the total lost time injuries, restricted workday cases and medical treatments on the basis of 200,000 working hours

                                                                                                                                                                                                                   7
H1 2019 RESULTS PRESENTATION - AUGUST 8, 2019 - CONTOURGLOBAL
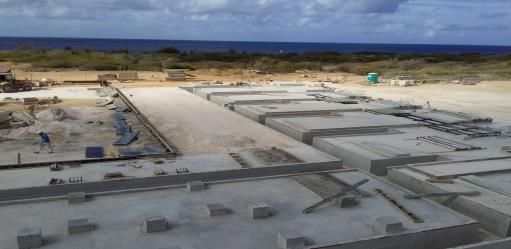
Divisional Operating Performance
Consistent Performance Across All Technologies

    Thermal – Equivalent Availability Factor1 (%)                                                                 Wind – Equivalent Availability Factor1 (%)

                                                                             74% weighted
     92.6%           90.2%                    93.3%                    93.2% average PPA                       92.7%                    95.8%                95.8%         96.1%
                                                                             minimum
                                                                             availability
                                                                             requirement
      2017            2018                   H1 2018                  H1 2019                                   2017                     2018               H1 2018       H1 2019
• Technical performance is in line with previous periods and well                                       • Ongoing improvement in Brazil Wind operations driving EAF
  above minimum PPA required threshold                                                                    improvements

       Hydro – Equivalent Availability Factor1 (%)                                                                  Solar – Equivalent Availability Factor1 (%)

     97.8%           98.5%                    98.5%                    98.2%                              99.2%                    99.2% 95.3%             99.7% 96.7%   98.3% 94.6%

      2017            2018                  H1 2018                  H1 2019                                    2017                     2018               H1 2018       H1 2019
                                                                                                                                           Solar PV        Solar CSP
• Excellent hydro availability; plants primarily rewarded on                                           • Decrease in H12019 availability due to blade failure in CSP and
  capacity or regulatory payments as opposed to individual plant                                         forced outages and maintenance at Solar Italy
  generation                                                                                           • Strong production performance at CSP despite lower H1 2019
                                                                                                         EAF
                   (1) Equivalent Availability factor refers to the actual amount of time a plant or group of plants is available to produce electricity                               8
H1 2019 RESULTS PRESENTATION - AUGUST 8, 2019 - CONTOURGLOBAL
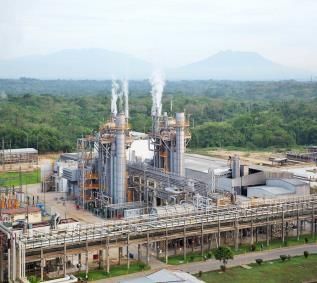
Renewable Fleet Capacity Factors
Most clusters at or above long-term expected levels
  Renewable fleet capacity factors (actual vs. long-term expected for H1)
                                                                                                                                                                                 (2%)

                                                                                                                                                                             55%
                                                                                                                                                                                   53%
                                                                         0%

                                                                    43% 43%
               (2%)
                                             3%

                                                                                                                                                             (1%)
          31%                                  31%
                  29%                  28%                                                                                          4%                    28% 27%
                                                                                                                                      24%
                                                                                                      0%
                                                                                                                              20%
                                                                                                 15% 15%

      Expected H1 2019            Expected H1 2019             Expected H1 2019             Expected H1 2019             Expected H1 2019              Expected H1 2019   Expected H1 2019
         Brazil Wind                 Austria Wind1                  Peru Wind                     Solar PV                   Spanish CSP                   Vorotan 2        Brazil Hydro 2

           Wind             Solar            Hydro               Expected and actual capacity factors are for H1 only. Seasonality of resource means
                                                                 majority of renewable generation occurs in H2

(1)    Long term expected capacity factors before repowering program completion
(2)    Hydro plants are less affected by generation; primarily rewarded on capacity or regulatory payments as opposed to individual plant generation

                                                                                                                                                                                             9
H1 2019 RESULTS PRESENTATION - AUGUST 8, 2019 - CONTOURGLOBAL
3. Financial Results
Stefan Schellinger
Executive Vice President & Chief Financial Officer

Asa Branca Wind Farm (Brazil)                        10
Robust Financial Performance
Significant growth in all key financial metrics

               Adjusted EBITDA1                                           Proportionate Adjusted EBITDA                            FFO1
                     ($m)                                                             ($m)                                         ($m)

             +24%3                           +36%                                    +25%3                   +33%          +26%3                +53%
                 650 2
                                                                                             2
                                                                                       576                                     2
                                                                                                                             330

                            706
                 610                                                                             610                               361
       513                                                                             536
                                                                                                                             302
                                                                             434                                     256
                                                  357
                                                                                                               300                                170
                                       262                                                             226
                                                                                                                                          111

      2017A 2018A LTM H1 H1                        H1                       2017A 2018A LTM H1 H1              H1    2017A 2018A LTM H1 H1        H1
                   2019 4 2018                    2019 4                                 2019 2018            2019                2019 2018      2019

(1)   Adjusted EBITDA and FFO are non-IFRS measures as defined in IPO Prospectus
(2)   Pro forma numbers: Adjusted to reflect full year contribution of Spanish CSP
(3)   Growth based on 2017 to LTM H1 2019 (CAGR)
(4)   EBITDA includes net gains from farm down transactions of $46m

                                                                                                                                                        11
Successful Integration of New Business Driving Growth

  ADJUSTED EBITDA – THERMAL DIVISION ($m)
                                                                                                                                                         1%
                                                                                                                                                       decrease
                                                                     9
                                                                                                          (11)

                                                        Increased availability and
                          163                                       163
                                                             higher dispatch                              161                                    161

               Adj. EBITDA H1 20181                      Availability and dispatch              FX Impact and Other                     Adj. EBITDA H1 20191

  ADJUSTED EBITDA – RENEWABLE DIVISION ($m)
                                                                                                                                                         78%
                                                                                                                                                       increase
               Austria Wind: +$4m / Solar assets: +$3m /
                     Hydros: +$1m / Others: +$2m
                                                                                                                    46                (16)

                                                          10                  3                52                             BRL and EUR
                                                                                                                              depreciation
                                      (1)                                                                                              214             214
                                                                                                                    184
             120                     119                 119                 129     +$50m CSP 131
                                                                                       Spain

     Adj. EBITDA H1             Availability           Resource          Other Organic     Acquisitions          Farm downs      FX Impact and    Adj. EBITDA H1
          2018 1                                                                                                                     Other             20191
(1) Spanish CSP Acquisition closed on May 10th, 2018

                                                                                                                                                                   12
Significant Cash Conversion Achieved in H1 2019

H1 2019 ADJUSTED EBITDA TO FFO1
                                                                                                                                                          48% cash conversion³
                                                                                                                                                            (42% in H1 2018)
           357.2

                                   (100.8)                    (8.1)
                                                                                      (19.7)                                      1.5
                                                                                                               (14.3)
                                                                                                                                                                   169.8
                                                                                                                                                 (46.0)

    Adjusted EBITDA             Interest paid          Income tax paid            Maintenance           Cash distribution JV and Associates Net gain on farm     Funds from
                                                                                     capex                 minorities                            downs(2)        Operations
(1) Funds From Operations is defined as Cash Flow from Operating Activities excluding changes in working capital, less interest
    paid, less maintenance capital expenditure, less distribution to minorities. Funds from Operations is a non-IFRS measure.
(2) Includes net cash gain on sale of minority interests in CSP and Solar Italy and Slovakia
(3) Cash conversion rate defined as FFO / Adjusted EBITDA

                                                                                                                                                                              13
Ample Cash Resources to Support Future Growth
and Dividend
Improvement in Net debt / EBITDA metric – at the lower range of 4.0x-4.5x guidance

Jun-19 liquidity – ($m)                                              Jun-19 net debt – ($m)                                      Net Debt/EBITDA (x)
                                      52              796                                  857
                      445
                                                                           2,744                                      2,857
                                                                                                        (744)

      299
                                                                                                                                                4.4x
                                                                                                                                      4.1x                      4.0x

                                                                                                                                                       (3)
 Asset Level HoldCo Revolving                       Total                 Project Corporate              Cash       Net Debt         2017A     2018A         LTM H1 2019
    Cash(1) Level Cash(2) Credit                  Liquidity                Debt     Debt                             Jun-19
                          Facility                 Jun-19                                                             (IFRS)

• $2.9bn Net Debt as of June 30, 2019
• Committed to high value growth while maintaining strong BB credit metrics
• Improvement in Net Debt / EBITDA metric to 4.0x
• $497m liquidity at parent level, including $445m of cash and $52m undrawn capacity under corporate level revolver

(1) Restricted cash at the operating assets’ level
(2) Unrestricted cash at the HoldCo level
(3) Includes full year earnings of Spanish CSP, which was acquired in May 2018 (+$40m of Adjusted EBITDA based on FY Earnings)

                                                                                                                                                                           14
ContourGlobal’s strong and predictable cash flow
supports our commitment to dividend growth of 10% p.a.

Dividend – ($m)

                              $0.1342                                               $0.1476
                             per share                                             per share

                                90                                                    99

                               2018A                                                 2019E

• 2018 dividend of $0.1342 per share or $90m
• 2019 guidance of $0.1476 per share or $99m
• ContourGlobal declare a second quarterly dividend for 2019 of $24.75m corresponding to 3.6901 USD cents per share to be
 paid on September 6, 2019

                                         Dividend policy of 10% annual Growth

                                                                                                                       15
4. Growth
Joseph C. Brandt
President & Chief Executive Officer

Sao Domingos II Hydro Power Plant (Brazil)   16
Mexican Cogeneration Business
Acquisition Signed in Jan 2019; closing expected in Q3 2019

               Transaction Highlights and Update                    Geographic Footprint
• Acquisition of natural-gas fired combined heat & power assets               CGA         Altamira, Tamaulipas

 with 518MW of operational capacity at completion, potential
 for a further 414MW in development

• More than 90% contracted revenues including heat and steam
 with seller

• Integration of Mexico CHP¹ is progressing as planned with all
 key integration workstreams on track

• Commissioning of 414 MW CGA 1 plant progressing with COD²
 and closing expected in Q3 2019

• $590m project financing underwritten by Scotiabank to be
 syndicated in Q3 2019 with syndication progressing well

• Estimated Adj. EBITDA of $110m in first full year of operations
                                                                    CELCSA   Cosoleacaque, Veracruz

                 (1) CHP – Combined Heat and Power                                                               17
                 (2) Commercial Operations Date
Kosovo
General Electric Selected as EPC Preferred Bidder; Resignation of Prime Minister
Creates Potential Delay
 Key Areas of Progress in 2018-19
Latest development                                              Major Milestones So Far
• Resignation of Prime Minister and potential change of
  government creates timing uncertainty                          Project Agreements Effective Date                 May-2018

State-of-the-art coal plant
                                                                 Receipt of EPC Technical Proposals                Dec-2018
• State-of-the-art coal plant with Best Available technology

• The new plant will replace Kosovo’s current plant, the most    EPC Selection Announcement                        May-2019
  polluting plant in Europe emitting 9 times more damaging
  particulate matter than the average of coal plants in the
  Balkans.                                                       Signing of EPC contract                           Q3 2019

• It’s expected to significantly decrease all emissions,
  including CO2 , resulting in significantly improved            Financing
  environmental and health outcomes                              • Financing consists of a mix of Development Finance
                                                                   Institutions (“DFI”) and Export Credit Agencies (“ECA”)
EPC Contract
                                                                 • ECA is driven by EPC bidder selection. ContourGlobal
• General Electric selected as EPC preferred bidder in May
                                                                   engaged with multiple parties
  2019

• Awarded after a highly competitive procurement process for
  turn key contract

                                                                                                                              18
Renewable Updates
Further Growth with both Strategic Projects and M&A. Successful Refinancing at
Solar Assets
Installed Capacity(1) : 1,820 MW                                                       Adjusted EBITDA H1 2019: $214m
                                                      • Acquisition of a 12.4MW add-on Solar Italy asset completed in June 20 – rooftop PV solar
 Solar Europe                                           portfolio with average remaining FiT² period of 13 years, located close to existing Northern
   Growth                                               Italy hub
                                                      • Strong Solar Europe pipeline identified for future growth
                                                      • Electro-mechanical refurbishment and modernization program started in 2017 to improve
                                                        operational performance, safety, reliability and efficiency of Vorotan. Initial phase has been
                                                        completed and the project is on track with completion expected in 2020, ahead of original
                                                        schedule and on budget
   Vorotan                                            • Total $71.5m investments: electrical part funded by a €51m loan with a Development
Refurbishment                                           Finance Institution and additional civil works at $13.5m are funded by company’s operating
                                                        cash flow
                                                      • Civil works to be entitled to a reimbursement and a regulated unlevered return through an
                                                        adjustment to the tariff
                                                      • Expected Results: Vorotan EBITDA increases by approx. $7m from 2019 to 2021

                                                      • Phase 1 (30 MW): Repowering of Velm (13 MW) reached COD on 31st Jan 2019 on time
 Austria Wind
                                                        and below budgeted cost, with FiT secured for 13 years;
 Repowering
                                                      • Scharndorf (17 MW) to complete in H2 2019 / H1 2020 , with FiT secured for 13 years

                                                      • Refinancing of Italian and Slovakian solar businesses in two separate financings
                                                         • €196m refinancing in Solar Italy – increased tenor by 2.7 years from 8.9 years to 11.6
 Solar Italy and                                           years and reduced interest costs by 1.49% p.a. (incl. breakage costs) from 4.14% to
 Solar Slovakia                                            2.65%
  Refinancing                                            • €51m refinancing in Slovakia – increased tenor by 1.4 years from 5.4 years to 6.8 years
                                                           and reduced interest costs by 1.95% p.a. (incl. breakage costs) from 4.48% to 2.53%
                                                      • €4m interest savings on an annualized basis³
                   (1) As of June 2019, including Solar Italy Interporto acquisition
                   (2) Feed in tariff                                                                                                                  19
                   (3) Assuming consistent amount of debt
Thermal Updates
Continuation of established projects across geographies: Battery Upgrade Project
implemented in Bonaire, serving as Pilot Project for future growth
Installed Capacity(1) : 3,027 MW                                                           Adjusted EBITDA H1 2019: $161m

                                                                           • With the acquisition of Bonaire in 2013, the company moved into a new
                                                                             hybrid technology and gained further expertise in battery storage without
                                                                             assuming construction risk
                                                                           • In 2018 we commenced an innovative battery replacement and hybrid
                                                                             expansion project, which will enable us to integrate more wind energy into
                                                                             the system and further reduce costs to the island customers

Bonaire Hybrid                                                             • Project status:
 Concept, a 24                                                                        • Phase 01: Successfully implemented 6 MW/MWh Battery upgrade
MW integrated                                                                           project in Q1 2019. 7.7 GWh production increase
 Wind, Diesel
                                                                                      • Phase 02: Replace rented engines and ensure security of supply and
  and Battery                                                                           grid stability COD in Nov 2019
  Power Plant
                                                                                      • Phase 03: 10 MW PV plant, 7-10 MW wind park expansion and
                                                                                        additional battery capacity
                                                                           • Expected Results: Upon completion, the project will increase the energy
                                                                             production in line with growing energy demand on the island, achieve further
                                                                             energy tariff reductions and increase the renewable mix on the island.
                                                                             Moreover, ContourGlobal will become the sole power producer on the
                                                                             island.

 TermoemCali
                                                                            • $80m refinancing: $45m long term and $35m working capital facility
   Reliability
                                                                              completed following Reliability Charge2 (the primary source of EBITDA for
     charge
                                                                              this peaker CCGT plant) assignment extension until November 2023.
  assignment
                                                                            • Optimizes capital structure and demonstrates long-term positive outlook for
 extension and
                                                                              the asset post current regulatory period
  refinancing

                 (1) As of June 2019, including Mexico CHP and Cogeneration Assets                                                                          20
                 (2) Reliability charge is a regulated fixed monthly fee to incentivize base load plants to be available
Appendix

Sao Domingos II Hydro Power Plant (Brazil)   21
Maintaining a Diversified Footprint Across Geographies and
 Technologies

         LTM H1 2019 PF EBITDA by                                              LTM H1 2019 PF EBITDA by                                               LTM H1 2019 PF EBITDA by
               Technology1                                                           Geography1                                                              Currency1

Renewable                                          Thermal                                                                                                                2%
   45%                                               38%
                          8%
                                         17%                                                                                                                    13%

                                                                                 36%
          23%
                                                    15%
                                                                                                                         53%                                                                   54%
                                                                                                                                                      31%

                                                 6%
               14%
                                                                                         11%
                                  17%

                                        HE Cogen
                                          17%
                                                                                 Europe          Africa       Latin America                                 EUR       USD        BRL       Other
       Coal                               Natural Gas
       Fuel oil                           High Efficiency Cogen
       Wind                               Solar
       Hydro

 (1)   PF for full year EBITDA of Mexican CHP acquisition signed in January 2019 ($110m) and Solar InterPorto acquisition completed in June 2019 ($6m). Split excludes Thermal and Renewable HoldCo expenses
       and gain on CSP and Solar Italy and Slovakia farm downs

                                                                                                                                                                                                         22
Adj. EBITDA to Adj. Net Income1 Bridge

Adj. EBITDA to IFRS net income bridge (US$m)                         H1 2019        H1 2018
                                                                                                   1 +$95m: Growth driven mainly by the CSP acquisition (full
Adjusted EBITDA                                                         357.2         261.8    1
                                                                                                     6 months), CSP farm down and higher resource partially
Share of adjusted EBITDA in associates                                  (10.1)        (12.0)
                                                                                                     offset by negative FX impact due to weaker EUR and
Share of profit in associates                                                 8.3       2.8
                                                                                                     earn-out payments to make to Credit Suisse related to
Acquisition related items                                                (5.3)        (12.3)   2     Italy farm down (non cash in H1 2019)
Costs related to CG Plc IPO                                                     -      (0.8)
Cash gain on sale of minority interest                                  (46.1)             -   3
Restructuring costs                                                      (0.1)             -
                                                                                                   2 +$7m: In H1/2018, related essentially to all CSP
Private incentive plan                                                   (4.7)             -
                                                                                                     acquisition costs (M&A closed). In H1/2019, related
Other (1)                                                               (16.7)        (19.2)
EBITDA                                                                  282.5         220.3
                                                                                                     essentially to Mexico CHP (M&A not yet closed)
Depreciation & Amortization                                            (131.5)      (106.4)    4
Finance costs net                                                      (127.7)      (107.0)    5   3 +$46m: CSP farm down net profit ($52m) partially offset
Income tax                                                              (17.2)         (4.2)         by net amount of earn-outs on farm down of Italy and
Net Income                                                                    6.0       2.7          Slovakia ($6m)
Bond refinancing one-off cost                                                   -          -
CG Plc IPO costs                                                                -       0.8
Acquisition related items                                                     5.3      12.3        4 +$25m: Largely driven by CSP acquisition (full 6 months)
Italian / Slovakian refinancing                                           15.4             -   5
Restructuring costs                                                           0.1          -
Private incentive plan (non cash, non PLC cost)                               4.7          -       5 +$21m: Increase in finance costs largely driven by (i) the
Adj. Net Income                                                           31.5         15.8          Slovakian and Italian refinancings which required early
                                                                                                     settlement of the existing swaps ($11m) and immediate
Minorities                                                               (8.1)         (1.0)         recycling to P&L of deferred financing costs ($4.2m, non-
Net Income attributable to Group                                          14.1          3.7          cash), and (ii) full six month impact of Spain CSP
                                                                                                     interests, partially offset by lower interests on the
                                                                                                     corporate bond following July 2018 refinancing.

                                (1)   Net income adjusted for one-off items
                                                                                                                                                                  23
Financial Highlights
Key financial metrics

                                       Six months ended June 30   Var    Var %
In US$ millions                        2018               2019
Revenue                                535                 617    82     15.3%
Gross profit                           144                 171    27     19.1%
SG&A                                   (22)                (20)    2     (10.5%)
Adjusted EBITDA                        262                 357    95     36.4%
Proportionate EBITDA                   226                 300    74     32.6%
Operating profit                       112                 143    31     27.4%
Net finance cost                       (107)              (128)   (21)   19.4%
Income tax expense                      (4)                (17)   (13)   309.5%
Net profit / (loss) after income tax    3                   6      3     122.2%
Basic earnings per share (pence)       0.01                0.02   0.01   110.4%
FFO                                    111                 170    59     53.2%

                                                                                   24
Contributors to Adj. EBITDA

Top Contributors to Adj. EBITDA1                                                                  2016   2017   2018   H1 2019

Top contributors from Thermal fleet
Maritsa East III                                                                                  117    125    120      62
Arrubal                                                                                           62     61     63       31
KivuWatt                                                                                          22     24     26       12
Cap des Biches                                                                                    12     26     27       14
Togo                                                                                              21     25     25       13
                2
CG Solutions                                                                                      12     27     27       10
Caribbean                                                                                         21     27     24       12
Colombia                                                                                          21     22     21       10
Others                                                                                            (0)     2      1       (0)
Top contributors from Renewable fleet
Spanish CSP                                                                                        -      -     89       67
Brazil Wind                                                                                       79     82     59       21
                            3
Solar Europe, excl. CSP                                                                           31     31     41       23
Brazil Hydro                                                                                       9     28     41       22
Peru Wind                                                                                         31     25     29       15
Austria Wind                                                                                      23     25     20       14
Vorotan                                                                                           22     23     23       12
Others                                                                                             -      -      -       (0)
Total                                                                                             485    553    638     339

(1)   EBITDA is calculated by asset excluding corporate costs and thermal and renewable holdcos
(2)   Includes Solutions Europe and Africa and Solutions Brazil
(3)   Includes Solar Italy, Solar Slovakia, Solar Romania and Biogas Italy

                                                                                                                                 25
Contributors to CFADS1

Contributors to CFADS
                                                                                               2016   2017   20184   LTM H1 20194
(Before Corporate and Other Costs)1

Spanish CSP                                                                                     -      -      35         75
                           2
Solar Europe excl. CSP                                                                         22     55      38         61
Maritsa                                                                                        118    30      65         34
Arrubal                                                                                        19     28      18         29
Brazil Hydros                                                                                  (1)    55      14         23
                3
CG Solutions                                                                                   28     41      15         15
Cap des Biches                                                                                  -      7      17         12
Peru Wind                                                                                      23      5      15         12
Colombia                                                                                        4 4    8      4          12
KivuWatt                                                                                        -      -      4           8
Vorotan                                                                                        111    13      9           5
Austria Wind                                                                                    7      8      4           5
Togo                                                                                            6      6      7           5
Caribbean                                                                                      10      9      5           4
Brazil Wind                                                                                     2      5      (0)        (2)
Total                                                                                          349    270    249         298

(1)   CFADS (Cash Flows Available for (Corporate) Debt Service) as defined in Bond Indenture
(2)   Includes Solar Italy, Solar Slovakia and Solar Romania
(3)   Includes Solutions Europe and Africa and Solutions Brazil
(4)   2018 and LTM H12019 not including thermal and renewable holding costs

                                                                                                                                    26
Continued Strong Bond Credit Metrics
   7.4x DSCR & 3.6x Non-Guarantor Combined Leverage Ratio as of June 2019

                                    Leverage Ratio1                                                                                                      DSCR1

    In $m or multiple
4,000                                                                                      5.5x                 In $m or multiple
                                                                                5x                                         9.2x
                                                                                                   500                                                                                           9.5x
3,500
                                                                                           4.5x 450                                                                                              8.5x
                                                         3.9x       3.8x                                                                                                               7.4x
3,000                                        3.6x                              3.6x                400                                                           6.8x                            7.5x
           3.5x                   3.5x
                      3.3x                                                                                     6.3x
                                                      2,399                                3.5x 350                                                                             6.1x             6.5x
2,500                                                                                                                     301              5.7x     5.6x
                                                                 2,222                                                                                         291
                                                                             2,029                 300                                                                                           5.5x
2,000                                                                                      2.5x                                                                                        251
                                           1,712                                                   250                                 237         232                                           4.5x
                               1,587                                                                                                                                        203
                                                                                                              202
1,500                                                                                              200                                                                                           3.5x
         1,196      1,132                                                                  1.5x
1,000                                                                                              150                                                                                        2x 2.5x
                                                           614        580        567
                                    456        476                                         0.5x 100                                                                                              1.5x
 500         345        341                                                                                                                41          41           43
                                                                                                    50            32          33                                                  34     34      0.5x
    -                                                                                      (0.5x)       -                                                                                        (0.5x)
          Jun-16 Dec-16 Jun-17 Dec-17 Jun-18 Dec-18 Jun-19                                                   Jun-16 Dec-16 Jun-17 Dec-17 Jun-18 Dec-18 Jun-19
             NGPTI                                     Prop. Adj. EBITDA (LTM)                                         CFADS (LTM)                              Annualized Debt Service
             Leverage Ratio                            Incurrence Level (5x max)                                       DSCR                                     Incurrence Level (2x min)

   (1) DSCR and Leverage Ratio (Non-guarantor combined leverage ratio) as defined in Bond Indenture.
   Please see slide 31 for calculation of Bond Indenture Leverage Ratio, including Proportionate Adjusted EBITDA and NGPTI (Non-Guarantor Proportionate Total Indebtedness) .

                                                                                                                                                                                                        27
Reconciliation of Bond Metrics to IFRS Financials

 Bond metrics definitions use Proportionate Adjusted EBITDA (“PAE”) and Non-Guarantor Proportionate Total Indebtedness
 (“NGPTI”) to calculate leverage ratios. These definitions exclude Corporate Level Financings and Project Finance Subsidiaries
 (“PFS”) (projects not yet reached, or recently passed, COD). As of December 31, 2018, no project is treated as a PFS.

Calculation of PAE ($m)                     Dec-18     LTM Jun -19      Calculation of NGPTI ($m)                  Dec-18          Jun-19
Income From Operations                         262             293      Non-current Borrowings                      3,287           3,342
Depreciation & Amortization                    239             264      Current Borrowings                            273            260
Share in JVs                                    21              19      Consolidated Gross Debt                     3,560           3,601
Other                                           88             129      Accrued Int & IFRS Adj.                        53             41
Adjusted EBITDA                                610             706      Share in JVs                                    6             13
Pro Forma Acquisitions                          46              13      Project Finance Subsidiaries (PFS)              -               -
Project Finance Subsidiaries (PFS)               -               -      Peru Wind Letter of Credit                      9              9
HoldCos & Other                                 20              21      DSRA                                        (185)           (117)
Pro Rata Adjustment                           (97)           (173)      Corporate Bond                              (860)           (853)
PAE                                            580             567      Pro Rata Calculation                        (361)           (665)
                                                                        NGPTI                                       2,222           2,029
PAE (Proportionate Adjusted EBITDA)                                     NGPTI (Non-Guarantor Proportionate Total Indebtedness)
• Includes our share in JVs (Sochagota & TermoemCali)                   • Excludes debt at parent company level (corporate bond)
• Pro forma for acquisitions mainly relates to our acquisition of the   • Increase in gross debt and NGPTI relating to our acquisition of
  Spanish CSP portfolio                                                   the Spanish CSP portfolio

                                                                                                                                       28
ContourGlobal Portfolio

                                                                     Gross Cap. Number of                                   ContourGlobal
      Segment       Facility / Project Name          Location          (MW)      Assets                Fuel Type1            Ownership             COD              Power Purchaser             PPA Expiration
                 Maritsa                       Bulgaria                 908        1          Coal                               73%               1978      NEK                                    2024
                 Arrubal                       Spain                    800        1          Natural Gas                       100%               2005      Gas Natural Fenosa                     2021
                 TermoemCali                   Colombia                 240        1          Natural Gas / Diesel               37%               1999      Various                                 N/A
                 Sochagota                     Colombia                 165        1          Coal                               49%               1999      Gensa                                  20192
                 Togo                          Togo                     100        1          Natural Gas / HFO / Diesel         80%               2010      CEET                                   2035
                 Cap des Biches                Senegal                   86        1          Oil /Natural Gas                  100%             Q2 2016 /   Senelec                                2036
                                                                                                                                                 Q4 2016
                 Energies Antilles / Energies French Caribbean           35            2      HFO / LFO                          100%           2000; 2003   EDF                                  2020; 2023
                 St Martin
                 Bonaire                      Dutch Antilles              28          1       HFO / Wind                         100%             2010       WEB                                     2025
                 KivuWatt                     Rwanda                      26          1       Natural Gas                        100%            Q4 2015     EWSA (ex-Electrogaz & REC)         2040 (expected)
 Total Thermal                                                          2,388         10
                 Mexican CHP assets(5)         Mexico                    518          2       Natural Gas cogeneration         100%              2014/19     Mexican industrial/commercial           N/A
                 ContourGlobal Solutions       Europe – Nigeria –        132          11      Natural Gas / Diesel / LFO   100%;100%; 80%       1995-2015    Investment grade global              2018-2032
                                               Brazil                                                                                                        industrial companies
 Total Cogen                                                             650          13
                 Chapada Complex               Brazil                    438           3      Wind                         51%, 51%, 100% 2015; Q1 2016      CCEE; distribution companies           2035
                 Vorotan                       Armenia                   404           1      Hydro                             100%          1970           AEN                                    2040
                 CSP Portfolio                 Spain                     250           5      CSP                               100%          2010           CNMC                                 2034-2037
                 Hydro Brazil                  Brazil                    167           9      Hydro                             79%3       1963; 1992;       Distribution companies               2027-2042
                                                                                                                                            2009-2012
                Asa Branca                     Brazil                    160           1      Wind                              100%          2013           Distribution companies                 2033
                Austria Wind                   Austria                   155           10     Wind                               94%        2003-2014        OeMAG                                2016-2027
                Inka                           Peru                      114           2      Wind                              100%          2014           Distribution companies                 2034
                Solar Italy4                   Italy                      77           48     Solar                              51%        2007-2013        Gestore Servizi Energetici S.p.A     2027-2033
                Solar Slovakia                 Slovakia                   35           3      Solar                              51%        2010-2011        Distribution companies               2025-2026
                Solar Romania                  Romania                     7           1      Solar                             100%          2013           Distribution companies                 2028
                Biogas Italy                   Italy                       2           2      Biogas                            100%          2013           Gestore Servizi Energetici S.p.A       2028
Total Renewable                                                         1,809          85
Total portfolio                                                         4,847         108

(1)    HFO refers to heavy fuel oil, and LFO to light fuel oil.
(2)    CES has already signed 4 contracts to replace existing PPA, extending expiration to 2024, with an additional 5 year extension expected
(3)    Capacity weighted                                                                                                                                                        Thermal          Renewables
(4)    Italian solar assets in 20 clusters. Includes InterPorto acquisition, which was completed in June 2019
(5)    Signed but not closed

                                                                                                                                                                                                               29
IR Information
Next Event & Contact Point

Next IR Events
                                                                IR Contact
                                                                Alice Heathcote
     Date                    Event             Location         SVP, CFO Renewables
                                              Dial-in details   Email:
  8th   August         H1 2019 Results Call    available on     alice.heathcote@contourglobal.com
                                                 website
                                                                or
                      Goldman Sachs EMEA                        investor.relations@contourglobal.com
  3 – 4th Sept                                   London
                       Leveraged Finance

                      JP Morgan European
  5–    6th   Sept     High Yield and Lev        London
                            Finance
                                                                Web Resources
                                                                Corporate Website
                      Morgan Stanley Power
 12 –   13th   Sept                              London         www.contourglobal.com
                       and Utility Summit

                                                                Investor Relations
                                                                www.contourglobal.com/investors

                                                                                                       30
For further information please visit www.contourglobal.com
You can also read