FY20 Results Presentation - 24 August 2020 RELIANCE WORLDWIDE CORPORATION LIMITED
←
→
Page content transcription
If your browser does not render page correctly, please read the page content below

FY20 Results
Presentation
24 August 2020

RELIANCE WORLDWIDE CORPORATION LIMITED
ABN 46 610 855 877

Important Notice
This presentation contains general information about Reliance Worldwide Corporation Limited’s activities at the date of presentation (24
August 2020). It is information given in summary form and does not purport to be complete.

The presentation is not an offer or invitation for subscription or purchase of or a recommendation of securities in any jurisdiction. It is not
intended to be relied upon as advice to investors or potential investors and does not take into account the investment objectives, financial
situation or needs of any particular investor. These should be considered, with or without professional advice, when deciding if an
investment is appropriate.

Information, including forecast or forward looking information, in this presentation should not be considered as a recommendation in relation
to holding, purchasing or selling shares, securities or other instruments in Reliance Worldwide Corporation Limited. Due care and attention
has been used in the preparation of forecast and forward looking information. However, actual results may vary from forecasts and any
variation may be materially positive or negative. Forecasts by their very nature are subject to uncertainty and contingencies many of which
are outside the control of Reliance Worldwide Corporation Limited and Reliance Worldwide Corporation Limited cautions against reliance on
any forward looking statements or forecasts, particularly in light of the current economic climate and the significant volatility, uncertainty and
disruption caused by Covid-19. Past performance is not a reliable indication of future performance. Except as required by applicable
regulations or laws, Reliance Worldwide Corporation Limited does not undertake any obligation to publicly update or review any forward
looking statements whether as a result of new information or future events.

This presentation contains references to the following non-IFRS measures: EBITDA, Adjusted EBITDA, Adjusted EBIT, Adjusted NPAT and
Adjusted EPS. These measures are used by RWC to assess operating performance and are defined in the accompanying Results
Announcement dated 24 August 2020. These measures have not been subject to audit or review.

The sum totals throughout this presentation may not add exactly due to rounding differences.

The information in this presentation remains subject to change without notice. Circumstances may change and the contents of this
presentation may become outdated as a result.

This presentation forms part of a package of information about Reliance Worldwide Corporation Limited. It should be read in conjunction
                                                                                                                                                     2
with the Appendix 4E, 30 June 2020 Financial Report and the Results Announcement also released on 24 August 2020.
Agenda
1. FY20 Results Overview         04
2. Covid-19 Response             08
3. Group Financial Performance   12
4. Strategy and Outlook          24

                                      3
FY20 Results Overview

                        4
Key business highlights
Results reflect resilience of US and Australian markets and strong operational
performance
Strong performance by the Americas segment: outstanding operational execution enabled us to meet
surge in demand in US retail and hardware channels
Australian market generally performed in line with expectations with minimal Covid-19 impacts
UK and European revenues heavily impacted by Covid-19, mitigating actions taken in response
John Guest: successful integration completed and synergies achieved
Operating margins adversely impacted in the second half by the decline in EMEA revenues
Focus on tight working capital management and cost control delivered strong cash performance in FY20
• Cash from operations of $278.3m up 56%; Operating cash flow conversion of 128%
Financial position strengthened, with net debt reduced by $124.4m and leverage ratio of 1.39 times
Cost reduction initiatives will deliver annual savings of $25m on a run rate basis from end of FY21
• Restructuring charges of $10.7m recognised in FY20 to enable cost reduction measures
Final dividend of 2.5 cents per share declared, total for the year of 7.0 cents
5
FY20 Financial Highlights

    Net sales                                                           Adjusted EBITDA 2                                         Adjusted NPAT 2

    $1,162                  million                                     $251.3                    million                         $130.3           million
    +5% growth overall1                                                 -9% on prior year                                         -18% on prior year

     Operating cash flow                                               Net debt reduction                                         Final dividend

     $278.3                    million                                 $124.4                    million                          2.5 cps
     +56%                                                              Net debt $302.2 million                                    Total FY2020 dividends: 7.0 cps
     Cash Conversion: 128%                                             Net leverage ratio3 at 1.39x                               Deferred interim dividend to be paid
                                                                                                                                  in October

1 Growth rates expressed as change over comparative period for the year ended 30 June 2020
2 EBITDA, Adjusted EBITDA, Adjusted NPAT and Adjusted EPS are non-IFRS measures used by RWC to assess operating performance and
defined in the Results Announcement dated 24 August 2020. These measures have not been subject to audit or review.
3 Net Debt/12-month trailing EBITDA
                                                                                                                                                                         6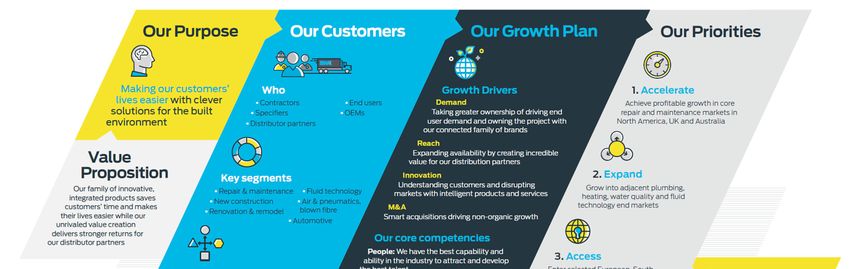
Strong operating cash flow performance
Cash generated has enabled reduction in net debt and payment of final dividend

       Cash Flow from
$m       Operations                            Net Debt/EBITDA             Total Dividends Declared ($m)
                          278.3      2.0                              80
                                                                                         71.1
                                     1.9                              70
250
                                     1.8
                                                                      60                         55.3
200                                  1.7              1.67
                 178.9
                                            1.57                      50
                                     1.6
                                                                                 42.1
150                                  1.5                              40
         124.8
                                                               1.39
                                     1.4
                                                                      30
100
                                     1.3
                                                                      20
                                     1.2
50
                                     1.1                              10

  0                                  1.0                               0
      FY2018     FY2019     FY2020         FY2018   FY2019   FY2020            FY2018   FY2019   FY2020

                                                                                                           7
Covid-19 Response

                    8
The story of the second half
While Covid-19 presented significant operational challenges we continued to
make progress on key initiatives
North America:
Surge in US Retail and Hardware channel sales added pressure on supply chain but high service levels maintained
New bay rollout in Retail channel successfully achieved
New product revenue growth achieved
Integration of HoldRite manufacturing plant in Tennessee with RWC main facility in Alabama achieved with only 3 month
delay, reduction of 21 positions
Restructuring in the US with reduction of 22 positions
EMEA:
New ERP successfully implemented in the UK
John Guest synergies target achieved – annual run rate at end of FY20 was $31.3m
Restructuring undertaken to leverage efficiencies from ERP implementation and in response to Covid-19
9
Responding to the Covid-19 Pandemic
Employee health and safety Health and safety of RWC employees has been our number one priority
On-site social distancing, daily temperature checks, provision of additional PPE
Cleaning protocols initiated to deal with any outbreak at all manufacturing/distribution locations
Incidences of Covid-19 experienced but dealt with expeditiously
Supporting employee well- Enhanced employee communications worldwide and within each region
being RWC wide employee survey undertaken to take the pulse of our people
Bonus or recognition gift card given to every employee
Operational impacts All major RWC manufacturing sites were operational throughout the period but with some disruption
Extra costs incurred with additional cleaning at sites and associated disruption
400+ employees in UK and Europe were placed on furlough for up to 3 months: now returned to work
Temporary reduction in May to 4 days per week in Australia, since back at 5 days
New Zealand operations suspended for one month
Changes to factory layouts and material flow to ensure social distancing requirements met
Integration of Alabama and Tennessee plants delayed by 3 months with some disruption to operations
Procurement/supply chain Outstanding performance by RWC supply chain team in managing sourcing and logistics issues
impacts Supplier constraints and logistical issues successfully overcome
10Responding to the Covid-19 Pandemic (cont’d)
Preserving cash Review of SG&A: limited discretionary expenditure
Capex: all non-essential capex halted, capex reduced by approx. $17m for FY20
Working capital management: a key area of focus, particularly inventory levels and receivables
collection
Payment of interim dividend postponed from April until October
Customer service Maintained a high level of customer service in the US
impacts DIFOT1 of c.98% with core product in retail despite surge in sales and logistical challenges
Disruption in UK plant operations adversely impacted delivery timeframes
Australia sites temporary move to 4 days / week operation – no significant impact on service levels
Support from Furloughed UK employees accessed salary support being offered by the UK Government under the
Government Coronavirus Job Retention Scheme
Support provided from various European governments
NZ Government salary subsidy for duration of operational shut down
Other Directors and senior executives: 20% reduction in fees/salaries for May and June
UK engineering and manufacturing expertise worked on specific medical applications for ventilators
11
1 DIFOT: Percentage of orders Delivered In Full On TimeGroup Financial
Performance
12Summary of FY20 Performance
A$m FY19 FY20 % Net sales up 5% driven by strong 2nd half Americas
Change sales growth partly offset by lower sales in EMEA due
to Covid-19
Net Sales 1,104.0 1,162.4 5%
A$/US$ weakness during the 2nd half positively
Reported EBITDA 242.5 217.9 -10% impacted reported Americas sales performance
Reported earnings impacted by restructuring and
EBITDA Margin 22.0% 18.7% -330bps
impairment charges:
Adjusted EBITDA 277.0 251.3 -9% • EBITDA by $33.4m
Adjusted EBITDA Margin 25.1% 21.6% -350bps • NPAT by $25.7m
Reported NPAT 133.0 89.4 -33%
Adjusted EBITDA down 9% due mainly to 2nd half fall in
EMEA sales and operating margin
Adjusted NPAT 158.3 130.3 -18% Adjusted NPAT of $130.3m for the year, down 18% with
a resilient 2nd half despite Covid-19 impacts
Earnings per share (cps) 17.0 11.4 -33%
Total dividends declared for the year of 7.0 cps
Adjusted earnings per share (cps) 20.2 16.6 -18% represents a 42% pay-out of Adjusted NPAT
Cash flow from operations 178.9 278.3 56% Cash flow from operations up 56% driven by focus on
working capital management
13FY20 Group EBITDA margin drivers
Results significantly impacted by Covid-19 Volume / Mix: sales performance varies by region
reflecting the differing market responses to the
pandemic
• EMEA: Sales in our highest margin business
impacted by Covid-19 in the second half
• Americas: Surge in US Retail and Hardware channel
sales only partially offset the decline in EMEA
• Unfavourable product sales mix
Production volumes: reduction in manufacturing
overhead recoveries in the first half due to lower
manufacturing volumes in Americas and APAC, and
EMEA in the second half
Synergies / Cost Savings: additional John Guest
related synergies achieved of $13.8 million and
continuous improvement initiatives of $5.5 million
Channel Initiatives & Support: stop valve bay rollout
and other customer / product specific initiatives
SG&A spending: investment in core capabilities,
increased research & development spend, supply chain
costs, wage inflation and other
14Segment results: Americas
Resilience of the US market and repair and remodel sector demonstrated
US$m FY19 FY20 % US$m 1H20 % over pcp 2H20 % over pcp
Net Sales 467.8 495.8 6% Net Sales 237.4 1% 258.4 11%
EBITDA 79.1 64.9 -18% EBITDA 36.7 -8% 28.2 -16%
Adjustments 2.0 14.4 n/m Adjustments - n/m 14.4 n/m
Adjusted EBITDA 81.1 79.3 -2% Adjusted EBITDA 36.7 -15% 42.6 13%
Adjusted EBITDA margin 17.3% 16.0% (130) bps Adjusted EBITDA margin 15.5% (300) bps 16.5% 30 bps
Commentary on 2nd Half Performance
Americas Monthly Revenues US$m
50
Demand for RWC product strong in the US through the Covid-19
pandemic: March and June were record sales months
40
Retail and hardware channels particularly strong, shelter-in-place
30 restrictions impacted many wholesalers and professional end-users
20 Successful roll out of new product range at retail channel partner
10 Lower manufacturing overhead recoveries in the first half and
investment in capabilities reduced margins for the year versus pcp
0
Jan Feb Mar Apr May Jun Jul Second half margins improved 100 bps over first half driven by
FY19 FY20 FY21 higher volumes and tighter cost control 15Americas: 11% second half revenue growth Covid-19 impact estimated to be 3.4% of Americas second half sales growth Figures are in US$ Market growth – source: LIRA 16
Segment results: Asia Pacific
Sales performance reflects success of new products introduced in Australian market
A$m FY19 FY20 % Change A$m 1H20 % over pcp 2H20 % over pcp
Net Sales 249.1 244.8 -2% Net Sales 125.4 -3% 119.4 0.1%
EBITDA 48.1 44.3 -8% EBITDA 22.8 -7% 21.4 -9%
Adjustments 5.5 - n/m Adjustments - n/m - n/m
Adjusted EBITDA 53.6 44.2 -18% Adjusted EBITDA 22.8 -17% 21.4 -18%
Adjusted EBITDA margin 21.5% 18.1% (340) bps Adjusted EBITDA margin 18.2% (310) bps 17.9% (390) bps
APAC Monthly Revenues A$m New housing commencements in Australia declined 17.9% in the
25 year to 31 March 2020, negatively impacting volumes
20 External sales up 2% for the year reflecting the success of new
products
15
Lower inter-segment volumes resulting in reduced manufacturing
10 overhead recoveries and earned margins
5 Increased temporary ERP and supply chain costs impacted
0 margins, costs will not recur in FY21
Jan Feb Mar Apr May Jun Jul
FY19 FY20 FY21
17Segment results: EMEA
Significant impact from Covid-19 restrictions and curtailed distribution
GBPm FY19 FY20 % GBPm 1H20 % over pcp 2H20 % over pcp
Net Sales 199.5 172.7 -13% Net Sales 94.4 -2% 78.3 -24%
EBITDA 54.0 43.2 -20% EBITDA 28.4 17% 14.8 -48%
Adjustments 7.5 6.3 n/m Adjustments - n/m 6.3 n/m
Adjusted EBITDA 61.5 49.5 -20% Adjusted EBITDA 28.4 3% 21.1 -38%
Adjusted EBITDA margin 30.8% 28.7% (210) bps Adjusted EBITDA margin 30.1 140 bps 26.9% (590) bps
UK Govt restrictions severely limited distribution and plumber
EMEA Monthly Revenues GBPm activity - demand fell to 35-40% of pre-Covid19 levels
20
Covid-19 In Europe, government actions and commercial slowdown across
Impact all markets reduced demand by around half
15
Second half sales in constant currency were 24% lower
10 EMEA remained EBITDA positive every month despite significant
decline in sales, but operating margins negatively impacted
5
Manufactured volumes picked up in response to increased
demand late in the half
0
Jan Feb Mar Apr May Jun Jul July volumes show gradual improvement with margins above
pre-COVID levels
FY19 FY20 FY21 18John Guest Look-back
Business quality and successful integration with RWC demonstrated despite Covid-19
Integration successfully completed with improved operational performance
John Guest and RWC cultures successfully meshed together
John Guest Synergy Realisation
(A$m) Synergies: delivered $31.3m run rate at end of FY20. Further operational savings
opportunities identified to be delivered
EPS accretion in FY19 of 23% after one year of ownership
John Guest capabilities have proven to be world class (design, tooling, injection
molding, etc.)
New UK organisation structure implemented in 1st Quarter FY21 to better align with
future strategic direction
Investment made in upgraded equipment and systems (e.g. ERP)
Operational and management capabilities pressure-tested and proven during March-
June period
• ERP implementation coincided with the arrival of Covid-19
• Drop in sales orders required significant action to reduce output and minimise costs
• EMEA remained EBITDA positive throughout the 2nd half despite 24% drop in sales
19Restructuring and non-cash impairment charges
Continuous improvement and cost out initiatives expected to yield A$25m benefit on an
annualised basis by end of FY21
Summary of restructuring and impairment EBITDA
charges (A$m) Impact
Restructuring costs of $10.7m incurred in FY20 to Impairment of US non-core products IP and
cover: $16.8
inventory
• Consolidation of HoldRite production into Alabama US Restructuring $4.7
plant completed in August, reduction of 21 positions
Impairment of Spain plant and equipment $5.9
• Reduction of 22 positions within North America EMEA Restructuring $6.0
following SG&A and product development review
Total $33.4
• Restructure of UK operations to be completed in
September quarter with net reduction of 60 positions Non cash Impairment charge of $22.7m incurred in
FY20 relating to:
Continuous improvement initiatives continue to
yield results The decision to cease investing in and developing
selected non-core product categories, resulting in the
• Procurement, supply chain, S&OP, manufacturing impairment of intellectual property and inventory items
and process efficiencies
A review of RWC’s operations in Spain with an
impairment to the carrying value of plant and
equipment
20Cash flow performance
Strong cash flows in the second half and for the year ended 30 June 2020
A$m FY19 FY20 % 2HY19 2HY20 %
Reported EBITDA $242.5 $217.9 -11% $121.8 $92.0 -25%
Changes in working capital -$63.6 $60.4 n/m -$12.4 $51.1 n/m
Cash flow from operations $178.9 $278.3 56% $109.4 $143.1 31%
Operating cash flow conversion 74% 128% n/m 90% 155% n/m
Capital expenditure $69.6 $43.4 -38% $34.1 $18.0 -47%
Commentary
Working capital reduced by 6% and shortened cash conversion cycle by 24 days from prior year
Inventory levels were lower due to reduced manufacturing volumes in the first half and strong demand in the
US in the second half
Debtor collection strong – growth in US receivables offset by reduction in EMEA
Strong DPO improvement from increased payables and large accrual increases
21Capital expenditure
FY2021 forecast capital expenditure (A$m)
90 6.3%
5.6% 6.0%
80
5.0% $70m
70 5.0%
4.2% 3.7%
60
4.0%
50 $35m-$55m Maintenance
$38m $43m
40 $30m 3.0%
30 $26m Growth
2.0%
20
1.0% % of Sales
10
0 0.0%
FY16 FY17 FY18 FY19 FY20 FY21
Cullman Phase 1 Property acquisition Capacity expansion Expansion of product Production expansion
expansion completed, in Cullman supporting core PTC range, capacity and in the USA and UK
increasing brass PTC product growth in the efficiency in PEX pipe,
fittings production Capacity expansion USA HydroFlame Pro and New product
capacity following regular EvoPEX development including
review of capital HydroFlame
Potential to further plan Planned expansion at
increase capacity with John Guest New ERP system for
incremental capital EMEA
outlay New ERP system for
APAC
22Balance Sheet further strengthened
Debt metrics Commentary
(A$m) 30 June 2019 30 June 2020 Strong balance sheet with net leverage of 1.39x at 30 June
Net debt reduced by $124.4m since 30 June 2019
Cash and cash equivalents 69.3 82.2
Syndicated bank debt facility of $750m with undrawn
Gross debt 495.9 384.4 headroom of approx. $450m including cash balances
Net debt1 426.6 302.2 Facility is in 3 tranches:
Tranche A: $250m expires 30/9/21
Net debt / EBITDA 1.67x 1.39x
Tranche B: $250m expires 30/9/22
Tranche C: $250m expires 30/9/23
Net working capital
Continue to remain comfortably in compliance with financial
(A$m) 30 June 2019 30 June 2020 covenants
Working capital reduced by 14% and shortened cash
Trade and other receivables 232.3 245.9 conversion cycle by 35 days from prior year
Inventories 229.1 215.4 Reductions in inventory as production was reduced in first
half of FY20 to match sales growth
Trade and other payables (132.0) (178.2)
Debtor collection strong – growth in US receivables offset
Net working capital 329.4 283.1 by reduction in EMEA
Increased payables reflect timing of inventory purchases,
and accruals for restructuring
1 Net debt excludes lease liabilities 23Strategy and Outlook
24Strategy overview
Our strategy is unchanged but we have sharpened our new product
development approach with increased focus on core products
Guiding strategy is unchanged, after extensive review in light of Covid-19 - refer Appendix
The greater focus on core products we announced at the half year are even more relevant/prudent in light of Covid-19:
o Product extensions and new products that expand the basket for existing end users
o Existing end users, and/or existing distribution partners
o Leveraging the strength of our brands where they are recognised and valued
o Utilising our core operational and executional competencies
Near term emphasis for FY21
o Greater operational emphasis, seeking cost savings and efficiencies, while balancing customer fill rates and inventory levels
o Still moving forward core development activities
25Outlook for FY 2021
RWC is not providing earnings guidance at this time
Due to the uncertain market outlook and potential impacts of further Covid-19 outbreaks, RWC will not provide earnings
guidance for FY20211
We will ensure the market has appropriate visibility on trading conditions as FY2021 progresses
Trading conditions since 30 June 2020:
• July 2020 sales relative to the prior corresponding period (pcp):
• Americas sales growth of 22%
• APAC sales up slightly
• EMEA sales recovered to 96% of pcp
August 2020 sales for first 3 weeks :
• Continued Americas sales growth over pcp but at a slower rate than for July
• APAC flat to slightly ahead of pcp
• EMEA has continued to see a recovery in sales and is ahead of the same period last year
1 Key assumptions for FY2021 are set out in the Results Announcement dated 24 August 2020
26Segment performance drivers: Americas
US home improvement has seen strong growth during Covid-19
Market backdrop:
Low-interest rate environment remains supportive
US demographics support a strong rate of household
formation
Unemployment rate and a broader recession will be
risks in FY21
What we will be watching for:
Trends in retail sales – signs that buoyant conditions
are easing
Recovery in wholesale channel sales
Changes in US consumer sentiment
Key indicators:
Leading indicator of remodelling activity (LIRA)
Home value trends: repair and remodel activity has tracked home
values historically
New housing permits and commencements
27Segment performance drivers: Asia Pacific
Declining Australian new residential construction likely to negatively impact volumes
Australian Residential Approvals1 Market backdrop:
250,000
-26% We expect to be adversely impacted by a reduction in
200,000 Australian new residential house and apartment
construction in FY2021:
150,000
26% decline in total approvals between FY18
100,000 and FY20
50,000 39% decline in multi-family approvals
Demand from OEM’s also expected to soften
-
FY16 FY17 FY18 FY19 FY20 We will be targeting new product revenue growth to at
least partly mitigate any downturn in sales as a result of
Detached Houses Multi-Family
broader macro demand drivers
Key indicators:
Multi-family and stand alone residential approvals What we will be watching for:
New housing commencements Second wave of downturn in new residential
Residential construction drivers: construction as a result of Covid-19
Unemployment, government stimulus measures, net
migration levels, foreign student enrolments, returning
expatriates
1 Source:
28
Australian Bureau of StatisticsSegment performance drivers : EMEA
Covid-19 led to a severe economic contraction in EMEA; outlook remains uncertain
Market backdrop:
UK new work, repair and maintenance1
120 The European economy is experiencing a severe
contraction resulting in CY20 annual GDP declines of 8-
110
11% in RWC markets
100 Recovery is uncertain albeit encouraging signs emerging
90 as major economies slowly open
Recovery in sales may be due to pent-up demand and
80
channel re-stocking
70 Outcome of ongoing UK trade negotiations with Europe
may continue to impact UK business sentiment
60
All work All new work Repair and maintenance
50
What we will be watching for
Signs that pent up end-user demand has been satisfied
Distribution channels having restored depleted inventory
levels
Key indicators:
UK new residential construction trends
UK repair and maintenance activity statistics (chart above)
Sales performance of UK distributors
British Merchants Federation sales trends
1 Source: UK Office of National Statistics 29Priorities for FY21
We will continue investing in the future growth of the business while meeting the
operational challenges and market uncertainties of the current environment
Health & safety and wellbeing of our people, especially in the context of ongoing COVID, including
enhanced communication and efforts to maintain strong employee engagement
Continued focus on operational excellence and execution, remaining agile and acting quickly in the
face of changing external factors
Delivery of above market top line growth in all key geographies
Margin expansion through continuous improvement initiatives
Prudent management of costs to aid margin expansion
Supply chain improvements including sourcing security and overall planning and efficiency
improvements
Utilising new tools, including ERP, to begin yielding anticipated long-term benefits
Prudent capital expenditure allocation
30Summary
We remain well positioned for future growth and the resilience of the business
has been demonstrated through the Covid-19 pandemic
The RWC business is robust, successfully weathering recent extreme challenges
The plumbing & heating market, and especially our primary repair and maintenance category, is
highly resilient
Our focus over the last several months has been on execution and will continue to be so into the
near future
The RWC business is well positioned and appropriately structured to navigate the near-term
challenges and to accelerate out as visibility improves
There remains significant uncertainty in the future, with the potential to dramatically impact our
trading results, but we are confident in our ability to successfully work through these impacts
31Q&A
Appendix: Strategy Overview

                              33
Appendix: reported segment results (A$)
AMERICAS (A$m) FY19 FY20 %
Net Sales 653.9 739.1 13%
EBITDA 102.5 96.8 -6%
EBITDA margin 15.7% 13.1% (260) bps
Adjustments 10.1 21.4
Adjusted EBITDA 112.6 118.2 5%
Adjusted EBITDA margin 17.2% 16.0% (120) bps
EMEA (A$m) FY19 FY20 %
Net Sales 360.9 324.3 -10%
EBITDA 95.8 81.1 -15%
EBITDA margin 26.5% 25.0% (150) bps
Adjustments 15.1 11.9
Adjusted EBITDA 111.0 93.0 -16%
Adjusted EBITDA margin 30.7% 28.7% (200) bps
34Appendix: summary of restructuring and impairment
charges
A$m FY19 FY20
John Guest Costs to Achieve Synergies $19.7 -
Implementation of AASB 16 (Lease Accounting) $16.3 -
Impairment of US non-core products - $16.8
EMEA Restructuring - $6.0
Impairment of Spain operations - $5.9
US Restructuring - $4.7
Total $36.0 $33.4
35Appendix: cash flow generation from operations A$m FY19 FY20 Variance Reported EBITDA 242.5 217.9 -10.0% Changes in Working Capital (63.6) 60.4 Cash flow from operations1 178.9 278.3 53.9% Operating cash flow conversion2 73.8% 127.7% Growth capital expenditure (45.2) (21.5) -52.4% Maintenance capital expenditure (24.4) (21.9) -10.2% Interest paid, net (22.5) (10.7) -52.4% Tax paid (25.4) (37.5) 47.6% Dividends paid (54.9) (39.1) -28.8% Purchase of Treasury Shares (7.4) 0.0 Lease Payment / Other, net 0.2 (11.5) Cash Flow before acquisitions and repayment of borrowings (0.7) 133.1 John Guest related non-recurring payments3 (17.5) 0.0 Net repayment of borrowings (186.3) (120.6) Net change in cash and cash equivalents (204.5) 12.5 Change in net debt (38.6) 124.4 1 BeforeJohn Guest related non-recurring acquisition and integration payments, capex, financing and taxation 2 FY19 = Cash flow from operations to Reported EBITDA of $242.5 million 3 Cash bonuses paid to John Guest employees. Funded by cash received from the vendors at closing of the acquisition 36 n / m = not meaningful
You can also read