Umicore Investor Presentation - October 2019

Page created by David Davidson
 
CONTINUE READING
Umicore Investor Presentation - October 2019
Umicore Investor Presentation
                    October 2019
Umicore Investor Presentation - October 2019
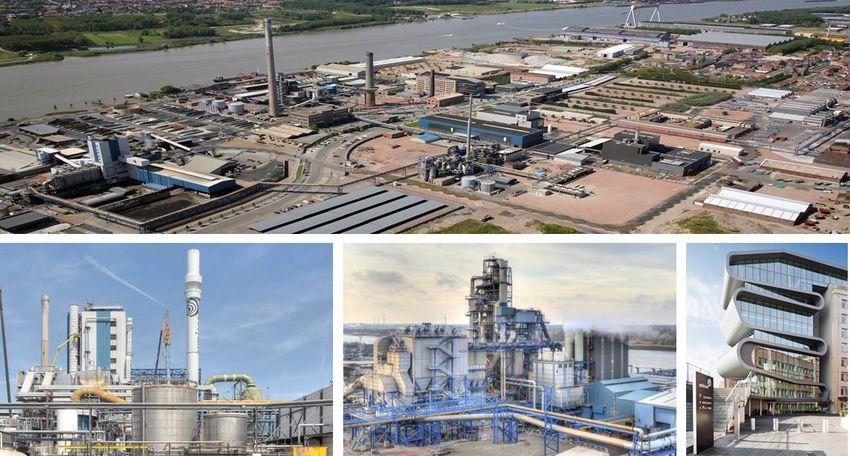
Introduction to Umicore
Umicore Investor Presentation - October 2019
We are a global materials technology and
recycling group

    One of three global            A leading supplier of key       The world’s leading
    leaders in emission control    materials for rechargeable      recycler of complex waste
    catalysts for light-duty and   batteries used in electrified   streams containing
    heavy-duty vehicles and        transportation and portable     precious and other
    for all fuel types             electronics                     valuable metals

                                                                                               3
Umicore Investor Presentation - October 2019
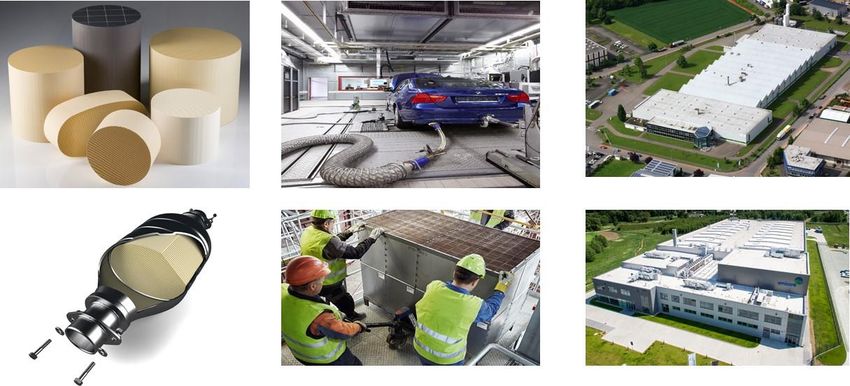
With a unique position in clean mobility
materials and recycling

             Internal                                           Plug-In Hybrid
   Combustion Engine                                            Electric Vehicle
           Umicore provides:                                    Umicore provides:
    Emission control catalysts                                  Battery cathode materials and
                                                                emission control catalysts

   Full Electric Vehicle                                        Fuel cells
            Umicore provides:                                   Umicore provides:
    Battery cathode materials                                   Electro-catalyst and
                                                                battery cathode materials

            Present across all drive trains and offering sustainable closed-
            loop services
                                                                                                4
Umicore Investor Presentation - October 2019
Built on sound foundations
                                          Supportive
    Unique business                                                  Industry leader in
                                         megatrends &
         model                                                         sustainability
                                          legislation

                                                         resource
                                                         scarcity
                                      more
                                    stringent
                                    emission
                                     control

                                                electrification
        recycling
       recycling                                    of the
                                                 automobile

             We help improve air quality, make electrified transport possible
             and tackle resource scarcity
                                                                                          5   5
Umicore Investor Presentation - October 2019
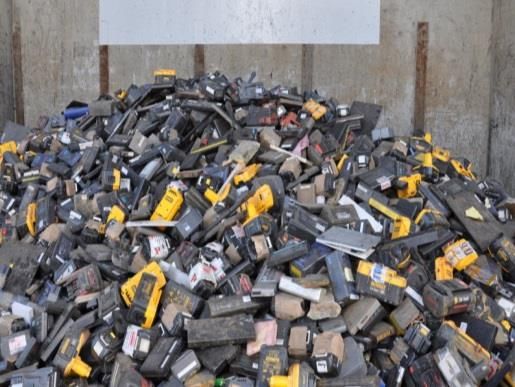
With a robust financial performance and a
global presence

    Key figures (H1 2019)

                  Recurring
  Revenues
                   EBITDA
   € 1.6 bn
                   € 357 m

  Recurring         ROCE
     EBIT           12.3%
   € 240 m

                                        Revenues* by
                                        geography

                              * 2018 data              6
Umicore Investor Presentation - October 2019
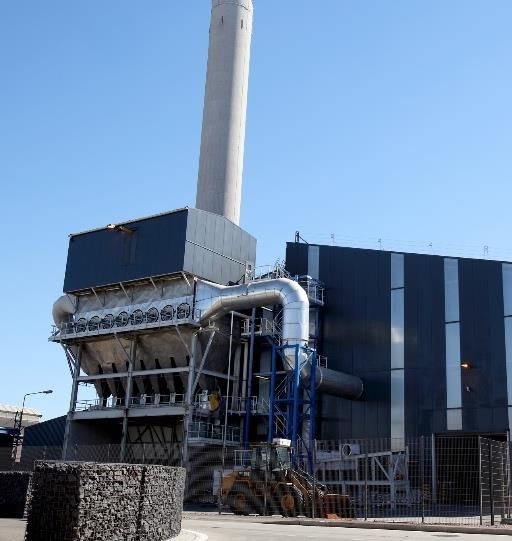
We deliver on our Horizon 2020 strategy

               Clear leadership    Doubled the size
               in clean mobility   of the business in
               materials and       terms of earnings
               recycling

               Rebalanced the      Turned
               portfolio           sustainability into
               & earnings          a greater
               contributions       competitive edge

                                                         7
Umicore Investor Presentation - October 2019
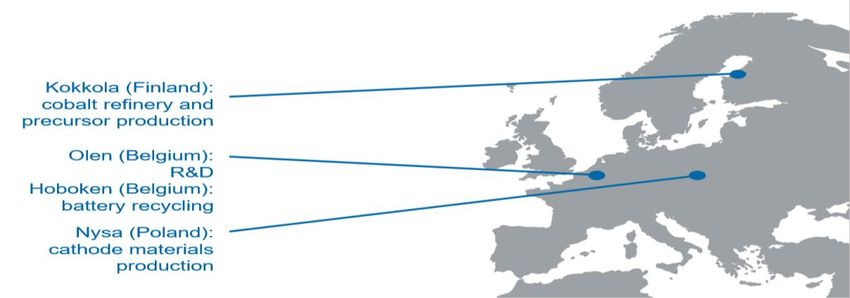
With a focused & balanced Group structure

                               CATALYSIS                   ENERGY & SURFACE                      RECYCLING
                                                             TECHNOLOGIES

                           Automotive Catalysts         Rechargeable Battery Materials       Precious Metals Refining
                        Precious Metals Chemistry         Cobalt & Specialty Materials      Jewelry & Industrial Metals
                                                                    Electroplating         Precious Metals Management
                                                              Electro-Optic Materials

                                 Revenues*                                                       Capital employed*
                                                                 Recurring EBIT*
                              (excluding metal)                                                      (average)

                                                                                           14%
                     19%                                                             33%
                                                        29%                                                          35%
                                                  44%

                   37%                                                                     51%
                                                              38%
* H1 2019 data; corporate not included                                                                                     8
Umicore Investor Presentation - October 2019
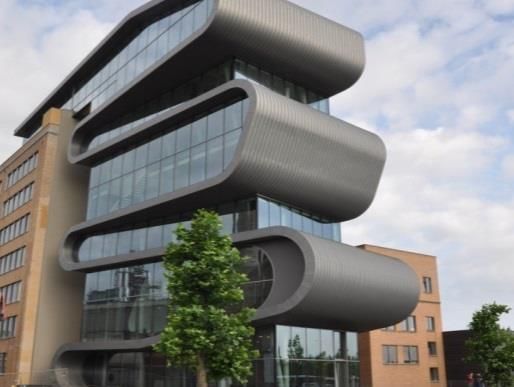
Unique position in Automotive Catalysts
CATALYSIS

                                                               Tightening emission norms for LDV and
            Total LDV and HDD catalyst market value            HDD, in particular in China, Europe and
                                                               India

                                                               Significant value uplift especially in
                                                               gasoline catalysts

                                                               Increasing share of gasoline cars globally

                                                               Umicore won largest share of cGPF
                                                               platforms in China and Europe

                                                               Increasing uptake of fuel cell drivetrains

                                                               Technology and innovation play

                    We are well positioned to capture unprecedented value growth in
                    automotive catalyst markets
                                                                                                            9
Umicore Investor Presentation - October 2019
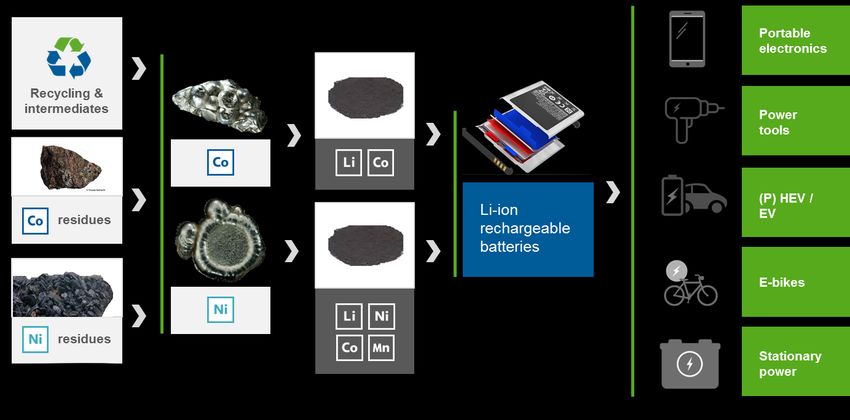
Unique position in Rechargeable Battery
 Energy &
  Surface   Materials for xEV
Technologies
               Electrification confirmed as main avenue to
               drastically reduce vehicle emissions in mid- and   Umicore uniquely positioned to address
               long-term                                          long-term requirements of this industry,
                                                                  while managing short-term fluctuations
               Strongly supported by legislation and evidenced    with agility
               by massive roll-out of car OEM’s e-mobility
               strategies                                              Full spectrum of highest quality
                                                                       cathode materials
               Increasing electrification drives strong market
               demand in mid and long-term                             Process technology and ability
                                                                       to scale up fast
               Technology roadmap offers ample room for                Innovation pipeline spanning next
               innovation and differentiation                          20 years
                   Product                                             Integrated supply chain and battery
                   Process                                             recycling

                   Closed loop offering

                                                                                                             10
Unique position in Recycling
RECYCLING

               Metallurgical leadership and
               proprietary technologies for        Increasing resource scarcity and need for closing the
               treating complex residues and by-   loop
               products
                                                   Growing complexity of materials to recycle
                Closing the loop                   Increased availability of complex materials, in particular
                in product businesses by           end-of-life materials
                offering recycling services
                                                   Eco-efficient recycling processes are becoming the
                                                   norm
               Over 200 different
               input streams

                                                   Umicore uniquely positioned to capture growth as the
               Recovery of more than
               20 different metals                 world’s largest and most complex precious metal
                                                   recycler with world class environmental and quality
                                                   standards

                                                                                                                11
We have a solid framework for value creation

                                                                           Focus on
                  Strong                     Focus on                      cashflows and
                  growth                     returns                       solid capital
                                                                           structure

    • Multiple growth drivers    • Earnings growth objective   • Prioritize cash for strategic
    • Secular trends             • Group and segment             organic growth projects

    • Supporting legislation      returns > cost of capital    • Currently in accelerated
                                 • 15%+ ROCE target              investment phase
    • Privilege organic growth
                                 • Value creation precedes     • Strong self-funding capacity
    • Complementary M&A, with                                    (normalized excl. current
       focus on value creation    ROCE maximization
                                                                 acceleration)
              R&D                                              • Not overstretch balance sheet
             6% of     Capex                                   • Cash return to shareholders
           revenues   € 478 m*

    * 2018 data                                                                                  12
And maintain a strong capital structure
                                                                                       31%
    2000                                                                                                                                    29%
                                                                      23%                                                  24%                    1.60
    1800                                                                                                                         1.35
             15%            15%                14%
    1600                                                                                                14%                                       1.40
                                                     14%                    1.15                                                                          Gearing
    1400                                                                                                                                          1.20     ratio
    1200                                                                                     0.87             0.91
                                                                                                                                                  1.00
                                                                                                                                 1,059
    1000                                                        0.72                                            861
                                                                            840                                                                   0.80
     800    0.59        0.65        0.60                                                                                                                     Average net debt
                                                     0.55                                                                                         0.60   
                                                                 556                                                                                         / recurring EBITDA
     600                                                                                     429
             314         321         298             296                                                                                          0.40
     400
     200                                                                                                                                          0.20
                                                                                                                                                          Consolidated net
       0                                                                                                                                          0.00     financial debt, end of
                                     H1 2016

                                                      H2 2016

                                                                                                                 H2 2018

                                                                                                                                  H1 2019
              H1 2015

                          H2 2015

                                                                  H1 2017

                                                                             H2 2017

                                                                                              H1 2018
                                                                                                                                                           period

million €

    Net financial debt € 1,059 m                                 Corresponds to :                                                  Ample funding headroom to
                                                                                                                                   execute growth strategy, no
                                                                 1.35 x average net debt to
    Modest impact from the adoption of                                                                                             need for additional capital
                                                                 recurring EBITDA ratio
    IFRS 16 due to limited use of                                                                                                  injection
    operating leases (€ 37 m)                                    29% net gearing ratio

                                                                                                                                                                            13
Business Group Overview
                   Catalysis
Catalysis

              A world leader in emission control catalysts for light-duty and
Automotive    heavy-duty vehicles and for all fuel types. Complemented by
  Catalysts   smaller stationary catalyst applications (marine, power
              generation, …).

  Precious    Develops and produces metal-based catalysts used in chemistry,
    Metals    life sciences and pharmaceutical applications. Also has a
 Chemistry    complete portfolio of catalyst technologies for fuel cells.

                                                                                15
Automotive Catalysts: business model
              We develop technologies which allow our customers to meet
          automotive emission legislation at the lowest Total Cost of Ownership

      Complete
      catalyst systems                                           Customer
      to reduce exhaust                                          focus
      gas emissions

                            People            Operational
                            engagement        excellence

      Global
      manufacturing &
      technical footprint

                                                                                  16
Automotive Catalysts Production Footprint
        19 plants in 14 countries, 10 R&D / tech. centers in 7 countries
                                                       Frederikssund     Karlskoga       Lyngby     Nowa Ruda       Songdo
                                                         Denmark         Sweden         Denmark      Poland         Korea

                                                                                                                     Onsan
      Burlington                                          Hanau                                                      Korea
       Canada                                            Germany
                                                                                                                    Tokoname
   Auburn Hills, MI                                      Florange                                                     Japan
        USA                                              France
                                                                                                                      Kobe
                                                                                                                     Japan
      Tulsa, OK                                         Rheinfelden/
         USA                                           Bad Säckingen                                                 Himeji
                                                         Germany                                                     Japan
     Houston, TX
        USA                                                                                                          Tianjin
                                                                                                                     China

                                    Americana                                                                        Suzhou
                                     Brazil                                                                         China (2)

Production plant
R&D/Tech. center
                                           Joinville                   Port Elizabeth       Pune          Rayong
Production plant/R&D Tech. center
Stationary                                  Brazil                     South Africa         India        Thailand

                                                                                                                                17
Total LDV and HDD catalyst market
set for unprecedented value growth

MARKET VALUE
EVOLUTION BY
     REGION                                                      Massive tightening of
            Europe                                              emission norms in China,
                                                                 Europe and India drive
     Greater China                                              massive value uplift in both
     Japan / Korea                                              the LDV and HDD catalyst
                                                                 markets
Middle East / Africa   
    North America                                               Value growth
                                                                 by far outpacing
    South America                                               vehicle production
       South Asia
     (mainly India)
                                                                Technology and
                                   1                 2      3
                                                                 Innovation play
                                 2017              2020   2025

             Source: IHS, KGP, Umicore estimates

                                                                                           18
Umicore well positioned to capture this growth

Next to volume growth, unprecedented future system value step-up due to
     tightening emission norms in Europe, China and India in particular.

 Light-Duty Vehicles           Heavy-Duty Diesel             Stationary :
 ▪ Gaining significant share   ▪ Growing from a distant #    ▪ Growing niche
   in growing gasoline           3 position                  ▪ New legislation
   segment                     ▪ Strong position in China,   ▪ Leverage global
 ▪ Disproportionate share of     the largest HDD market        presence
   gasoline GPF platforms      ▪ Development partner of
   won in China and Europe       most major HDD OEMs

 Through R&D, we continue to build a competitive technology portfolio and
     invest in additional flexible capacity using proprietary processes

                                                                                 19
Catalysis H1 2019 performance
 Revenues +1% and stable REBIT; in strong contrast with declining auto market

                                                            REVENUES
                                                              800
                                                              700
Automotive Catalysts

                                                                                                                                                                 717
                                                                                                                                          709
                                                              600
                              (~90% Catalysis revenues)

                                                                                                                                                       652
                                                                                                                    633

                                                                                                                               620
                                                              500

                                                                                               598

                                                                                                          565
                                                                       549

                                                                                   545
                                                              400
                                                              300
  Market share gains in light duty gasoline                   200
                                                              100
  Growing penetration of cGPFs                                  0

                                                                        H1 2015

                                                                                                          H2 2016

                                                                                                                                          H1 2018
                                                                                    H2 2015

                                                                                               H1 2016

                                                                                                                     H1 2017

                                                                                                                                H2 2017

                                                                                                                                                       H2 2018

                                                                                                                                                                 H1 2019
  Good customer and platform mix esp. in China
                                                                                                                                                                            H1
  Higher revenues in heavy-duty diesel
                                                                                                                                                                            H2
                                                            REBIT
                                                              100
Precious Metals Chemistry                                      90
                                                               80

                                                                                                                                                                 87
                                                                                                                                          86
                                                                                                                               85

                                                                                                                                                       82
                                                                                                                    81
                                                               70

                                                                                              78
  Strong demand from pharmaceutical and chemical

                                                                                                         75
                                                               60
  industries

                                                                                  63
                                                                      61
                                                               50

  Higher revenues from fuel cell catalysts                     40
                                                               30
                                                               20
                                                               10
                                                                0

                                                                                                                               H2 2017

                                                                                                                                                       H2 2018
                                                                      H1 2015

                                                                                  H2 2015

                                                                                              H1 2016

                                                                                                         H2 2016

                                                                                                                    H1 2017

                                                                                                                                          H1 2018

                                                                                                                                                                 H1 2019
                                                          million €                                                                                 Umicore H1 2019 performanc e   20
Strong growth drivers in Catalysis

   Tightening emission norms for         Umicore best positioned to
   LDV and HDD, in particular in         capture growth in growing
   China, Europe and India               gasoline segment

   Significant value uplift especially   Largest share of cGPF platforms
   in gasoline catalysts                 won in China and Europe

   Increasing share of gasoline          Umicore well positioned to
   platforms in the global mix           capture growth in HDD segments

   Increasing uptake of fuel cell        Umicore expanding capacity in
   drivetrains                           fuel cells

                                                                         Umicore H1 2019 performanc e   21
Impressions

                                                            Bad-Säckingen plant AC, Germany
Catalyst elements     Test bench

                      Installation stationaryDNoxcatalyst   Nowa Ruda plant AC, Poland
Canned catalyst
                                                                                              22
Business Group Overview
         Energy & Surface Technologies
Energy & Surface Technologies

Rechargeable
              A leading cathode material supplier for lithium-ion rechargeable
     Battery
              batteries used in electrified vehicles and portable electronics.
    Materials

     Cobalt & Refines and recycles cobalt and nickel; produces cobalt and
     Specialty nickel specialty chemicals for a wide range of applications (incl.
     Materials tires, catalysts, surface treatment). Also includes battery recycling.

                  Supplies precious metal electrolytes & processes for technical,
Electroplating functional and decorative applications.

                  Supplier of products for thermal imaging as well as wafers for
Electro-Optic
              space solar cells and high brightness LEDs, chemicals for fiber
    Materials optics and thin film applications.

                                                                                        24
Rechargeable Battery Materials: business model

            Product innovation         Process innovation
            based on strong            fuels productivity
            application know-how       improvements while
                                       maintaining highest quality
                                       standards (stringent
            Established industrial     automotive standards)
            footprint close to the
            customer
                                       Integrated process flows
            Strong industrialization   with guaranteed access
            capabilities building on   to critical raw materials
            historical Umicore key     allows an agile market
            competences                approach

                                                                     25
Battery market projections
         Electrification triggered by legislation in Europe and China

                              700
Electrification
Regulatory driver             600

                              500

                              400
Portables
Societal driver               300

                              200

Energy                        100
Storage System
Regulatory driver              0
                                    2015                2020                 2025

                                     Source: Avicenne, Navigant, Roland Berger, AABC,
                                     IHS, Gartner, SNR, CRU, Roskill
                                                                                        26
It takes a lot to play
in the automotive league
Car OEMs need :
High quality cathode materials                     excellent product quality on 20+ specs
• … custom made for different types of xEVs        wide spectrum of cathode material technologies
• … in massive volumes                             industrial capabilities
• … at the highest speed and flexibility           ability to scale up fast
• … at a competitive price                         cost-efficient processes
• …without any sustainability image risk.          ethically sourced materials

                                It takes product technology,
                              process technology and supply

                                                                                                    27
Product, process and supply
Key success factors

3   Supply            1    Product Technology                                     2 Process Technology

        Raw                                                                                          Industrial
                                   Lab scale                        Pilot scale
        materials                                                                                    scale

• Feed flexibility                                                      • Ability to scale up fast
                            Wide spectrum of cathode
                                                                        • Cost-efficient processes
• Battery recycling           material technologies
                                                                        • Industrial capabilities

                               Best in class product quality on 20+ specs:
                          continuous fine-tuning at lab, pilot and industrial scale

                                                                                                                  28
1        Cathode material specs to fulfil cell
  Product
technology
             performance specs

                    Cathode material                                       Cathode material
                    product specs                                          performance specs
                    • Particle size      • Packing                         • Capacity                • Safety
                    • Morphology           density                         • Power             • Charge
                    • Composition        • Porosity                          (charge/discharge) efficiency
                    • Purity             • Consistency                     • Cycle life              • and more…
                                         • and more…

              Tailoring cathode               Fundamental chemistry know-       Ability to further enhance the
              material characteristics        how to design the right product   product designs during the
              to the cell specs               composition during lab phase      qualification cycles in pilot phase
              requires:

                                                                                                                      29
2             Rechargeable Battery Materials
  Process
technology
                  Expansion projects timeline
                Year
                                    2016             2017            2018       2019       2020        2021        2022       2023

             EUR 160 million
             announced April 2016             Brownfield in China
                                              Greenfield in Korea
                                                                                    Completed on accelerated schedule
                                           Significant scale effects that
             EUR 300 million                benefitted 2018 margins
             announced May 2017

                                                                                       Greenfield in China and Poland
                                                                                       Competence Center in Belgium
             EUR 660 million
             announced Feb 2018
                                                                            Expected to result in significant upfront costs in 2019
                                                                              Construction (China, Poland) on track, timeline for
                                                                            ramp up of new capacity adjusted to pace of demand

                                                                                                                                  30
3      Access to raw materials
Supply   Unique integration in the value chain
            Raw material   Metal         Product        Application          End use

             Umicore          •    Flexibility in supply feed, high speed to market
                                   and responsiveness to customer needs
                                                                                       31
3      Access to raw materials
Supply   Battery recycling as critical additional source of supply
                                        •   Umicore is fully aligned with OECD Due Diligence
                                            for Responsible Supply Chains of Minerals from
                                            Conflict-Affected and High-Risk Areas
                                        •   Certified clean and ethical supply to our
                                            customers
                                        •   Urban mining indispensable for global
                                            electrification of transportation
                                        •   Proven industrial capabilities for all types and
                                            formats of Li-ion batteries
                                        •   Patented recycling technology
                                        •   High recovery rates for lithium, cobalt, nickel and
                                            copper
                                        •   Highest environmental standards

             Umicore   Flexibility in supply feed, high speed to market
                       and responsiveness to customer needs
                                                                                                  32
Expanding integrated and sustainable battery
    materials supply chain

Agreement to acquire Freeport                              Partnership with Glencore for
Cobalt’s refining and cathode                              sustainable cobalt supply
precursor activities in Finland                               Long-term supply guarantee for substantial part of our
                                                              cobalt needs
  Fully integrated and sustainable battery materials
  supply chain in Europe                                      Cobalt sourced from state-of-the-art industrial mining
                                                              operations, then shipped to our refineries globally
  To support Umicore’s and its customers’ European
  growth plans
                                                          Umicore battery supply chain in Europe
  Supply precursors for cathode materials production in
  Poland, due to start in H2 2020
  Complementary IP and know-how for refining and
  precursor production
  Team of experienced battery industry professionals
  Acquisition earnings accretive from 2020 and value
  accretive from 2021
  Closing subject to customary conditions and approvals

                                                                                                         Umicore H1 2019 performanc e   33
E&ST H1 19 performance
Revenues -7%; REBIT -16% reflecting slowdown in demand and lower metal prices

                                                                  REVENUES
                                                                    700
Rechargeable Battery Materials                                      600

                                                                                                                                                     650

                                                                                                                                                                    639

                                                                                                                                                                                607
                                                                    500

                                                                                                                                         495
                                                                    400
    Lower NMC for ESS and LCO sales

                                                                                                                             398
                                                                    300

                                                                                                                 321
                                                                             298
    Flat demand for automotive applications                         200

                                                                                         289

                                                                                                     288
                                                                    100
                                                                      0

                                                                              H1 2015

                                                                                                                  H2 2016

                                                                                                                                                                    H2 2018
                                                                                          H2 2015

                                                                                                      H1 2016

                                                                                                                              H1 2017

                                                                                                                                          H2 2017

                                                                                                                                                     H1 2018

                                                                                                                                                                                H1 2019
Recycling and refining activities hit by lower metal prices
                                                                                                                                                                                           H1

                                                                                                                                                                                           H2
Cobalt & Specialty Materials                                      REBIT
                                                                   160
                                                                   140
    Customer destocking of excess inventories                      120                                                                                            136
                                                                   100                                                                              121
    Activities impacted by low metal prices                         80                                                                                                        102
    Inflow of cheaper unethically sourced artisanal cobalt          60                                                                  79
                                                                    40                                                      61
                                                                            40                                  45
                                                                    20
                                                                                        30          37
         Electroplating
Revenues for                        slightly down; stable for        0

                                                                                        H2 2015

                                                                                                                                                    H1 2018

                                                                                                                                                                   H2 2018
                                                                            H1 2015

                                                                                                    H1 2016

                                                                                                                H2 2016

                                                                                                                            H1 2017

                                                                                                                                        H2 2017

                                                                                                                                                                               H1 2019
Electro-Optic Materials
Battery materials value chain is ~70% E&ST revenues
                                                                million €                                                                                      Umicore H1 2019 performanc e      34
Strong growth drivers for E&ST
Electrification and technology differentiation

      Electrification confirmed as the main      Technology roadmap offers ample
      avenue to drastically reduce vehicle       room for innovation and
      emissions in mid & long term               differentiation:
                                                  Product: range, charging times,
      Strongly supported by legislation:          durability
           Continued regulatory push in China
           despite earlier than anticipated       Process: ability to scale up fast, cost
           subsidy cuts                           efficient and flexible processes,
                                                  quality consistency
           CO2 legislation in Europe
                                                  Closed loop offering
      and evidenced by the massive roll-
     out of car OEM’s e-mobility strategies

         Umicore ideally positioned to address the long-term requirements of
         this industry, while managing short-term fluctuations with agility
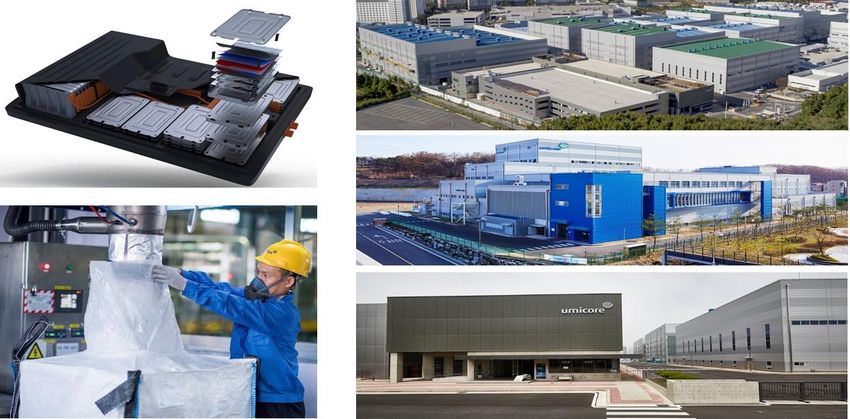
                                                                                       Umicore H1 2019 performanc e   35
Impressions

EV car battery pack

                                                                   36
Packaging finished product   RBM Cheonan production sites, Korea
Business Group Overview
                  Recycling
Recycling

                     Operates the world’s most sophisticated precious metals recycling facility
  Precious Metals
                     and recovers 17 precious and other valuable metals from complex waste
         Refining    streams.

  Precious Metals    Services for hedging, leasing, purchasing and sale of precious and
     Management      platinum group metals to internal and external customers

                     Supplier of precious metals based products for jewelry and industrial
        Jewelry &
                     applications, recycler of jewellery and production scrap and producer of
 Industrial Metals   platinum-based equipment for the glass and chemical industries.

                                                                                                  38
Precious Metal Refining

    Largest and most
    complex precious
     metals recycling
      operation in
        the world         Leading refiner of
                          17 different metals

       Processes
     more than 200
     different types
    of raw materials         World class
                          environmental and
                           quality standards

                                                39
The value chain of metals
                   Ores &                     Refined                 New
                 concentrates                 metals                products

                                Smelters                                       Consumers
       Mines                                            Industry
                                & refiners

               Complex mining            Smelting              Complex                 Complex
               concentrates              & refining            production              end-of-life
               & residues                residues              scrap                   materials

                 Industrial by-products                            End-of life materials

                                                                                                     4040
Revenue Drivers

                        Main revenue drivers

           Treatment & refining
                                              Metal yield
                 charges

           Treatment charges are        Umicore assumes the risk
          determined, among other         of recovery above or
          criteria, by the complexity    under the contractually
                of the materials          agreed recovery rate

                                                                   41
Metal price exposure
                                               Managing the effects
                                               of metal price movements
        Direct:             Indirect:          on earnings

     through metal        through raw           Systematic hedging of
          yield        material availability    transactional exposure

                                                Depending on market conditions
                                                hedging of (part of) structural
                                                metal price exposure through
                                                contractual arrangements

                                                Impact on working capital is
                                                mitigated by toll-refining – metals
                                                remain property of the supplier
                                                during treatment

                                                                                      42
Umicore has unique technology

       Umicore is unique due to its
       proprietary complex flowsheet that
       combines three metallurgical
       streams

                                        This enables

                                                   Ability to optimize
      Flexibility to treat      Recovery &                               Scope to broaden
                                                        feed and
      a broad range of       valorization of the                          to new types of
                                                        therefore
       input materials          most metals                              materials in future
                                                      profitability

     • Umicore technology guarantees environmentally friendly
        processing, a high yield and a more competitive cost
     • Umicore introduced its unique Ultra High Temperature
        technology for Battery Recycling more than 5 years ago
                                                                                               4343
Recycling H1 2019 performance
     Revenues and REBIT -2%(*) due to extended maintenance shutdown

                                                                                       REVENUES
                                                                                        600

                                                                                        450
 Precious Metals Recycling                                  (~70% Recycling
                                                                                        300
 revenues)

                                                                                                     343

                                                                                                                                                     339

                                                                                                                                                                          327
                                                                                                                                323
                                                                                                                   320

                                                                                                                                          318

                                                                                                                                                                                                     313
                                                                                                                                                               311

                                                                                                                                                                                       300
                                                                                        150
       Better throughput rates following latest wave of
       investments in Hoboken                                                                0

                                                                                                                    H2 2015

                                                                                                                                                     H1 2017

                                                                                                                                                                                                     H1 2019
                                                                                                      H1 2015

                                                                                                                                H1 2016

                                                                                                                                           H2 2016

                                                                                                                                                               H2 2017

                                                                                                                                                                          H1 2018

                                                                                                                                                                                       H2 2018
       Lower processed volumes due to extended scheduled                                                                                                                                                             H1
       shutdown                                                                                                                                                                                                      H2
                                                                                       REBIT
       Better supply mix and higher metal prices
                                                                                       100
 Revenues for    Jewelry & Industrial Metals
                                                                                                 77                                                                       79
 slightly up; higher earnings contribution from Precious                                50                      65            62          63
                                                                                                                                                     73                                                76
                                                                                                                                                               55                       56
 Metals Management
                                                                                         0

                                                                                                                H2 2015

                                                                                                                                                     H1 2017
                                                                                                 H1 2015

                                                                                                                              H1 2016

                                                                                                                                          H2 2016

                                                                                                                                                                H2 2017

                                                                                                                                                                             H1 2018

                                                                                                                                                                                           H2 2018

                                                                                                                                                                                                          H1 2019
(*) excluding the impact of the divestment of the European activities of Technical
Materials at the end of January 2018                                                 million €                                                                                         Umicore H1 2019 performanc e        44
Strong drivers for Recycling

     Increasing resource scarcity    Umicore uniquely positioned to
     and need for closing the loop   capture growth in this segment
                                     as the world’s largest and most
     Growing complexity of           complex precious metal
     materials to recycle            recycler with world class
                                     environmental and quality
     Eco-efficient recycling         standards
     processes are becoming the
     norm

                                                                  Umicore H1 2019 performanc e   45
Impressions

PMR Hoboken recycling plant, Belgium   46
Financials H1 2019
Robust performance in a challenging environment
  REBIT & REBIT margin

     400                                                            13.5%
                                                                                                15.2%                            14.3%              16
                                                                                                                                                     . 0%
                                                                                                                                                                     Down compared to a record H1 18 and resilient
                                         12.4%
             11.8%                                                                                              15.9%                               14
                                                                                                                                                     . 0%

                                                                                                                                                                     sequential performance
     300                                                                                                                                            12
                                                                                                                                                     . 0%

                                                       12.8%                      13.0%                                                             10
                                                                                                                                                     . 0%

                                                                                                                                                                                              vs H1 18        vs H2 18

                                                                                                  261

                                                                                                                   252
     200

                                                                                                                                  240
                           10.0%
                                                                                                                                                    8.0%

                                                                                                                                                                        Revenues                -3%             +3%

                                                                                   203
                                                                     195
                                                                                                                                                    6.0%

                                                        165
                                           155

     100
                148

                                                                                                                                                    4.0%

                                                                                                                                                                        Recurring EBIT          -8%             -5%
                             120

                                                                                                                                                    2.0%

         0                                                                                                                                          0.0%
                                                                                                                                                                        Recurring EBITDA       -2%                =
                             H2 2015

                                           H1 2016

                                                                     H1 2017

                                                                                   H2 2017

                                                                                                                                  H1 2019
                H1 2015

                                                        H2 2016

                                                                                                  H1 2018

                                                                                                                   H2 2018
  REBITDA & REBITDA margin                                                                                                                                           Robust margin performance despite higher costs (D&A
                                                                                                                                                                     and greenfield expansions) :
      500                                                                                                        22.4%
                                              20.5%                                             21.3%                                 21.4%                 22 .0%

                                                                    20.2%
      400                                19.3%                           19.8%                                                                              20 .0%
                                                                                                                                                                        Recurring EBIT margin of 14.3%
             17.9%
                                                                                                                                                                        Recurring EBITDA margin of 21.4%
                                                                                                      364

      300                  17.4%
                                                                                                                                      357
                                                                                                                       356

                                                                                                                                                            18 .0%
                                                                                      299

                                                                                                                                                                        Adoption of IFRS 16 lease standard increasing D&A and
                                                                        288

      200
                                                          258
                                             238

                                                                                                                                                            16 .0%
                 220

                                                                                                                                                                        recurring EBITDA by € 7.3 million
                              206

      100                                                                                                                                                   14 .0%

                                                                                                                                                                        ROCE of 12.3% reflecting impact of recent investments
         0                                                                                                                                                  12 .0%
                       5
                   H1201

                                     5
                                 H2201

                                                   6
                                               H1201

                                                                6
                                                            H2201

                                                                              7
                                                                          H1201

                                                                                            7
                                                                                        H2201

                                                                                                            8
                                                                                                        H1201

                                                                                                                             8
                                                                                                                         H2201

                                                                                                                                                9
                                                                                                                                            H1201

                                                                                                                                                                                                                  Umicore H1 2019 performanc e   48
   Group, excluding discontinued activ ities, million €
Stronger free operating cash flows

                                                                                                                Cashflow generated from operations tripled
                                                                                                                compared to H1 18 and highest in recent years
                                                                                                                Stable net working capital in 1H19 versus last
                                                                                                                year’s strong increase

                                                                                                                Higher capex (€ 241 m) of which two thirds in
                                                                                                                E&ST
                                                                                                                Complemented by increased capitalized
                                                                                                                development expenses (€ 17 m) also mostly in
                                                                                                                E&ST
                                                                                                                Substantial improvement in free operating
                                                                                                                cashflow year on year (€ 50 m in H1 19)
                                                          *                                                     Full year projected capex of appr. € 600 m and
                                                                                                                targeting stable working capital
* Free operating cashf low = cashf low generated f rom operations – capex & capitalized dev elopment expenses                                    Umicore H1 2019 performanc e   49
Net cash flow profile

                                                                  **
                        *

        Free operating cashflow                               Tax and net interest cash                          Higher dividend pay-out to   Non-cash increase in net
               of € 50 m                                            out of € 86 m                                  Umicore shareholders        financial debt of € 37 m
           (- € 104 m in H1 18)                                        (€ 88 m in H1 18)                         (€ 96m vs € 91m in H1 18)      from IFRS 16 adoption

     * Cashf low generated f rom operations includes net working capital cash f lows
                                                                                                                                                         Umicore H1 2019 performanc e   50
     ** Free operating cashf low = cashf low generated f rom operations – capex & capitalized dev elopment expenses
Maintaining a strong capital structure
                                                                                         31%
      2000                                                                                                                                    29%
                                                                        23%                                                  24%                    1.60
      1800                                                                                                                         1.35
               15%            15%                14%
      1600                                                                                                14%                                       1.40
                                                       14%                    1.15                                                                                Gearing
      1400                                                                                                                                          1.20           ratio
      1200                                                                                     0.87             0.91
                                                                                                                                                    1.00
                                                                                                                                   1,059
      1000                                                        0.72                                            861
                                                                              840                                                                   0.80
       800    0.59        0.65        0.60                                                                                                                            Average net debt
                                                       0.55                                                                                         0.60         
                                                                   556                                                                                                / recurring EBITDA
       600                                                                                     429
               314         321         298             296                                                                                          0.40
       400
       200                                                                                                                                          0.20
                                                                                                                                                                  Consolidated net
         0                                                                                                                                          0.00           financial debt, end of
                                       H1 2016

                                                        H2 2016

                                                                                                                   H2 2018

                                                                                                                                    H1 2019
                H1 2015

                            H2 2015

                                                                    H1 2017

                                                                               H2 2017

                                                                                                H1 2018
                                                                                                                                                                   period

  million €

      Net financial debt € 1,059 m                                 Corresponds to :                                                  Ample funding headroom to
                                                                                                                                     execute growth strategy, no
                                                                   1.35 x average net debt to
      Modest impact from the adoption of                                                                                             need for additional capital
                                                                   recurring EBITDA ratio
      IFRS 16 due to limited use of                                                                                                  injection
      operating leases (€ 37 m)                                    29% net gearing ratio

                                                                                                                                                           Umicore H1 2019 performanc e   51
Further extended funding base
 Issuance of € 390 m US private placement notes,
                                                                                    Committed medium & long term
 complementing existing committed credit facilities :
                                                                                              facilities
        Historically low, fixed interest rates                                               Total of € 1,875 m
        Maturities of 7, 10 and 12 years                                          2000

        Expected drawdown in September                                            1800

 Total of committed medium and long term debt facilities                          1600                Syndicated bank facilities
 amounting to € 1,875 million.                                                    1400
                                                                                             795      (largely undrawn)

 No major maturities before 2029                                                  1200

                                                                                  1000
                                Debt maturity profile                                        390      2019 US Private Placement
            500                                                                     800

            400                                                                     600
            300
                                                                                             360      2017 US Private Placement
                                                                                    400
            200
                                                                                    200      330
            100                                                                                       2017 Schuldschein
              0                                                                        0
million €         2023   2024   2025   2026   2027   2028   2029   2030   2031   million €

                                                                                                                  Umicore H1 2019 performanc e   52
2019 Outlook
Outlook 2019
  As announced in April, Umicore expects its recurring EBIT for the full year to be in a range of € 475
       million to € 525 million, assuming no material further deterioration of the macroeconomic
                                             environment.

     In Catalysis, Umicore expects to continue outperforming the automotive market and grow the
                 business group’s recurring EBIT for the full year from last year’s level.

 The Energy & Surface Technologies business group continues to face challenging market conditions
  in its key end-markets which, combined with the effect of low cobalt prices and unethical supply as
 well as costs related to new investments, means that the business group’s recurring EBIT for the full
                         year is expected to be well below the level of last year.

     In Recycling, Umicore expects to benefit from the throughput improvement in Hoboken which,
  combined with a favorable supply mix and higher prices for certain metals, means that the business
  group’s recurring EBIT for the full year should grow from the level of 2018, despite the impact of the
                                       July fire incident in Hoboken.

                                                                                                           54
Key Investment Considerations
Key investment considerations
•   Well positioned to take advantage of accelerating global megatrends : more stringent emission control,
    electrification of the automobile and resource scarcity

      •   Global presence and unique competences acquired over many years;

      •   A market leader in most key product markets and particularly in automotive catalysts, cathode materials and
          complex polymetallic recycling;

      •   Strong organic growth prospects supported by legislation

•   Well-diversified business profile with broad product, end-market and customer base driven by a common theme of
    sustainability

•   Strong track record of and commitment to innovation to maintain competitive lead (R&D spending of close to 6
    % of revenues in 2018)

•   Robust financial performance across cycles and margin focus with recent investments yielding returns

•   Strong balance sheet with recent substantial growth investments

•   Experienced board, management team, and clear governance principles

                                                                                                                        56
Forward-looking statements

This presentation contains forward-       Should one or more of these risks,
looking information that involves risks   uncertainties or contingencies materialize,
and uncertainties, including statements   or should any underlying assumptions
about Umicore’s plans, objectives,        prove incorrect, actual results could vary
expectations and intentions.              materially from those anticipated,
                                          expected, estimated or projected.
Readers are cautioned that forward-
looking statements include known and      As a result, neither Umicore nor
unknown risks and are subject to          any other person assumes any
significant business, economic and        responsibility for the accuracy of these
competitive uncertainties and             forward-looking statements.
contingencies, many of which are
beyond the control of Umicore.

                                                                                        57
You can also read