Galaxy Surfactants Ltd - Investor Presentation - August 2018
←
→
Page content transcription
If your browser does not render page correctly, please read the page content below

Galaxy Surfactants Ltd.
        Investor Presentation - August 2018
Safe Harbor

This presentation and the accompanying slides (the “Presentation”), which have been prepared by Galaxy Surfactants Limited. (the “Company”), have been
prepared solely for information purposes and do not constitute any offer, recommendation or invitation to purchase or subscribe for any securities, and shall
not form the basis or be relied on in connection with any contract or binding commitment whatsoever. No offering of securities of the Company will be made
except by means of a statutory offering document containing detailed information about the Company.

This Presentation has been prepared by the Company based on information and data which the Company considers reliable, but the Company makes no
representation or warranty, express or implied, whatsoever, and no reliance shall be placed on, the truth, accuracy, completeness, fairness and
reasonableness of the contents of this Presentation. This Presentation may not be all inclusive and may not contain all of the information that you may
consider material. Any liability in respect of the contents of, or any omission from, this Presentation is expressly excluded.

This presentation contains certain forward looking statements concerning the Company’s future business prospects and business profitability, which are
subject to a number of risks and uncertainties and the actual results could materially differ from those in such forward looking statements. The risks and
uncertainties relating to these statements include, but are not limited to, risks and uncertainties regarding fluctuations in earnings, our ability to manage
growth, competition (both domestic and international), economic growth in India and abroad, ability to attract and retain highly skilled professionals, time
and cost over runs on contracts, our ability to manage our international operations, government policies and actions regulations, interest and other fiscal
costs generally prevailing in the economy. The Company does not undertake to make any announcement in case any of these forward looking statements
become materially incorrect in future or update any forward looking statements made from time to time by or on behalf of the Company.

                                                                                                                                                                2
Q1FY19 Performance Highlights

                        3
Volume: Q1FY19 Highlights (YoY)
                    Performance Surfactants            Specialty Care Products                       Total Volume

                              +12%                               +20%                                      +15%
                                     33,654                             18,823                                    52,477
                     29,926                                                                       45,564
                                                        15,638
Volume Highlights

                     Q1FY18          Q1FY19             Q1FY18          Q1FY19                    Q1FY18          Q1FY19

                       India Growth 14%           Africa Middle East Turkey 6%               Rest of the World 35%

                                              All Product Categories have exhibited growth

                                                                                                                           4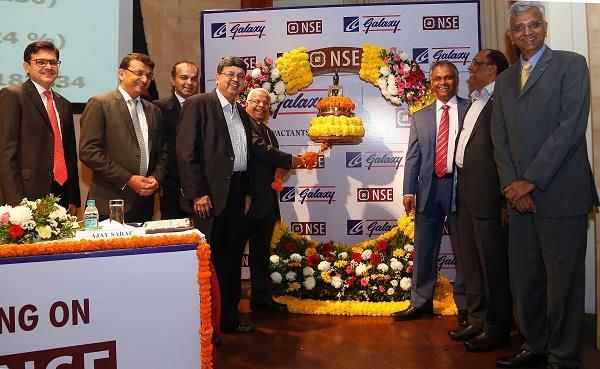
Revenue: Q1FY19 Highlights (YoY)
                            Performance Surfactants                              Specialty Care Products                              Total Revenue^

                                        +24%                                               +21%                                              +22%
                                                479                                                237                                               714
                                387                                                 196                                              585
Revenue Highlights

                              Q1FY18           Q1FY19                             Q1FY18          Q1FY19                            Q1FY18          Q1FY19

                                                                 EBITDA                                              PAT

                                                                 +21%                                               +28%
                                                                          87                                                 46
                                                          72                                                 36

                     Rs. In Crores
                                                        Q1FY18          Q1FY19                             Q1FY18          Q1FY19

                        As per Ind AS      ^Includes other Income                                                                                            5
Q1FY19 Highlights (QoQ)
                              Total Volume (in MT)         Total Revenue^

                                    +5%                          +11%

                         49,914                52,477                    714
                                                         645

                         Q4FY18                Q1FY19   Q4FY18          Q1FY19

                                      EBITDA                     PAT

                                    +22%                         +14%
                                                 87                         46
                           71                             40

   Rs. In Crores
                        Q4FY18                 Q1FY19   Q4FY18          Q1FY19

      As per Ind AS   ^Includes other Income                                     6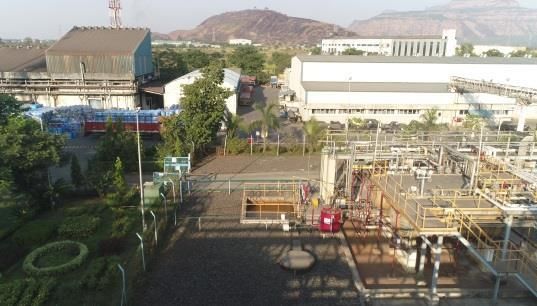
Consolidated Profit & Loss Statement
Particulars (Rs in Cr)        Q1 FY19   Q1 FY18   Y-o-Y   Q4FY18   Q-o-Q    FY18
Net Revenue from Operations    716.2     582.4            643.6    11.3%   2,433.9
Other Income                   -1.7       3.1              1.6              10.1     ▪ Average Forex rate in
Total Revenue                  714.5     585.4    22.0%   645.1    10.7%   2,444.1     Q1FY19 was Rs. 66.96
                                                                                       per USD versus Rs 64.4
Cost of Material Consumed      521.4     421.9            462.5            1,751.1
                                                                                       per USD in Q1FY18
Employee's Benefits Expense    38.3      36.6              38.2            146.0
Other Expenses                 67.7      55.0              73.0            249.1     ▪ The forex movement had
EBITDA                         87.0      71.8     21.2%    71.4    21.9%   297.9       an estimated positive
                                                                                       impact of 1.51 Cr on the
EBITDA Margin                 12.2%     12.3%             11.1%            12.2%
                                                                                       EBITDA in Q1FY19
Depreciation                   12.6      12.0              12.3             48.5
EBIT                           74.5      59.9     24.4%    59.1    25.9%   249.3
Finance cost                    7.7       7.6              6.7              30.6
PBT                            66.7      52.2     27.7%    52.5    27.2%   218.8
Tax expense                    21.0      16.4              12.5             60.7
PAT                            45.7      35.8     27.5%    40.0    14.2%   158.0
PAT Margin                     6.4%      6.2%              6.2%             6.5%
EPS                            12.89     10.11    27.5%   11.29    14.2%   44.57

         As per Ind AS                                                                                            7
Q1FY19: Key Developments

           Domestic (India) Business growth exceeds Market Growth rate

            Growth driven by all three customer segments: MNC’s, Regional & Local

                  The India and AMET markets continued to register growth above the industry
                                                growth rate

                         The ROW market outperformed on the back of a strong performance registered
                                          by the specialty care products segment

                              We are in process of setting up a representative office in China for direct presence in
                                                           the growing Chinese market

                                                                                                                        8
Business Overview

                    9
Truly Indian MNC…

  Leading manufacturer of      Product applications across   Preferred supplier to leading
   Ingredient for Home &       Mass, Mass-tige & Prestige     Multinational, Regional &          Brand Custodian
Personal care Industry (HPC)      range of Customers              Local FMCG Brands

   Globally Recognized           Integrated Across Full        Advanced portfolio of         Proven Credentials in R&D
                                   Value Chain of HPC          Innovative Products &
                                        Industry                     Solutions

                                                                                                                         10
…Vertically Integrated in HPC Industry
7 Strategically Located
200+ Product Grades Extensive R&D Capabilities Indigenous
Facilities with Inhouse Project 63 Members, R&D Centre, Pilot Intellectual property
Execution Capabilities Plant, Product Application 51 Approved; 37 Applied
5 in India, 1 in Egypt, 1 in US Centre;
1200+ Employees across
Serving Presence across Sustainability - A way of
1750+ Clients 75+ countries all our Facilities
Life
11We grow faster than HPC FMCGs
India’s Largest Manufacturer of Oleochemical based Surfactants and Speciality Care
Products for Home Care and Personal Care Industries (HPC)
Consumer to Innovation &
Chemistry Technology
01 03 05
Global Supplier 02 Multiple 04
High Growth
to Global Brands Products across Industry
Categories
12Our growth trajectory over Three Decades
1986: Incorporation of Company 1994: New plant set up at Tarapur 2004: setting up of EOU at Taloja 2011: Commissioning of Egypt and
Jhagadia Plants
1984: New Plant at Tarapur for 1995: Acquisition of Galaxy Chemicals 2009:
Ethoxylates, Phenoxyethanol, Sunscreens 2014: Purchase of business of
1997: Sulfonation plant Setup at Taloja and • Acquisition of Tri-K Industries
Surfactants International LLC
Research Centre at Navi Mumbai
• Galaxy Chemicals Egypt S.A.E. &
2016: Expansion of Jhagadia Plant
1998: Commissioning of new plant in Taloja Rainbow Holdings GmbH became
for mild surfactants
step down subsidiary
Revenue (Rs in Cr)
2472
1696 1801
1317
322 382 589
162
1980 1984 1988 1990 1992 1994 1998 2000 2004 2007 2008 2010 2012 2014 2016 2018
1980-1990 1990-2000 2000-2010 2010 - 2018
IMPORT SUBSTITUTION INDIA GROWTH PHASE EXPORT GROWTH PHASE GLOBAL ESTABLISHMENT
▪ Established credentials in surfactants/ ▪ Post Economic Liberalisation, market for ▪ Strategic shift with focus on Global ▪ Dominant Share in India
specialty ingredients space personal care products grew substantially markets expansion
▪ Increased Global Participations
▪ Due to high import duties, personal care ▪ Galaxy emerged as a strong player ▪ Made investments to acquire
▪ Supplier Recognitions (Global)
products were considered luxury goods ▪ Grew exponentially led by strong innovation manufacturing facilities at USA, Egypt
Galaxy was a strong supplier for import capabilities and established international offices ▪ Strong R&D Capability
substitution
▪ Focused on capturing the domestic market ▪ Increased share of revenue from ▪ Customer Partnership
▪ Developed a solid R&D base and large customer accounts international business
▪ Set up capacities to cater to the emerging Accepted as Global Vendor benchmarked
requirements with best International peers
13Our focus is Personal & Home Care Segment
Hair Care Oral Care Home Care
Shampoos Toothpaste Carpet Cleaner
Conditioners Tooth powder Toilet Cleaner
Colorants Mouth wash Detergents
Styling Gels Fabric Cleaner
Glass / Floor Cleaner
Mass Mass -tige Prestige Serving needs across Consumer Segments Mass Mass -tige Prestige
Skin Care Cosmetics
Sun care Nail Polish
Fairness Creams Lip Colors Toiletries
Moisturizing Creams Foundations Toilet Soaps / Body wash
Anti-ageing Creams Shaving Cream / Lotions
14… with over 200 Product Offerings
Anionic Surfactants FAES, FAS, LABSA ✓ Foam and Dirt removal properties
Performance
Surfactants
Non-Ionics Surfactants Ethoxylates ✓ Cosmetics and Personal care products as emulsifiers and solubilisers
Betaines ✓ Dermatological properties to reduces skin irritation
Amphoteric Surfactants
Quats ✓ Effective conditioning aids: substantively to hair and antimicrobial properties
Cationic Surfactants
Consumer Benefits
Sunscreen Agents ✓ Absorb or block the harmful radiation, Mild for the skin with Moisturizing
UV Filters (OMC, OCN &Others)
Speciality Care
Preservatives, Phenoxyethanol, Preservative Blends, ✓ Reduced toxicity & prevent spoilage
Products
Preservative Blends Surfactant Blends
✓ MS: Cleanse adequately without compromising basic function of skin
Mild Surfactants (MS) , Proteins and ✓ Protein: cosmetic industry for conditioning, protection and strengthening of
Speciality Ingredients Syndet & Transparent Bathing Bar hair/skin, anti-irritancy, moisturization etc
Flakes
Bifurcation is only for Fatty Alkanolamides (FA) and
Fatty Acid Easters (FAE) ✓ FA & FAE: Foam, viscosity boosters and pearlizer in a formulation
Investor community as
every product has
Conditioning Agents, Polyquats & ✓ Improves the quality of another material also called as moisturizers,
different functionality
Other Care Products Amine Oxides conditioning benefits to the hair etc
15Our Business Segments…
Performance Surfactants Speciality Care Products
“Substantive Raw Material in Customer’s End-products” “Unique Functionality to Customer’s End-products”
About Product
▪ Products are functional in nature where End- ▪ Niche & Premium products
consumer require foaming & cleansing
▪ Large volume consumption in all rinse-off ▪ Low volume consumption
formulations
▪ Oligopolistic for most products
▪ Products are Pulled by FMCG as it is required due to
impulse buying from end consumer
▪ Low penetration due to its unique application
No. of Products
45 products
155 + products
Revenue Mix
67 %
33 %
16Our Global Footprints
USA: TRI-K Industries-100% owned
Manufacturing ✓
Netherland
R&D ✓
USA
# Plants 1 TRI K Turkey
Industries
Global
# Employees 69 Headquarters
Egypt
Galaxy
Marketing office ✓ Chemical
(Egypt) S.A.E.
India
Egypt:100% owned*
Q1FY19:
Revenue Breakup Manufacturing ✓
India: Parent Entity
R&D
28% Manufacturing ✓
# Plants 1
40%
R&D ✓
# Employees 135
# Plants 6
32%
Marketing office # Employees 1,000+
Marketing office ✓
India AMET RoW
Presence in High Growth & Matured Markets
17“Consumer to Chemistry”: Creation of Products
51 approved Patents and 37 applied
Idea Stage
INDIA USA EUROPE ROW GLOBALLY
Feasibility Stage 21 6 3 7 37
R&D spend New product
49 Patents 37 Patent
of INR 45+ grades,
since 2002 application
Capability Stage pending Cr in 16-18 process,
efficiencies
2018
Products Added
210
2015 201
Market Ready Stage
190 2016
2012
178
129 2013
1980 109
Product in the Market
Innovation Funnel 3 2009
18…with World-class R&D facilities
Collaborative product development with Customers
which helps Customers in choosing “Right Technology
with Right Application”
Inhouse R&D Team of 63 professionals comprising of
doctorates, chemists and engineers
Well-Equipped R&D Centre, Pilot Plant at Tarapur,
Maharashtra; Product applications centre for proteins
at Denville, USA
Innovation Funnel (adopted in 2007) to consistently
diversify product offerings, meet customer needs and
consumer trends
19State-of-the-art Manufacturing Facilities
Location No. of Units Installed Capacity Details
✓ 1 pilot plant for scale up and commercialisation of new
Tarapur, Maharashtra 3 32,880 MTPA products rolling out from R&D activities
✓ Easy access to the Jawaharlal Nehru Port Trust, Navi Mumbai
✓ One of the largest sulfation facilities in India
Taloja, Maharashtra 1 159,000 MTPA ✓ Easy access to the Jawaharlal Nehru Port Trust, Navi Mumbai
Jhagadia, Gujarat* 1 79,500 MTPA ✓ Located close to raw material source ethylene oxide
✓ Located in the Attaqa Public Free Zone, exempt from all
Suez, Egypt* 1 91,500 MTPA direct and indirect taxes
✓ Access to the Suez Canal, can address AMET, Europe and
Americas (North and South) markets
✓ Step-down Subsidiary - Tri-K Industries owns and operates for
New Hampshire, USA 1 600 MTPA different grades of proteins for cosmetic applications
*Environmental clearances for expansion and additional land available at Jhagadia and Suez plants
201750+ Clients across 75+ Countries
& Many more…
Long term strategic relationship with all of the top 10 customers
Strict qualifications and extensive collaboration with customers for end-product development
Of basket of 200+ products,
FY18: Revenue Contribution All FMCG Protocols
Through Innovation funnel, clients has various Galaxy has created Integrated
MNC Customers: 55% accomplished by us which
Demonstrated Engineering & requirement with different Value chain for long lasting
Regional Players: 8% helped to create Decade old
Technical excellence quantity with different pricing relationship
Local & Niche Player: 37% partners
mechanism
21Awards & Certifications: True recognition of Capabilities
“Best Supply Partner”, 2015 2018
“Winning through Award of Global Performance” for Long Standing Partner Award
Recognition from
Innovation” at the Partner L’Oréal Asia Pacific 2012 Best Reliable Partner Award
to Win, 2012 Awards “Certificate of Appreciation”, 2008 Best Value Addition Award
Clients
“Certificate of
Excellence in
“Innovation Award” for
Samyut”, 2017 Certificate of Appreciation
Green Catalyst and “Certificate of Recognition”,
Sustainability at the Partner 2014 For valuable association as a
to Win, 2014 Awards Business Partner
“Gold Award”, Castor Oil and
Innovation Zone
Specialty Chemicals Panel for
export performance in large
scale sector for the years
2011-2012, 2012-2013 and
Received Gold Medal for 2015-2016. Trishul Award in
Iconic Company EcoVadis Responsible
“Galsoft GLI21”, Organized 2017 for the outstanding Various ISO
Indian HPC Industry Certification Galaxy Group Care, India
by HPCI, ISCC and SOFW export performance
Association
Certifications
“Silver Medal” in India Green “Certificate of Merit 2008 –
“Certificate of Appreciation” in occupational “Special Award for TPM
“Great Place to Work” for Manufacturing Challenge 2016 Manufacturing Category” in the IMC
safety & health by National Safety Council of Achievement”, 2008
the Fiscal 2017-2018 for Jhagadia unit Ramkrishna Bajaj National Quality
India for Taloja Plant, 2011
Award 2008“
22Management Team on Board
Mr. Unnathan Shekhar
Promoter, Managing Director
•Associated with Company since 1986
•Chemical Engineer, PGDM from IIM, Calcutta
Mr. Natarajan K. Krishnan Mr. Kasargod Ganesh Kamath
Executive Director, Chief Operating Officer Executive Director (Finance), Chief Financial
Officer
•Associated with Company since 1993
•CWA, Advanced Management Program from Harvard •Associated with Company since 2004
Business School •Qualified CS, CWA and LL.B, over 20 years of
experience
Dr. Nirmal Koshti Mr. Vaijanath Kulkarni
Non-Executive Director Non-Executive Director
•Associated with Company since 1986 •Associated with Company since 1995
•Ph. D. in Organic Chemistry (University of Bombay); •Chemical Engineer
Extensive post-doctoral research experience •Currently, MD of Galaxy Chemicals (Egypt) S.A.E
23Along with Guidance of Senior Board Members
Mr. Shekhar Ravindranath Warriar
Chairman, Non-Executive Independent Director
•Associated with Company since 2007
•More than 30 years with Unilever, India in various capacities
Mr. Subodh S. Nadkarni
Mr. Gopalkrishnan Ramakrishnan Mr. Shashikant R. Shanbhag Non-Executive Independent
Promoter, Non-Executive Director Promoter, Non-Executive Director Director
•Associated with Company since 1986 •Associated with Company since •Associated with Company since
•Qualified CA and CS 1986 2002, 30 years+ experience
• Qualified CA •Qualified CA and CS, prior
associations with Godrej and Sulzer
Mr. Uday Kamat Mr. Melarkode G. Parameswaran Ms. Nandita Gurjar
Non-Executive Additional Director Non-Executive Independent Non-Executive Independent
Director Director
•Associated with Company for 15+
years •Associated with Company since 2005 •Associated with Company since 2015
•Qualified CA and Cost Accountant, •Chemical Engineer from IIT Madras; •Over 20 years of experience in the
(ICWA) PGDM from IIM Calcutta; PhD from field of IT and Human Resource
Mumbai University
24The 4 Cs: Our Core Strength
CHARACTER COMPETITIVENESS
Transparent & Open, Respect & Adhering to Global Quality
Value People, Dreaming & Standards, Supplying
Envisioning , Conducting Customers Globally, Agile &
Business with Integrity Nimble Footedness
COMPETENCE COMFORT
Respecting our Commitments,
Talented Team which Consistent Performance over
proactively meets Complex the years of Timely Delivery &
& Changing Business Needs Quality Consistency
25High Growth Industry
26Personal & Home Care: Stable & Non-Cyclical Industry
Personal Care and Household Personal Care and Household
Cosmetics Market Cleaning Market Cosmetics Market Cleaning Market
2015 215 43 11 2
2024 358 58 23 4
5.8% 3.3% 7.9% 7.2%
CAGR CAGR CAGR CAGR
Galaxy has a strong presence in High Growth Markets of India and AMET Regions
All figures in USD billion Source: Company IPO Prospectus 27Within Surfactants – Personal Care is fastest Growing Segment
Surfactants Personal Care Surfactants Personal Care
Market Surfactants Market Market Surfactants Market
2015 30.65 6.13 1.34 0.24
2024 45.16 10.27 2.28 0.47
4.4% 5.9% 6.1% 7.8%
CAGR CAGR CAGR CAGR
All figures in USD billion Source: Company IPO Prospectus 28Within Specialty – Personal Care Ingredients has largest Growth Potential
Global Personal Care Ingredients:
USD 14-18 billion
UV Absorbers ▪ Global sun care (of which 80% is sun protection) is a USD 11 bn
Sunscreen market and is estimated to touch USD 12.3 bn by 2021
35%
40%
▪ Preservatives blends are special customized formulations of
Preservatives & preservatives. The preservative blends market was values at
Preservative Blends USD 133.5mn in 2017 and is expected to grow at a CAGR of 6%
25% to USD 210 mn by 2024
Differentiated SCIs Commodities Fine Chemicals
~15-20% Market Share Mild Surfactants
▪ Surfactants milder than Traditional Agents are known as Mild
Surfactants. These have been shown to cleanse adequately
in without compromising the skins basic function
Global HPC Phenoxyethanol
Market
All figures in USD billion Source: Company IPO Prospectus and Transparency Market Research 29Growth Strategy
30Personal & Home Care: High Entry Barrier Businesses
Process Product Customers
Chemical Engineering & inhouse project Wide spectrum of ingredients for Customer Centric Integrated solutions for
execution Consumer categories / needs the HPC FMCG Industry
Meeting pre-qualifications of the Product
Quality Systems Superior Quality & Customised Products Stringent quality benchmarks and
certification
Consumer preferences & trend Direct Customer engagement with +1700
Innovation & Consumer Benefit covering R&D and manufacturing
31Our Growth Vision
Sales R&D and Customer
Market Strategy Profitability
Optimization Innovation Wallet share
Improve Financial
Increased focus on Continue to focus Increase Wallet Mutually
Performance
high margin on R&D and Share with Existing Complimentary
through Sales
products in both Product Innovation Customers and Two-pronged
Optimization,
the categories as a part of Continued Focus to Strategy to drive
Operational
“Consumer to Expand Customer growth in both
Efficiencies &
Chemistry Base Emerging and
Functional
Approach” Matured Market
Excellence
32Capacities offers Headroom for Growth
Capacity & Utilisation* (%) Sales Volumes (MTPA) Revenue (Rs. In Crs)
Performance surfactants
69% 63% 60% 73%
+10% +10%
130,596 1,553
115,392 1,405
242,600 251,000
209,800 97,211 98,775 1,181 1,117
202,800
FY15 FY16 FY17 FY18 FY15 FY16 FY17 FY18 FY15 FY16 FY17 FY18
Specialty care Products
60% 64% 58% 58%
+6%
+5%
62,087 66,833 756 813
112,480 56,163 59,718 693 685
108,260
90,760 92,380
FY15 FY16 FY17 FY18 FY15 FY16 FY17 FY18 FY15 FY16 FY17 FY18
*Utilization include manufacturing for Captive consumption 33Financial Performance
34Managing Volatility in Raw Material Prices and Currency...
Fatty Alcohol Prices (USD / MT) INR / USD Prices
3000 72
2500 69
2,431
66.3
1,981 64.83
2000 66
1,855 64.8
1,694 63
1500 64.9
1000 60
FY17 FY18 FY 17 FY 18
… through Robust Risk Management Practices
Source: Market Prices – ICIS – LOR Source: RBI 35Our Performance Highlights
Revenue^ (Rs. In Crs) EBITDA (Rs. In Crs) PAT (Rs. In Crs)
+9% +16% +32%
2,444 282 298 158
2,172 148
1,875 1,807 238
192 101
68
FY15 FY16 FY17* FY18* FY15 FY16 FY17* FY18* FY15 FY16 FY17* FY18*
EBITDA per tonne
Total Volume Growth
+6%
+9%
15,017 15,889 15,094 197,429
177,479
12,518 153,374 158,492
FY15 FY16 FY17* FY18* FY15 FY16 FY17* FY18*
*As per Ind AS rest as per Indian GAAP ^Includes other Income 36Our Balance Sheet Strength
Debt/ Equity (x) Return on Equity (%)
1.1 28.8%
0.9 25.2% 24.4%
20.4%
0.7
0.5
FY15 FY16 FY17* FY18* FY15 FY16 FY17* FY18*
Cash Flow from Operating Activities Return on Capital Employed (%)
170
25.2% 23.9%
144 22.6%
111 18.6%
41
FY15 FY16 FY17* FY18* FY15 FY16 FY17* FY18*
*As per Ind AS rest as per Indian GAAP 37Consolidated Profit & Loss Statement
Particulars (Rs in Cr) FY18 FY17 Y-o-Y
Net Revenue from Operations 2,433.9 2,161.3
Other Income 10.1 10.4 ▪ Average Forex rates in
Total Revenue 2,444.0 2,171.8 12.5% FY18 were Rs. 64.4 per
USD versus Rs 67.0 per
Cost of Material Consumed 1,751.1 1,526.0
USD in FY17
Employee's Benefits Expense 146.0 141.6
Other Expenses 249.1 222.4 ▪ The forex movement
EBITDA 297.8 281.8 5.7% has adversely affected
EBITDA by Rs. 8.5 Cr in
EBITDA Margin 12.2% 13.0%
FY18 versus FY17
Depreciation 48.5 47.2
EBIT 249.3 234.6 6.3% ▪ Adverse impact of
Finance cost 30.6 27.2 Local Body Taxes on
the EBITDA to the tune
PBT 218.8 207.4 5.5%
of Rs. 3.2 Cr in FY18
Tax expense 60.7 59.8 versus FY17
PAT 158.0 147.6 7.0%
PAT Margin 6.5% 6.8%
EPS 44.6 41.6 7.0%
As per Ind AS 38Consolidated Balance Sheet
Particulars (Rs. In Crores) March’18 March’17 Particulars (Rs. In Crores) March’18 March’17
ASSETS EQUITY AND LIABILITIES
Property, Plant and Equipment 439.9 447.2 EQUITY 718.8 574.9
Capital work-in-progress 24.9 10.3 Equity Share Capital 35.5 35.5
Goodwill 2.4 2.4 Other Equity 683.3 539.5
Intangible Assets 4.5 6.3
Financial Assets
(i) Investments 0.1 0.1 Non-Current Liabilities 107.2 163.2
(ii) Loans 0.2 1.5 Financial Liabilities
(i) Borrowings 72.2 128.5
(ii) Other financial assets 6.5 6.9
(ii) Other Financial Liabilities 0.3 0.2
Deferred Tax Assets (Net) 3.4 4.3 Provisions 6.1 8.8
Income Tax Assets (Net) 10.5 12.2
Deferred Tax Liabilities (Net) 27.7 25.3
Non-current tax assets 44.0 39.6
Other non-current liabilities 0.9 0.5
Current Liabilities 629.4 549.1
Current Assets 918.9 756.4 Financial Liabilities
Inventories 345.6 317.4 (i) Borrowings 219.7 204.8
Financial Assets
(ii) Trade Payables 327.8 252.3
(i) Trade receivables 418.2 347.2
(ii) Cash and cash equivalents 27.1 25.7 (iii) Other Financial Liabilities 60.0 64.4
(iii) Bank Balances other than cash and cash equivalents 0.5 0.4 Other Current Liabilities 17.8 22.5
(iv) Loans 0.3 0.3 Provisions 4.1 2.2
Current Tax Liabilities (Net) 0.1 2.9
(v) Other Financial Assets 9.0 3.1
Other Current Assets 118.1 62.3
TOTAL 1,455.4 1,287.2 TOTAL 1,455.4 1,287.2
As per Ind AS 39Successful Listing on the Stock Exchanges
February 2018
▪ Listing of Galaxy Surfactants Limited
▪ IPO subscribed: 19.76X
▪ FY18 Revenue: Rs 2,444.0 Cr
▪ FY18 EBITDA Margin: 12.2%
▪ FY18 PAT Margin: 6.5%
Galaxy Surfactants Listing done at Valuation of ~Rs. 5,200 Cr on 8th February 2018
As per Ind AS 40Thank Company : Investor Relations Advisors :
You
CIN No: U39877MH1986PLC039877 CIN - U74140MH2010PTC204285
Mr. Paritosh Srivastava Mr. Rahul Agarwal / Ms. Shrikant Sangani
Email: Paritosh.Srivastava@galaxysurfactants.com rahul.agarwal@sgapl.net /
shrikant.sangani@sgapl.net
www.galaxysurfactants.com +91 7977090416 / +91 9619595686
www.sgapl.net
41You can also read