FIBRA Macquarie México - Investor Presentation June 2017 - Investor Relations | FIBRA ...
←
→
Page content transcription
If your browser does not render page correctly, please read the page content below
FIBRA Macquarie México
       Investor Presentation
                   June 2017

                               1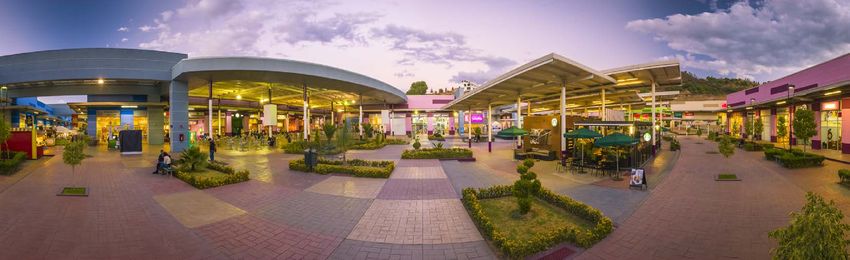
Important Information
This document has been prepared by Macquarie México Real Estate Management, S.A. de C.V.                 complete. The information in this document is presented as of its date. It does not reflect any
(“MMREM”), as manager, acting in the name and on behalf of Deutsche Bank México, S.A.,                   facts, events or circumstances that may have arisen after that date. We do not undertake any
Institución de Banca Múltiple, División Fiduciaria (“Deutsche Bank”), as trustee, of FIBRA               obligation to update this document or correct any inaccuracies or omissions in it. Any financial
Macquarie México (“FIBRA Macquarie”).                                                                    projections have been prepared and set out for illustrative purposes only and do not in any
                                                                                                         manner constitute a forecast. They may be affected by future changes in economic and other
As used herein, the name "Macquarie" or "Macquarie Group" refers to Macquarie Group Limited
                                                                                                         circumstances and you should not place undo reliance on any such projections.
and its worldwide subsidiaries, affiliates and the funds that they manage. Unless otherwise noted,
references to “we” “us”, “our” and similar expressions are to MMREM, as manager, acting in the           Recipients of this document should neither treat nor rely on the contents of this document as
name and on behalf of Deutsche Bank, as trustee, of FIBRA Macquarie.                                     advice relating to legal, taxation or investment matters and are advised to consult their own
                                                                                                         professional advisers.
This document does not constitute an offer to sell or a solicitation of an offer to buy any securities
in the United States, and securities may not be offered or sold in the United States absent              No member of the Macquarie Group accepts any liability whatsoever for a direct, indirect,
registration or an exemption from registration under the U.S. Securities Act of 1933, as amended.        consequential or other loss arising from any use of this document and/or further communication
This document is an outline of matters for discussion only and no representations or warranties          in relation to this document.
are given or implied. This document does not contain all the information necessary to fully
                                                                                                         Any discussion in this document of past or proposed investment opportunities should not be
evaluate any transaction or investment, and you should not rely on the contents of this document.
                                                                                                         relied upon as any indication of future deal flow.
Any investment decision should be made based solely upon appropriate due diligence and, if
applicable, upon receipt and careful review of any offering memorandum or prospectus.                    None of the entities noted in this document is an authorized deposit-taking institution for the
                                                                                                         purposes of Banking Act 1959 (Commonwealth of Australia).The obligations of these entities do
This document includes forward-looking statements that represent our opinions, expectations,
                                                                                                         not represent deposits or other liabilities of Macquarie Bank Limited ABN 46 008 583 542
beliefs, intentions, estimates or strategies regarding the future, which may not be realized. These
                                                                                                         (“MBL”). MBL does not guarantee or otherwise provide assurance in respect of the obligations of
statements may be identified by the use of words like “anticipate,” “believe,” “estimate,” “expect,”
                                                                                                         these entities.
“intend,” “may,” “plan,” “will,” “should,” “seek,” and similar expressions. The forward-looking
statements reflect our views and assumptions with respect to future events as of the date of this        Qualitative statements regarding political, regulatory, market and economic environments and
document and are subject to risks and uncertainties                                                      opportunities are based on MIRA’s opinion, belief and judgment. Such statements do not reflect
                                                                                                         or constitute legal advice or conclusions. Investment highlights reflect MIRA’s subjective
Actual and future results and trends could differ materially from those described by such
                                                                                                         judgment of the primary features that may make investment in the relevant sector attractive.
statements due to various factors, including those beyond our ability to control or predict. Given
                                                                                                         They do not represent an exclusive list of features, and are inherently based on MIRA’s opinion
these uncertainties, you should not place undue reliance on the forward-looking statements. We
                                                                                                         and belief based on its own analysis of selected market and economic data and its experience in
do not undertake any obligation to update or revise any forward-looking statements, whether as a
                                                                                                         Mexico.
result of new information, future events or otherwise.
                                                                                                         The growth opportunities described herein are not necessarily reflective of all potential
No risk control mitigant is failsafe. Notwithstanding the mitigants described herein, losses may
                                                                                                         investments, which may have significantly different prospects and other terms and conditions. No
occur as a result of identified or unidentified risks. Past performance is no indication of future
                                                                                                         assurance can be given that any such growth opportunities will be pursued by FIBRA Macquarie.
performance.
                                                                                                         This document is not for release in any member state of the European Economic Area.
Certain information in this document identified by footnotes has been obtained from sources that
we consider to be reliable and is based on present circumstances, market conditions and beliefs.         Unless otherwise stated all information presented here in is as of March 31, 2017.
We have not independently verified this information and cannot assure you that it is accurate or

                                                                                                                                                                                                            2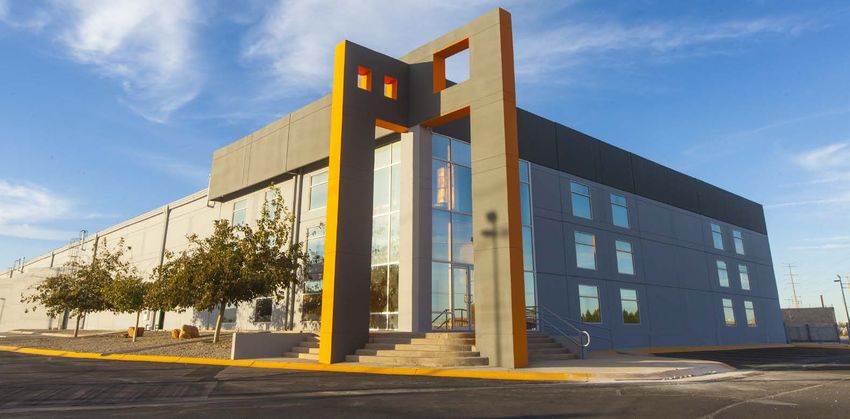
FIBRA Macquarie, a premier owner of Mexican industrial and
retail real estate, has provided consistently strong operational
  and financial performance by putting its customers first. Its
 institutional management expertise and best in class internal
   property management platform drives value by unlocking
                      growth opportunities.

                                                                   3
Demonstrated Growth Since IPO

  Disciplined approach to capital deployment                                                              Delivering solid financial results
  ensures high-quality portfolio

  Gross Leasable Area (“GLA”) growth: + 38.4%                                                             CAGR since IPO (December 2012)

                                                                     455                  3,433
                                                                                                                                                                              27.7%
                                                                                         455                                     26.1%                       25.1%
                                                   498                                   13%

                                                                                         2,978
                               2,480
                                                                                          87%

                                                                                                                                                                     12.6%
   ’000   m2                                               Oct ’13                                                11.2%                         10.3%

                            Inception        Industrial2,3           Retail             Total

 Properties                     243                32                  17                292

 Capital deployed
                             1,420m              323m                489m              2.2bn                       US$             Ps.           US$         Ps.      US$      Ps.
 (US$)1
                                                                                                                        Revenue                   Net Operating        Funds from
 Weighted Average Cap Rate for Acquisitions                                             8.4%
                                                                                                                                                 Income (“NOI”)        Operations
                                                                                                                                                                        (“FFO”)
                  Industrial GLA                  Retail GLA                   Other

  1 Excludes any earn-out payments; 2 Including dispositions; 3 Organic growth using existing land on currently owned properties net of adjustments to GLA

                                                                                                                                                                                      4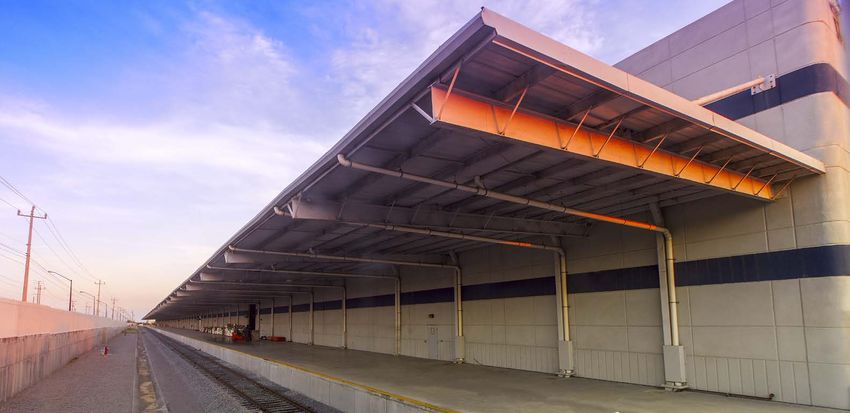
The FIBRA Macquarie Opportunity
  1.   High Quality Portfolio in Prime Industrial and Consumer Markets

  2.   Scalable Internal Property Administration Platform

  3. Strong Track Record of Disciplined Capital Deployment
  4. Consistently Strong Operational and Financial Performance

  5. Repositioned Balance Sheet and Strong Cash Flow
  6.   Experienced Management Supported by Quality Institutional Platform

Ciudad Juárez                       Monterrey                               Reynosa

                                                                                      5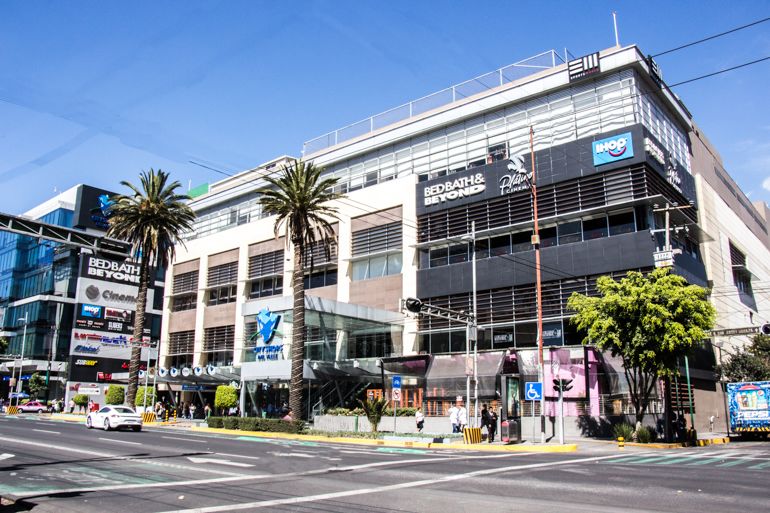
Ciudad Juárez 1
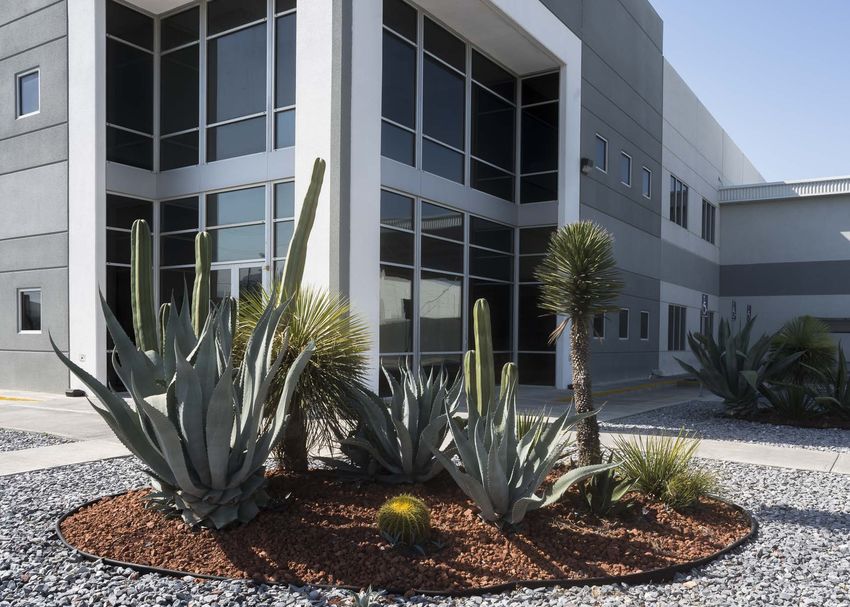
High Quality Portfolio in Prime Industrial and Consumer Markets
6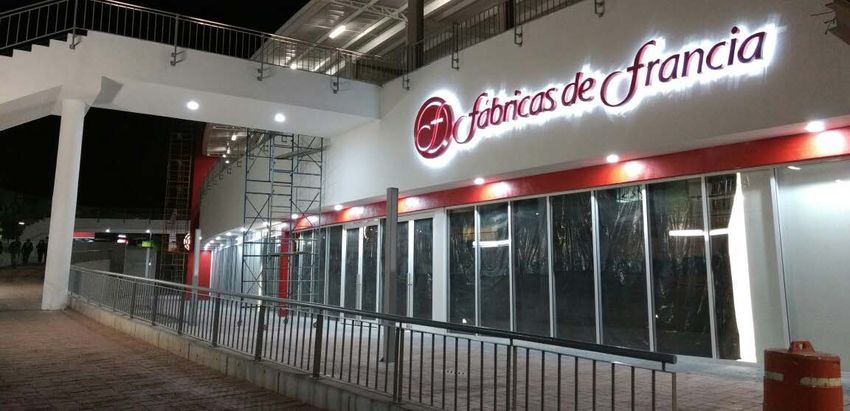
High Quality Portfolio in Prime Industrial and Consumer Markets
                                                           Mexicali                        Ciudad
                                                                                           Juárez2
     76.5%1 of rents are                                  14 / 3.1%
                                                                                         43 / 12.7%                        Nuevo
                                                                                                                           Laredo
     US $ denominated                       Tijuana                        Nogales
                                                                           2 / 2.7%
                                                                                                    Chihuahua             9 / 3.0%
                                           30 / 6.7%
                                                                                                     18 / 4.6%
                                                                                                                   Saltillo
                                                                                                                 11 / 3.6%
 Diversified Portfolio                       Hermosillo
 •    Owning both Industrial and Retail       11 / 4.8%                                                                                 Monterrey
                                                                                                                                        39 / 16.2%
      assets provides greater growth
      opportunity; NOI is 83% industrial                                                                                                                           Reynosa
                                                                                                                                                                  29 / 8.8%
      and 17% retail                              Los Mochis
                                                       1 / 0.6%                                                                                    Matamoros
                                                                                                                                                    10 / 3.6%                     Cancún
 Local Expertise                                                  La Paz                                                                                                          2 / 1.0%
                                                                1 / 0.2%                                                                Querétaro
 • [Need
      Expanded      network of local real
         % of NOI from these markets]
                                                                                   Durango                                              11 / 5.1%
                                                                                   1 / 0.6%
      estate professionals with extensive                                                                                                          Puebla
                                                                                Guadalajara                                                       23 / 5.1%
      market knowledge                                                           9 / 2.9%

                                                                Industrial                                                                                                   Villahermosa
 Key Market Presence                                                                                                                                                            1 / 0.5%
                                                                                                                 Irapuato
 •    Industrial assets in strategic                            Combined                           San Luis       1 / 0.4%
                                                                                                    Potosí
                                                                                                                                           Tuxtepec
      manufacturing markets and retail                          Retail                             7 / 2.1%                MCMA3            2 / 1.0%
                                                                                                                          17 / 10.7%
      assets in high density urban areas

                                                      1. Results for the nine retail properties held through a 50/50 joint venture with Grupo Frisa are shown on a proportionally combined
                                                      basis. 2. Includes one property in Ascensión, Chihuahua. 3. Mexico City Metropolitan Area (MCMA).
                                                      Note: Map Includes nine retail joint venture properties.

01                                                                                        High Quality Portfolio in Prime Industrial and Consumer Markets / 7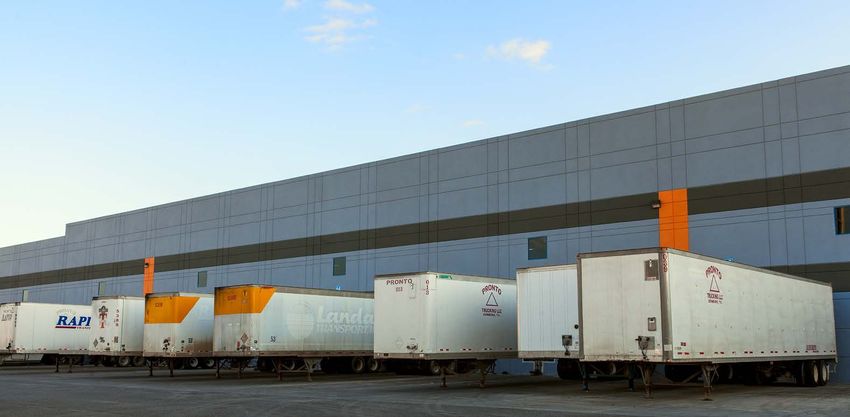
Strong Demand for Industrial Real Estate in Mexico

  Growing automotive industry                                                               Highly competitive labor force
  Vehicle production in Mexico (million units)                                              Mexico Manufacturing Wages vs. China
  4.50                                                                             50.0%     4.0
                                   Million Units      y/y Growth         4.12
  4.00                                                                             40.0%     3.0
                                                   3.40         3.47
  3.50                                   3.22                                      30.0%     2.0
                           2.93                                         18.8%
            2.88
  3.00                                                                             20.0%     1.0
            12.8%                        9.8%
  2.50                                             5.6%                            10.0%     0.0
                       1.7%                                     2.0%                               2000           2003          2006     2009          2012              2015
  2.00                                                                             0.0%
            2012       2013              2014      2015         2016    2017F                      CHINA                 MEXICO
     Source: AMIA / 2017F-IHS                                                               Source: ILO/SHCP/INEGI/BCG

  Industrial real estate availability in our                                                …while rental rates are increasing
  key markets is mainly decreasing…
 8.0%      7.0%                                                                            4.60                                                 4.47
 7.0%               6.1%                                                                   4.40
                                           5.8%                        5.6%     5.5%
 6.0%                                                                                                                                    4.20                        4.19
                                                    4.4%                                   4.20               4.10
 5.0%                                                                                                4.00                         4.00                        4.02
 4.0%                             3.5%                                                     4.00
                                                               3.1%                                                      3.86
 3.0%
                                                                                           3.80
 2.0%
 1.0%                                                                                      3.60
 0.0%                                                                                      3.40
              North                   Bajio               Central         Total                           North             Bajio          Central               Total

         2015 EOP                 2016 EOP                                                         2015 EOP              2016 EOP

     Source: Jones Lang LaSalle                                                             Source: Jones Lang LaSalle

01                                                                                         High Quality Portfolio in Prime Industrial and Consumer Markets / 8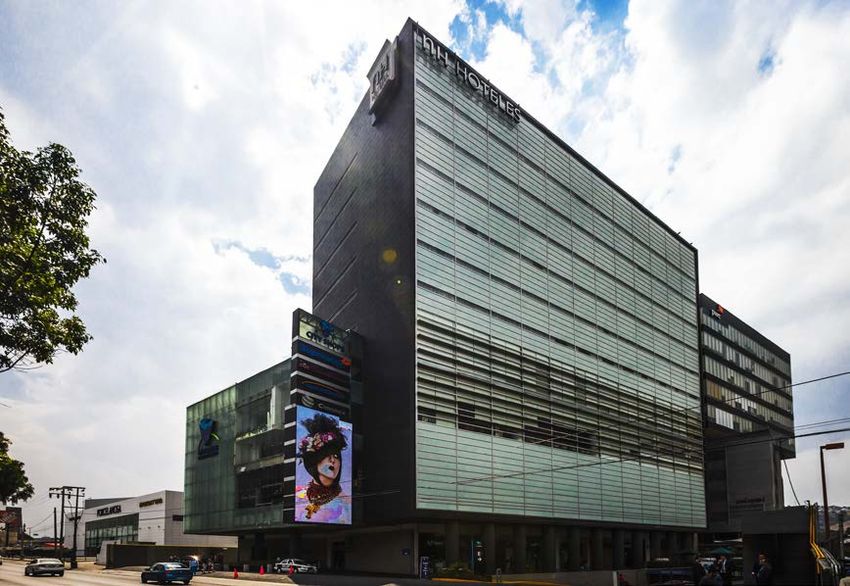
Industrial Portfolio

                                                    Well positioned
                                                    to support Mexico’s manufacturing
                                                    and global export business

                                                 North     Bajio        Central           Other            Total
     Number of Buildings                            218         26              30               1            275
     Number of Customers                            289         32              62               2            385
     Square Meters GLA '000s                     2,412.1    334.6           213.0            17.9        2,977.5
     Occupancy                                    91.5%    93.1%           99.5%         100.0%            92.3%
     % Annualized Base Rent (“ABR“)               80.3%    10.5%            8.5%            0.7%         100.0%

     % of ABR in USD$                             95.6%    72.8%           85.6%         100.0%            92.4%
     Avg. Monthly US$ Rent
                                                  $4.55     $4.21           $4.99           $5.21          $4.55
     per Leased sqm1 EOQ
       1. FX rate:18.8092 as of March 31, 2017

01                                                         High Quality Portfolio in Prime Industrial and Consumer Markets / 9
Reynosa

Select Industrial Properties

Monterrey                      Reynosa

01                             High Quality Portfolio in Prime Industrial and Consumer Markets / 10
Industrial Portfolio Strengths

Ciudad Juárez                                     Reynosa

74.0% of annualized base rents from light-        Customer focused internal property
manufacturing which typically have high           management platform, located close to
switching costs                                   customers and able to respond quickly to their
                                                  needs

92.4% of rents denominated in US$ - this has      Local team of real estate professionals with
been stable since IPO despite significant US$     market expertise provides competitive
appreciation and are subject to annual increase   advantage

01                                                    High Quality Portfolio in Prime Industrial and Consumer Markets / 11
Diverse, High Quality Customers from Key Growth Industries
Domestic and international customers with favorable long-term dynamics
Across All Major Markets in Mexico Percent of Annualized Base Rent
GLA (“ABR”) From Key Industries
Non Core Markets 2.5% Other 9%
Packaging
Central Markets 7.2% 4%
Medical 6% Automotive 41%
Bajio Markets
11.2%
Border Logistics
Markets 10%
46.6%
Northern Markets Electronics
32.5% 13%
Consumer
Goods 18%
Top 10 industrial customers represent approximately 26% of industrial portfolio’s annualized
base rent and have a weighted average lease term of 4.0 years
Opportunity to further diversify in other industries such as aerospace, medical devices and logistics
01 High Quality Portfolio in Prime Industrial and Consumer Markets / 12Industrial Sector Growth Drivers
Emerging industries gaining traction: e-commerce-driven
distribution/logistics, medical device, and aerospace manufacturing
Highlights Mexico e-commerce revenue (US$bn)
Logistics and distribution growth driven by increasing e- 16.0 16%
2016-2021 CAGR 13.4
14.9
14.0
commerce and growing middle-class 12.0 10.1
11.7
10.0 8.5
Medical device industry forming clusters in Northern 8.0 7.2
5.9
markets such as Ciudad Juárez 6.0
4.0
More than 300 aerospace companies already have a 2.0
presence in Mexico (80% manufacturing / 20% services) 0.0
2015A 2016E 2017E 2018E 2019E 2020E 2021E
Mexico medical device output (US$bn) Aerospace exports (US$bn)
30.0 6.3% 14.0
25.6 14.0% 12.0
2015-2020 CAGR 12.0
25.0 2016-2021 CAGR
18.9 10.0
20.0
8.0 6.2
15.0
6.0
10.0 4.0
5.0 2.0
0.0 0.0
2015A 2020E 2016E 2021E
Source: Statista, Ministry of Economy 2015/2016
01 High Quality Portfolio in Prime Industrial and Consumer Markets / 13Strong Market Fundamentals Support Industrial Demand
Positive Mexican Market Fundamentals Help Deliver Solid Leasing Results
Strong Demand for Industrial Space1 FIBRA Macquarie’s Performance
• Average net absorption of 2.5 million sqft LTM • 96 new & renewed leases LTM
Mexico City: 790,010 sqft • 1Q 2017 Occupancy EOP 92.3%
Monterrey: 458,379 sqft • Expansions and new development properties
Tijuana: 225,203 sqft underway
Querétaro: 196,860 sqft • 10.6% of leases rolling in the remainder of
Juárez: 168,754 sqft 2017
• Average 4 months to exhaust new supply • 92.9% of industrial leases are triple net
1. Source: Datoz as of March 31, 2017
Reynosa
01 High Quality Portfolio in Prime Industrial and Consumer Markets / 14Solid Leasing Volume and Manageable Expiration Profile: Industrial
Industrial Leasing Activity Manageable Lease Expirations Profile
sqft in thousands Percentage of ABR
220
1,886
8.6
7.1 1,526
23.4%
21.4%
754
1,096 16.0%
13.4% 13.1%
10.6%
13.9
859 785 733
301
340
101 2.0%
1Q16 2Q16 3Q16 4Q16 1Q17
In Reg 2017 2018 2019 2020 2021 2022+
Q2+
New Leases Renewals Expansions
01 High Quality Portfolio in Prime Industrial and Consumer Markets / 15Coacalco Power Center, MCMA
Select Retail Properties
City Shops Valle Dorado, MCMA City Shops del Valle, MCMA
01 High Quality Portfolio in Prime Industrial and Consumer Markets / 16Well Positioned Retail Portfolio
A Diversified Mix of High Quality Customers
City Shops del Valle, MCMA
Top 10 retail customers represent approximately 46% of the retail portfolio’s annualized
base rent and have a remaining weighted average lease term of 7.1 years
01 High Quality Portfolio in Prime Industrial and Consumer Markets / 17Well-positioned Retail Portfolio
Attractive Demographics in Mexico1 Shopping centers with necessity-based tenants
located primarily in top markets in Mexico2
• Population of 119.5m with a high concentration in • 87.0% of Retail assets located in top 3 retail
the ages entering the workforce markets in Mexico (MCMA, Guadalajara and
• Average age 27.0 years vs world´s average age Monterrey)
of 30.1 years • 100% of FIBRA Macquarie’s shopping centers
• Estimated annual population growth of 1.4% anchored by major brand retailer
• Per ANTAD, total sales to increase 6.5% in 2017 • Defensively positioned by being focused in major
metro areas and anchored by necessity-based
type tenants
48.6% 51.4%
Years
85+ Community
75-79 Shopping 18%
70-74
65-69
Urban Infill 30%
60-64
55-59
50-54
45-49
40-44 Mixed Use 13%
35-39
30-34
25-29
20-24
15-19
10-14
5-9 Office 18%
0-4 Power Center
6 4 2 0 2 4 6% 21%
1. Source from INEGI estimations of 2015 population 2. % of annualized base rent
01 High Quality Portfolio in Prime Industrial and Consumer Markets / 18Solid Leasing Volume and Manageable Expiration Profile: Retail
Retail Leasing Activity Upcoming Expirations
sqm in thousands Percentage of ABR
83.5%
11.4
47.2%
32.2%
3.2
19.0%
2.5
3.8 14.7% 14.9%
4.0 11.5%
3.2 5.6 10.4%
0.4 8.7% 9.2% 5.3% 8.6% 7.2%
4.2 6.1% 4.8%
2.7 3.6% 4.5% 5.1%
1.9 1.4 1.5 3.7%
4Q15 1Q16 2Q16 3Q16 4Q16 1Q17 In 2017 2018 2019 2020 2021 2022+
regularization Q2+
New Leases Renewals Expansions Anchor Total ABR Non Anchor
01 High Quality Portfolio in Prime Industrial and Consumer Markets / 19Reynosa
2
Scalable Internal Property Administration Platform
20Scalable Internal Property Administration Platform
Internally managing
Customer Market 275 industrial properties in 21
Full Service markets
Focused Expertise
Full service capability: Provides direct Local professionals with
property management, relationship with 380+ deep knowledge and
leasing, engineering, customers enabling us relationships
health and safety, to deliver high-quality
accounting and IT customer service
Cost Growth
Efficient Scalable Identifications
Have materially reduced Scalable platform Works with existing
operating costs since with the capacity to customers to provide
implementation integrate additional expansion, redevelopment
properties and build-to-suit solutions
to cater for growth needs
Internal property administration platform provides an advantage in terms of costs,
scalability and ability to better service customers
02 Scalable Property Administration Platform / 21Ciudad Juárez
3
Strong Track Record of Disciplined Capital Deployment
22Fragmented Market Provides Growth Opportunities
Significant Opportunity Strong Track Record
US$80BValue of institutional
US$2.2B
quality real estate of capital deployed
since inception
for rent in Mexico
77% ~39.6% 8.4% ~$50M
Of real estate in Of private real Weighted Average Capital deployed &
Mexico is still estate is Industrial commited in respect of
Cap Rate expansions
privately held
Expertise and assets in two segments Disciplined capital deployment
allows for greater growth opportunities at attractive cap rates
Source: Company estimates
03 Strong Track Record of Disciplined Capital Deployment / 23Vertically Integrated Platform to Drive Organic and External Growth
Proactive Asset Management
• Prudent investment in existing properties
Maximize Rents
• Superior customer service from industrial administration platform
Organic Increase Retention
• Control operating expenses
Increase Occupancy • Maintain our properties with high quality standards
Solid Pipeline of Opportunities
• Well-established relationships provide ongoing pipeline
• Broad investment universe allowing for selective deployment of capital
• Industrial: Well-located manufacturing and distribution buildings
Acquisition
in key markets that complement portfolio
External
• Retail: Focus on properties in growing markets with favorable
& demographics and traffic
Expansion
Expansions • Opportunistic expansions at existing properties to address customer needs
Development • Selective development opportunities, with managed risk profile
03 Strong Track Record of Disciplined Capital Deployment / 24Proactive Asset Management
Nogales
Expansion of Belden de
• Manufacturer of signal transmission Sonora’s facility In
1. solutions in communications technology Nogales, Sonora
Case Study • Existing FIBRA Macquarie customer
Belden de leasing 392k sqft building in Nogales
Sonora
• Nogales operation reached full capacity
• FIBRA Macquarie proposed expanding
Significant expansion the building to satisfy growing space
for Belden de Sonora requirements and retain tenant
demonstrates proactive • Key outcomes:
approach to asset Building increased by more than
50% of GLA from 392k sqft to 607k
management and sqft
customer service Lease extended beyond original
expiration date Nogales
Source: Google Maps
03 Strong Track Record of Disciplined Capital Deployment / 25Proactive Asset Management
• Fábricas de Francia, a Liverpool brand,
wanted to establish a presence in
Tecamac and Tuxtepec
• FIBRA Macquarie addressed their needs
by constructing a new 6,800 sqm
building in Tecamac and 6,200 sqm
building in Tuxtepec
• Stores opened to the public on October
20, 2016 in Tecamac and November 16,
2016 in Tuxtepec
• Fábricas de Francia provides an
Tecamac Power Center additional strong anchor to both centers
New Fábricas de Francia store just prior to opening and is already drawing additional foot
2. traffic
Case Study
Fábricas de • Key outcomes:
Francia • 13,000 sqm GLA developed in two
stores of Fábricas de Francia,
Tecamac and Tuxtepec
New stores constructed • Additional 1,200 sqm GLA
for Fábricas de Francia constructed for lease to other
customers
at the Tecamac Power
• Addition of strong anchor to both
Center and Tuxtepec centers
Stocking the new Tecamac store prior to opening
03 Strong Track Record of Disciplined Capital Deployment / 26Reynosa
4
Consistently Strong Operational and Financial Performance
27Strong Operational Performance
Strong portfolio metrics including increasing occupancy
Occupancy Retention Rate1
(end of quarter) (LTM by GLA)
Industrial Retail Consolidated
100% Industrial Retail
95.2% 95.2% 95.2% 95.2% Average Industrial Average Retail
95.0% 94.7% 90%
77% 78%
93.0% 92.9% 93.0% 80% 76%
93.0% 92.7%
92.1% 73%
69% 68%
92.6% 92.6% 92.7% 70% 68% 71%
92.3% 65% 66% 69%
91.0% 91.6%
60% 59%
89.0%
1Q16 2Q16 3Q16 4Q16 1Q17 50%
1Q16 2Q16 3Q16 4Q16 1Q17
Rental Rates Weighted Avg Lease Term Remaining (years)
(avg monthly rent per leased sqm, end of qtr) (by annualized rent, end of qtr)
Industrial ($US) Retail (Ps.)
US$ Average Industrial Average Retail Ps. Yrs Industrial Retail
4.8 150 8.00
7.00
144.52 144.85 6.00 5.6 5.5 5.3
4.6 143.47 143.54 4.55 145 5.2 5.2
4.45 142.51 4.47 4.48
143.8 5.00
4.43
4.48
4.4 140 4.00 3.4 3.4 3.3 3.4 3.2
3.00
4.2 135 2.00
1.00
4.0 130 0.00
1Q16 2Q16 3Q16 4Q16 1Q17 1Q16 2Q16 3Q16 4Q16 1Q17
1. Retention rate is calculated on the basis of renewed leases as a percentage of total expiring leases. For the purpose of this calculation, leases are deemed to expire in the period corresponding to when either the renewal lease is signed or the
customer moves out, as applicable.
04 Consistently Strong Operational and Financial Performance / 28Strong Financial Performance
Revenues NOI
Ps.mm Ps.mm 86.5% 87.3%
85.7%
3,564 3,642 CAGR: 85.0%
2,942
26.1% 3,083 3,178 CAGR:
89.6%
2,341 2,521
25.1%
1,989
1,712 NOI
Margin 1,534
(%)
2013 2014 2015 2016 1Q17 LTM 2013 2014 2015 2016 1Q17 LTM
Total assets and investment properties1 AFFO 78.7%
Ps.bn Ps.mm 94.7%
84.8%
46.8 1,747
41.4
44.6 43.341.4 CAGR: 109.1% 1,684 CAGR:
36.4 37.4 14.8% 1,395 1,320
1,428 1,375 25.2%
27.6 29.4 18.9% Payout 1,053
1,149 8.3%
23.5 Ratio
2013 2014 2015 2016 1Q17
2014 2015 2016 1Q17 LTM
Total Assets Investment Properties AFFO Dividend
Note: Painting expenses have been reclassified from Repairs & Maintenance to Normalized Capex for 2015, 2016 and 2017
Source: Company reports
1. Proportionally combined results shows the wholly-owned and JV assets and results on a combined basis.
04 Consistently Strong Operational and Financial Performance / 29Strong Financial Performance
Revenues NOI
US$mm US$mm 85.7% 86.5% 87.3%
191 CAGR: 85.0%
186 189
11.2% 89.6%
176
165 165 CAGR:
159
150 10.3%
120
134 NOI
Margin
(%)
2013 2014 2015 2016 1Q17 LTM 2013 2014 2015 2016 1Q17 LTM
Total assets and investment properties1 Adjusted Funds from Operations (“AFFO”)
US$bn US$mm
47.4% 47.2% 48.0%
CAGR: 45.0% CAGR:
2.5 2.4
2.2 2.3 2.2 2.3 2.2 2.6% 90 91 6.3%
2.1 88
1.8
2.0
6.3% 86 -8.1%
83
79
AFFO 77
Margin 71
(%)
2013 2014 2015 2016 1Q17 2014 2015 2016 1Q17 LTM
Total Assets Investment Properties AFFO Dividend
Note: Conversion for Revenues, NOI and AFFO using average exchange rates of 12.767, 13.297, 15.850, 18.654 and 19.247 for 2013, 2014, 2015, 2016 and 1Q17 LTM respectively. Conversion for assets
using EoP exchange rates of 13.065, 14.718, 17.207, 20.664 and 18.8092 for 2013, 2014, 2015, 2016 and 1Q17 respectively. Painting expenses have been reclassified from Repairs & Maintenance to
Normalized Capex for 2015, 2016 and 2017. 1. Proportionally combined results shows the wholly-owned and JV assets and results on a combined basis.
04 Consistently Strong Operational and Financial Performance / 30Monterrey
5
Repositioned Balance Sheet and Strong Cash Flow
31Debt Overview
Debt in line with capital policy; focused on next maturity falling due in February 2018
By collateral type
Overview:
Secured
• Effective use of leverage in line with our capital policy 25%
and applicable regulations
• Regulatory LTV of 37.8% and Regulatory Debt
Service Coverage Ratio of 1.2x Unsecured
75%
• Real estate LTV of 41.6% and weighted average cost By currency
of debt of 5.0% p.a. MXN 5%
Loan Expiry Profile1
258.0 277.9
USDe
USD 95%
(millions) 181.5
By interest rate type1
114.0
75.0 Variable
12%
13.9
2017 2018 2019 2020 2021 2022 2023 2024 2025 2026
Unsecured Term Unsecured Revolver Secured Term Fixed
88%
1. Proportionately combined results, after fixed term loan under interest rate swap, FX: Ps. 18.8092 per USD
05 Repositioned Balance Sheet and Strong Cash Flow / 32Key Debt Metrics
81% 95% US$e 262m
unencumbered assets value of debt US$ denominated Total revolver size
88% 37.8% US$e 167m
Fixed rate debt Regulatory LTV Undrawn revolver capacity
Key Debt Ratios1
Total and Net Debt to EBITDA2 Interest Coverage Ratio2,3 Loan to Value2,4
6.7x 46.7%
3.2x 41.6%
2.9x
5.9x 5.9x
5.7x
March 31, 2017 March 31, 2016 March 31, 2017 March 31, 2016 as of Mar 31, 2017 as of Mar 31, 2016
TOTAL NET
1. FX: March 31, 2017: 18.8092 March 31, 2016: 17.4015. 2. Proportionately combined results 3. Interest coverage ratio calculated as EBITDA / Interest Expense. 4. Total debt / Value of Investment
Properties + Cash (on a proportionally combined basis).
05 Repositioned Balance Sheet and Strong Cash Flow / 33High Quality Distribution
LTM distribution yield LTM AFFO payout ratio
9.0% 8.5%
120.0%
8.0% 7.5%
Average 99.8% 100.2%
100.0% 91.2% 86.0% 91.2%
7.0% Average
7.0% 6.6% 6.9% 80.0% 78.6%
6.3%
6.0% 60.0%
5.4%
40.0%
5.0%
20.0%
4.0% 0.0%
TERRA FIBRAMQ FIBRAPL FSHOP DANHOS FUNO FIBRAMQ DANHOS FIBRAPL FUNO TERRA
Historical yields
30.0 CBFI Price Annualized Yield 10.0%
9.0%
Average 7.3% 8.0%
8.4% 8.2%
7.8% 8.0%
25.0 7.6%
7.2% 7.3% 7.3% 7.4%
7.1% 7.0% 7.2%
6.8% 6.0%
6.0% 6.1%
5.6%
20.0 4.0%
1Q13 2Q13 3Q13 4Q13 1Q14 2Q14 3Q14 4Q14 1Q15 2Q15 3Q15 4Q15 1Q16 2Q16 3Q16 4Q16 1Q17
Well-covered distribution, payout ratio among the lowest of its peers
1. TTM Dividend over TTM Average CBFI price
Source: Company reports as of 1Q17
05 Repositioned Balance Sheet and Strong Cash Flow / 34Monterrey
6
Experienced Management Supported by Quality Institutional Platform
35Experienced Management Team
Senior Leadership Team
Our Manager is part
of MIRA’s longstanding
global asset
management platform
Juan Monroy Simon Hanna Peter Gaul Alejandro Mota and follows MIRA’s highly
Chief Executive Chief Financial Head of Real Estate Retail Senior disciplined and
Officer Officer Operations at MPA Asset Manager
18 years of experience 16 years of experience 29 years of experience 17 years of experience
institutional approach to
fund management
Board of Directors of our Manager
Through our Manager,
we have access to
MIRA’s broader real
estate investment and
fund management
expertise, as well as
Mathew Banks Greame Conway Martin Stanley Nick O’Neil Jonathan Davis Macquarie Group’s global
Senior Managing Senior Managing Senior Managing Senior Managing Executive network
Director, Global Director, Head of Director, Global Director, MIRA Chairman,
Head of MIRA MIRA Americas Head of MIRA Real Estate, MIRA Mexico
Real Estate Americas
06 Experienced Management Supported by Quality Institutional Platform / 36Quality Institutional Manager
Industry leaders in Asset Management, Corporate Governance and Reporting
Fully Integrated Asset
Management Platform
• Balance Sheet Snapshot
Macquarie Infrastructure and Real Assets1 Administration Risk Management
Finance
• Global leader in infrastructure management Public Relations
• Macquarie has US$377.4 billion in assets under Accounting Human Resources
management Information
Legal Technology
• More than 22 years investing in infrastructure
• Manages US$104 billion of assets in approximately 50
funds around the world
• 29 MIRA Mexico staff, representing one of the largest Industry leaders
MIRA offices globally with respect to
corporate
governance and
reporting in the
Mexican FIBRA
market
1. As of September 30, 2016 based on the most recent valuations available
06 Experienced Management Supported by Quality Institutional Platform / 37Structure and Governance Aligned with Investors
Best-in-class corporate governance among the FIBRAs
• Fee construct,
• Balance corporate governance & Manager holdings aligned with investor
Sheet Snapshot
interests
• 80% of Technical Committee is independent
• Independent Directors re-appointed annually by certificate holders
• Performance Fee calculated every 2 years, reinvested in FIBRA Macquarie certificates
• Base management fee of 1% per annum of market capitalization paid every 6 months
06 Experienced Management Supported by Quality Institutional Platform / 38FIBRA Macquarie Highlights
High Quality 292
Dual Asset Industrial and 77%
Platform Retail Properties. of Revenues
Portfolio Leveraged to 83% of NOI from are Dollar
Mexico’s Industrial Assets Denominated
Economic Drivers
Quality
Capital Strong Record $2.2B Deployed
Institutional
Manager Closely
Allocation of Capital
Deployment
Since Inception
at 8.4% Cap Rate
Aligned with
Certificate
Holders
Multiple Growth
Consistent Repositioned Avenues
Performance Operational Capital Structure Organic,
And Growth and Financial to Support Development,
Performance Future Growth Expansions and
Acquisitions
06 Experienced Management Supported by Quality Institutional Platform / 39FIBRA Macquarie
1Q17 Highlights
Monterrey1Q17 Highlights
Strong operating and financial performance, continued focus on asset recycling
Summary
Financial Performance
• AFFO increased 15.4% on a YoY basis driven primarily by FX (11.4%), decreased same store expense (5.6%) and
decreased interest expense (2.2%), offset by increased normalized capex (-2.7%) and decreased same store income
(-1.8%)1
• Distribution of Ps. 0.3750 per CBFI, AFFO payout ratio 64.3% for 1Q17
• NOI margin increased 310bps YoY and 60bps QoQ driven primarily by US$ appreciation against the Peso
Operational Performance
• Consolidated occupancy increased 60bps YoY but decreased 30bps QoQ2
• Both industrial and retail rental rates increased, YoY and QoQ, driven by the impact of lease contract rate
increases
Strategic Initiatives
• Asset recycling: closed sale of two properties in La Paz and Ascensión for USe$4.6m in April 2017
• Debt: negotiating accelerated re-financing of US$182m loan maturing in 1Q18
1. 4Q15 AFFO has been adjusted to remove non-cash straight line rent 2. Occupancy excludes GLA from one property in Ciudad Juarez and one property in Querétero under re-development
411Q17 Highlights
1Q17Key Metrics
92.7%
YoY Consolidated Occupancy EoQ (1Q16: 92.1%; 4Q16: 93.0%)
Ps.473.2m
(Ps.0.5832 per certificate) Consolidated AFFO (1Q16: Ps.410.0 m – Ps.0.5053 per
certificate)
15.4%
YoY AFFO Increase
5.4%
QoQ AFFO Increase
US$4.55 sqm/mth
YoY Industrial Avg. Rental Rate EoQ (1Q16: US$4.45; 4Q16: US$4.48)
42You can also read