Rand Water National Parliamentary Portfolio Committee on Water and Environmental Affairs - April 2013 - AWS
←
→
Page content transcription
If your browser does not render page correctly, please read the page content below
RAND WATER GROUP ANNUAL RESULT
                 Rand Water
 LAUNCH – 12 OCTOBER 2012

                        National Parliamentary
                                  ~
        Portfolio Committee on Water and Environmental Affairs

                                                        Adv M Petlane
                                                         Chairperson

                                                       Presentation by
April 2013                                            DKP Sechemane
                                                       Chief Executive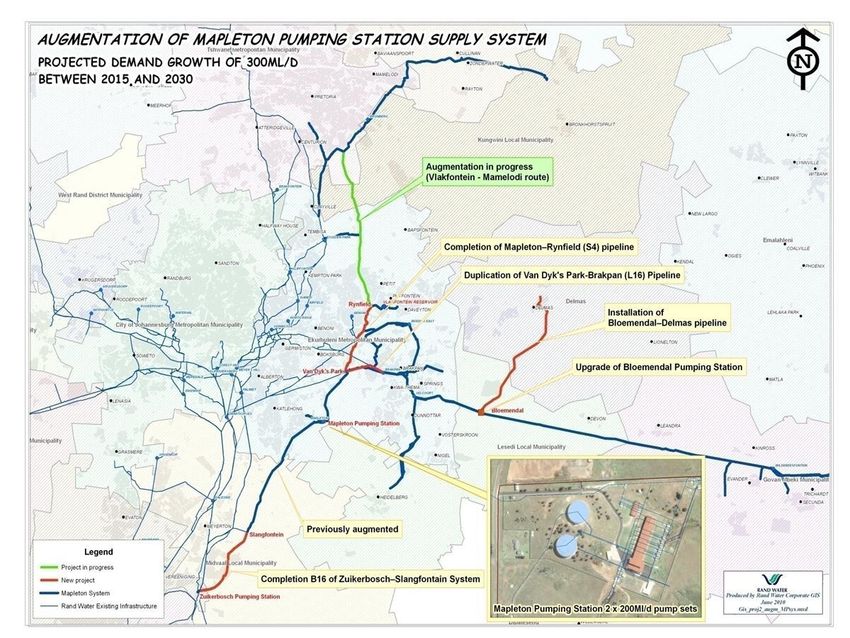
About Rand Water
Rand Water is a public utility wholly owned by government (DWA)
Rand Water has been in existence for 110 yrs
Bulk Water supplier - 4205 Mℓ/d
Consumers - Over 12 million
Total Pipeline Length - 3 500 km
Total Number of Reservoirs - 58
Supply Area - 18 000 km2
Additional 13 000 km2 in the Western Highveld
Page 2
About Rand Water
Pumping and Distribution Elevation

                                     Page 3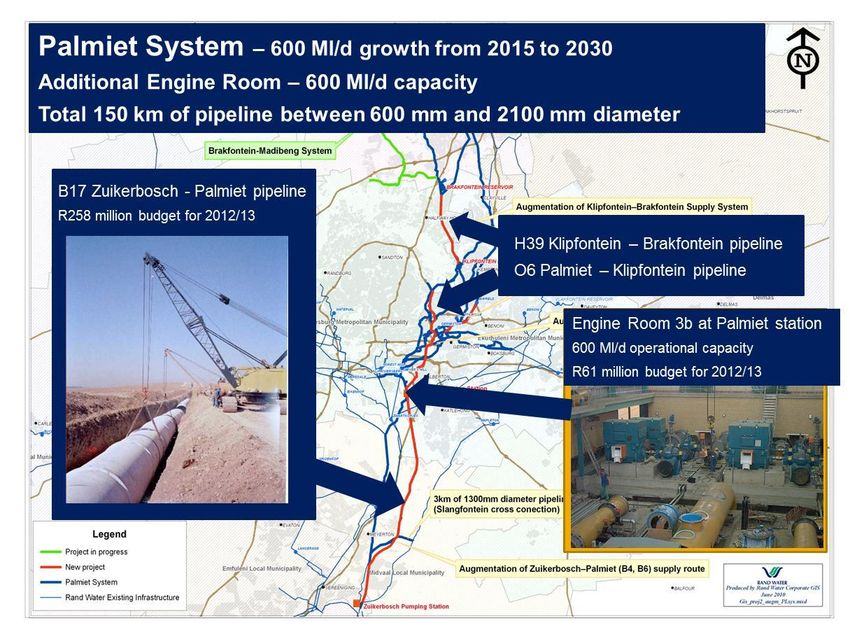
Annual Report for 2011/12
Performance Snapshot against:
Triple Bottom line
Shareholder Compact
Presidential outcomes
Financial performance
Page 4
Audit and Performance snapshot
Product Quality - SANS 0241 Class 1 and
Unqualified audit opinion
2 specification
Employment Equity:
ISO accreditations maintained:
o Disabilities – 4.2%
Corporate ISO 9001:2008
o Females in total workforce – 30%
OHSAS 18001:2007
o Females in management – 45%
Laboratories ISO 170425
Employee engagement level of 68%
All plants ISO 14001 accredited
attained against World class
BEE attained 92.4% against a target of
benchmark of 67%
83%
Credit ratings:
Customer centric approach yielding an
o S&P (A/Local Currency) & (BBB+/
overall satisfaction rate of 84%
Foreign Currency) – Negative outlook
Management, operations and
in line with sovereign
maintenance of water and wastewater
o Fitch Rating (F1+ (zaf) – Short term) &
treatment works and capacity building
Page 5
(AA+ (zaf) Long term)
Supply of peak daily demand achieved
Performance against Shareholder Compact
Strategic Plan

Alignment to National Government Objectives: Presidential Outcomes

                          Honourable Minister, Edna Molewa

  National Treasury                  DWA            Auditor General          National Parliament

                           Shareholder Compact

                          Corporate Business Plan

           Rand Water Strategy                                    Reporting Formats

                      Vision                                           Annual Report
                                                                       Annual Assessment of Water
                  Mission                                              Boards
                                                                       Quarterly Reports
        Strategic Objectives
                                    KPAs
                                                                                           Page 6
                                    KPIs
Performance Results
Performance against Shareholder Compact

                                          Page 7
Performance Results
Performance against Shareholder Compact

                                          Page 8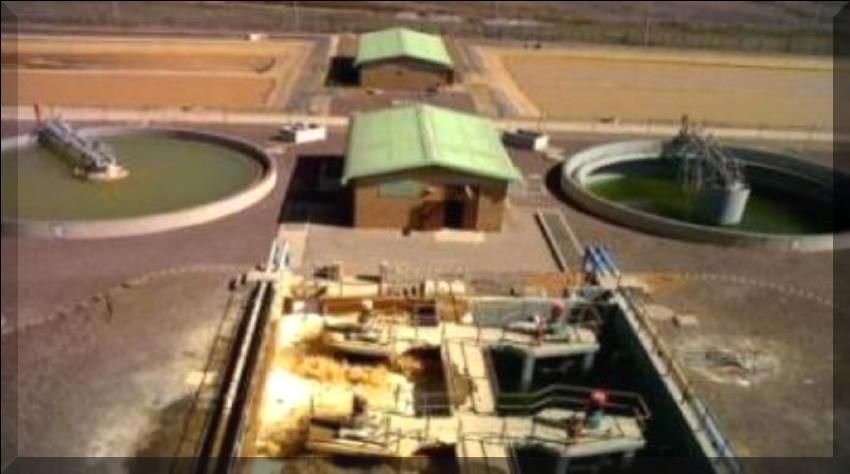
Contribution to government and Minister’s performance agreement
(cont.)

Outcome No. 4:   Decent employment through inclusive growth.
Outcome No. 5:   A skilled and capable workforce to support an inclusive growth path.

Job Creation and Training (2012 – 2017)

         New staff      Temporary Staff    Permanent New
         employed by RW (indirect) by Rand Jobs Within Rand Rand Water
Year     Contractors    Water Foundation Water              Academy Training
2012                  993                   1 150                      123                 56
2013                  400                   1 500                      100                120

2014                  600                   3 000                      100                150
2015                  400                   3 000                      100                200
2016                  300                   3 000                      100                225
2017                  300                   3 000                      100                250

                                                                                        Page 9
Total              2 993                  14 650                       623              1 001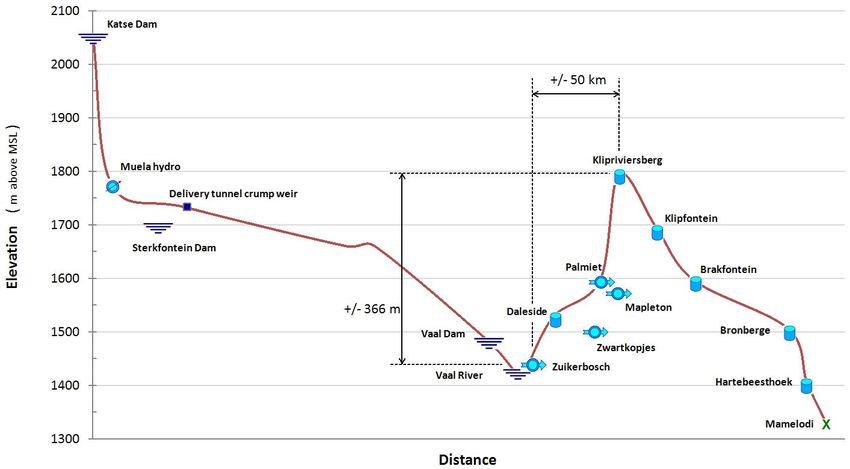
Contribution to government and Minister’s performance
agreement (cont.)
Outcome No. 10: Environmental assets & natural resources that are well protected and enhanced.
Rand Water Foundation – Flagship Projects
Water and Sanitation Projects: School Sanitation
The Foundation refurbished existing ablution blocks in 11 Winterveldt schools in
Tshwane Metropolitan Municipality
Municipal Capacity Building on Operations and Maintenance of Water and Waste
Water Treatment Plant through Unemployment Graduates Training
The project is aimed at contributing towards building municipalities’ capacity and also
to assist municipalities in terms of blue and green drop compliance requirements.
Schools Rainwater Harvesting
The initiative is aimed at Schools Water Supply, Demand Management and
Households Poverty Eradication
The Lesotho Schools Water Supply
The Foundation has equipped 5 schools in Lesotho with boreholes, submersible
pumps connecting to new reservoirs, and reticulation equipment.
War on Water Leaks-Water Demand Management and Conservation
The Foundation managed water demand and ensured conservation within the
Randfontein Municipality in Toekomsrus.
Page 10Contribution to government and
Minister’s performance agreement (cont.)
Outcome No. 10: Environmental assets & natural resources that are well protected and enhanced.
Rand Water and Blue Drop status
Rand Water’s awards have increased from last year - 9
to 14 awards this year
Together with the Ekurhuleni, Rand Water was the
nation’s top performer
Rand Water received special recognition for helping
municipalities achieve blue drop status
Extract from 2012 blue drop assessment report:
Special mention has to be made to the bulk supplier,
Rand Water. This water board embraced the Blue Drop
certification concept and invested ……….They also went
to great lengths to implement best practice as prescribed
by the World Health Organisation. They also respect the
regulatory requirements set by the Department of Water
Affairs and through all of this, not only showed that they
are a leading entity in many ways but also a very
valuable team player of the South African water sector”
Page 11Contribution To Government and Ministers Performance
Agreement (cont.)
Outcome No. 6: An efficient, competitive and responsive economic infrastructure network.
Rand Water’s Capex Programme
Page 12Contribution To Government and Ministers Performance
Agreement (cont.)
Rand Water’s Capex Programme
Outcome No. 6: An efficient, competitive and responsive economic infrastructure network.
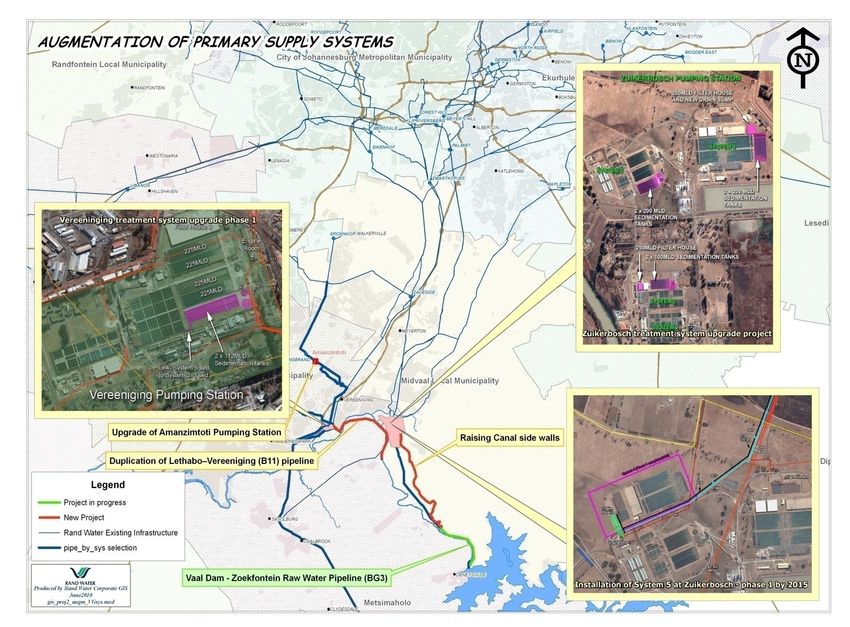
Projected peak day demands to 2035
Station Available New Come on Projected peak day demands
capacity capacity line by Mega litre
2015 2020 2025 2030 2035
Zuikerbosch 3900 1200 2016 3910 4500 4030 4550 4080
Vereeniging 1400 Nil 1400 1400 1400 1400 1400
Clarens Nil 1000 2025 1000 1000 2000
P/line
Eikenhof 2000 Nil 1400 1550 1700 1840 1980
Zwartkopjes 800 200 2013 700 760 820 880 930
Palmiet 1870 600 2015 1880 2100 2300 2500 2700
Mapleton 960 300 2017 920 1040 1140 1240 Page
134013Page 14
Primary Systems – 1600 Ml/d growth from 2015 to 2030
Additional Purification Plant – 1200 Ml/d capacity
Additional raw water pipelines and purification plant upgrades

                               B19 raw water pipeline
                               R55 million budget for 2012/13

                                                                Station 5 at Zuikerbosch
                                                                1200 Ml/d capacity in two phases
                                                                R52 million budget for 2012/13

                    BG3 raw water
                    pipeline
                    9 km x 3500 mm
                    R50 million budget for
                    2012/13                                                       Page 15
Page 16 Page 16
Page 17
Contribution to government and Minister’s performance
agreement (cont.)
Outcome No. 6: An efficient, competitive and responsive economic infrastructure network.
Other Projects
Brugspruit Acid Mine Drainage Plant
DWA appointed Rand Water for operations and
maintenance of Brugspruit Acid Mine Drainage Plant
in 2008.
Plant was successfully refurbished and
commissioned in August 2010.
Rand Water continues to work closely with DWA to
operate and maintain the plant
Westonaria Regional Bulk Infrastructure -
Extension of the Hannes Van Niekerk
wastewater treatment works
This was a special project that was identified by the
Presidency and DWA
Rand Water is the implementing agent on this
project
Page 18Contribution to government and Minister’s performance
agreement (cont.)
Outcome No. 6: An efficient, competitive and responsive economic infrastructure network.
Multi Hydro Power Projects Sedibeng Scheme
Rand Water has previously proposed
On 26th Sept 2012, Rand Water was invited to the
to develop multiple hydropower Presidential Infrastructure Coordinating Committee
projects (the Projects) combining a (PICC) to present its proposal to a number of cabinet
total net capacity of 12.9MW, various Ministers.
sites across South Africa, namel: There are a number of options available for a closer
Zoekfontein : 5.60 MW working relationship on this regional bulk scheme
Brakfontein: 2.00 MW 1. Rand Water can be involved as the implementing
Klipfontein: 3.30 MW agent – (construction of the scheme, working closely
Hartebeeshoek: 2.00 MW together with Emfuleni). Rand Water will then be
In selecting the project sites, our available for the operations and maintenance of the
primary objective was to locate scheme.
the proposed power projects 2. Emfuleni can build the scheme and allow Rand Water
to provide support with regards to project
nearest to our current water
management and capacity building on behalf of
transfer infrastructure where Emfuleni
hydropower can be generated 3. Rand Water can continue with the operations and
maintenance on behalf Emfuleni
From the feasibility study These options demonstrate the wide range of options for
conducted, the outputs of the state-owned entities and organs of state to work together.
Projects indicate that the total
cost of the 4 Projects will be On 12th November 2012, the Honourable Minister for
approx. R463.7 million. Page 19
Water Affairs issued a directive requesting Rand Water to
be the implementing agent for this project.Africa Initiatives
Swaziland An MoU was signed with Swaziland Water Services
Cooperation (SWSC) for collaboration on broader water
sector issues. SWW appointed Rand Water to assist
them in preparation for ISO accreditation of their
laboratory
DRC Project The DRC requested assistance from the South African
Government in 2007 to improve water supply in the
Katanga Province. Visits to the DRC culminated in the
signing of the Bi-National Agreement between SA and
DRC on 20 June 2011, in Lubumbashi (DRC).
Botswana The Botswana water utility appointed Rand Water to
assist in design and implementation of business
systems. Project commenced in April 2012, end in
November 2012.
Nigeria The Water Operator Partnership (WOP) program was
launched on August 2011 during at the African
Development Bank in Pretoria. The program manager is
accommodated at the Rand Water head office in Reitvlei.
490,000 Euros was provided as a grant by the African
Development Bank acting as trustee for the African
Page 20
Water Facility (AWF)Financial Performance highlights
Achieved over R6.8bn in revenue
Gross margin improvement from 53.56% to For the year 2012 2011
56.25% ended 30 June R R
Variable costs increasing by over 24% yoy with
million million
energy costs increasing by 31% Revenue 6 838 5 891
26% increase in EBITDA from R750m to R948m Net operating
expenses 5 890 5 141
Improvement in profit from operations from
R536m to R778m EBITDA 948 750
Overall cash reserves of R1,327m Depreciation and
amortisation 212 201
Actual capital investment of R1,481m
Profit from
operations before 736 549
57%
56%
8,000
net finance costs
7,000
55%
Net investment
6,000
42 (16)
54%
5,000
53%
52%
4,000 income/(expense)
3,000
- 3
51%
50% 2,000 Taxation
49% 1,000
48%
2008 2009 2010 2011 2012
-
Net Income for 778 536
Revenue GP% the year
Page 21Revenue growth and net income analysis
Revenue growth
• Revenue growth primarily driven by tariff increases of 12.9%
Potable water bulk tariff and volume of water sold
effective from 1 July 2011.
Volume Sold Potable water bulk tariff
• Volume increases of 3% primarily from the municipal 4.51
4.4 3.99 5.00
Ave mgl/d
customers. 4.2 3.50
3.04 3.23 4.00
4.0 4.2
• Municipal customer contribution to revenues decreasing year- 4.1 3.00
R/kl
3.8
on-year from 90% to 89% in 2012. 3.6 3.8 2.00
3.7 3.7
3.4 1.00
• Tariffs are cost reflective.
3.2 -
• Water research levy has remained constant year on year. 2008 2009 2010 2011 2012
Net Income Analysis
2,000
1,600 258
158 274
1,200
Rm
212
792
800 11 47
400 778
536
-
Other
Chemicals
Gross profit
Staff costs
Raw water
Energy
Depreciation
2011 Net income
2012 Net income
Tariff increase
Page 22Asset base analysis and cost breakdown
June 2011 June 2011 June 2012 June 2012
historical cost replacement value historical replacement
R’000,000 cost value
Profit/loss for the period 534 534 778 778
Adjustments: Depreciation and amortisation (1,573) (1,402)
Adjusted profit after revaluation for the year 534 (1,039) 778 (623)
Equity cumulative impact: Closing Equity 6,756 5,184 7,534 4,561
Adjustments: Revaluation of PPE - 71,484 - 72,466
Adjusted closing Equity balance 6,756 76,668 778 77,027
Statement of financial position : PPE 7,154 78,639 8,417 80,000
RATIOS
Return on assets 7% NONE 9% NONE
Debt/Equity ratio 15% 1% 19% 2%
2011 cost breakdown 2012 cost breakdown
Cost of raw water 4% 3%
Cost of raw water
Energy 20% 21%
Energy
Chemicals Chemicals
4% 51% 4% 49%
Other costs Other costs
5% 4%
Labour Labour
Dep&Amort 16% 19%
Dep&Amort
Page 23Statement of financial position
2012 2011
for the year ended 30 June R million R million
EQUITY AND LIABILITIES
Equity 7 534 6 756
Non-current liabilities 1 428 998
Borrowings 985 646
Post-retirement benefit obligation 294 274
Capital and Reserves (R million) Debt: Equity (%)
7,534
20
8,000 20 18
6,756
6,222 16
5,925 16
6,000 5,339 14 14
12
4,000
8
2,000
4
0 0
2008 2009 2010 2011 2012 2008 2009 2010 2011 2012
Page 24Abridged statement of cash flows
2012 2011
for the year ended 30 June
R million R million
Cash flow from operating activities 1 169 950
Cash generated from operations 1 196 970
Other (28) (20)
Cash flows from investing activities (1 316) (956)
Acquisitions (1 360) (1 011)
Proceeds from disposal of assets 3 14
Other investment activities 41 41
Cash flow from financing activities 544 12
Increase in bank and cash 397 6
Cash generated from operations (R million)
• Cash generated from operations after working capital changes 1,400
increased by 23% to R1 196m 1,196
1,200
• Net cash generated from operating activities increased by 23% 959 970
to R1 169m 1,000 881
800
546
600
400
200
0
2008 2009 2010 2011 2012
Page 25Analysis of 2011/12 Budget
Page 262011/12 Actual performance against
budget
2012 2012
For the year ended 30
June Actual Budget Variance
R million R million %
Revenue 6 838 6 706 2
Net operating expenses 5 890 5 810 1.3
EBITDA 948 896 5.8
Depreciation and
amortisation 212 194 (9.3)
Profit from operations
before net finance costs 736 702 4.8
Net investment
42
income/(expense)
Taxation -
Net Income for the year 778 702 10.5
Page 27Analysis of operational expenditure - year
on year (yoy) and against budget
Cost of raw water (6.0% increase yoy) 60% 17.0 25
19.5
3,500 2.50
2,992 40% 20
3,000 2.01 49% 16.5
1.83 1.94 2.00 20% 28% 36%
1.55 1.70
2,500 15
R’m
3,031 16%
R/kl
2,000 1.50 0%
R/kl
11.9 0% 10
1,500 2,251 2,734 1.00 -20%
6.9 8.6
1,000 2,435 -40% 5
0.50
500 -60% -42% 0
- 0.00 2008 2009 2010 2011 2012 2012
2009 2010 2011 2012 2012 Budget Actual
Budget Actual
% growth in chemical costs yoy R/kl
Cost of raw water R/kl
Staff costs (16.9% increase in R/kl yoy) Opex (8.8% decrease in R/kl yoy)
Headcount increase of 4% (123 new heads in 2012) 275 0.20
0.18 0.18
270 0.18 0.19
1,400 1,276 1.00 0.19
R’m
1,200 0.74 0.83 0.80 265 271
R /kl
0.67 0.71 0.18
1,000 0.58 268
260 266
R/kl
0.60 270
800 1,112 0.17
0.17
Rm
600 961 1,065 255
0.40
848 254 0.16
400 250
0.20
200
- 0.00 245 0.15
2009 2010 2011 2012 2012 2009 2010 2011 2012 2012
Budget Actual Budget Actual
Staff costs R/kl Opex R/kl
Excludes cost of sales – non-core
Page 28Energy management
Energy Efficiency
Security of supply Tariff minimization
improvement
Energy Cost
Cogeneration Other
optimization
Cost of energy
70 45% Energy Usage
40% 1.6
60
35% 1.4
50
30% 1.2
c/kWh
40 25% 1.0
Mwh/ml
30 20%
0.8
15%
20 0.6
10%
10 0.4
5%
0.2
- 0%
2005 2006 2007 2008 2009 2010 2011 2012 -
c/kWh % growth yoy 2009 2010 2011 2012
Page 29Capital expenditure
Capital expenditure performance excluding moveable assets
R’m
1600 1477 100%
99% 1361
1400 98%
1200
1074 96%
1000 986 1000 970
1000 910
94%
800
92% 92%
600
90% 90%
400 91%
200 88%
0 86%
2009 2010 2011 2012
Budget Capex % Achievement
Page 302013/14 Tariff
Page 31Previous Cycle Tariff Consultation
(Before revised energy tariff)
• Rand Water has
Rand Water Tariff = Rand Water Internal Inflation for Financial Year Ending 30th June 2013
followed a consistent Price Forecast Percent Weighted
rationale for Year-End ~ 30 June increase 2013 of total
increasing its tariff
over the years. % Rm % %
• This rationale has TCTA 8.2% 2888 40.7% 3.5%
been based on DWA 10.3% 590 8.3% 0.7%
assessing the Rand
Water internal rate of Raw Water 8.5% 3478 48.9% 4.2%
inflation. Energy - Eskom 26.1% 808 11.4% 3.0%
Energy - Municipalities 38.6% 726 10.2% 3.9%
• This is a projection of
Chemicals 12.5% 330 4.7% 0.6%
the expected increase
in total costs. Multi-Partnered Uncontrollable Costs 5342 75.2% 11.7%
Labour 8.2% 1165 16.4% 1.3%
• A breakdown of the
total costs and their Other 5.4% 598 8.4% 0.5%
overall expected rate Total 7105 100.0% 13.5%
of price increase is
then proposed as the
proposed tariff Page 32
increment. Target bulk tariff increase 13.5%Tariff Consultation after revised energy tariff
Eskom Tariff Revision – Original Tariff Increment – 26.1%
Rand Water Tarif = Rand Water Internal Inflation for Financial Year Ending 30th June 2013
18.0% 16.7% Price Forecast Percent Weighted
15.7% 16.0%
Year-End ~ 30 June increase R 2,013.00 of total
16.0%
13.5% % Rm % %
14.0%
11.1% TCTA 8.18% 2888 41.3% 3.5%
12.0%
DWA 10.3% 590 8.4% 0.7%
10.0%
Raw Water 8.5% 3478 49.7% 4.2%
Energy - Eskom 16.7% 747 10.7% 1.8%
Energy - Municipalities 29.2% 677 9.7% 2.8%
Chemicals 12.5% 330 4.7% 0.6%
Multi-Partnered Uncontrollable Costs 5233 74.8% 9.4%
Labour 8.2% 1165 16.6% 1.4%
Other 5.4% 598 8.5% 0.5%
Total 6996 100.0% 11.3%
In line with a consistent rationale for
increasing its tariff over the years, Rand
Water revised its tariff to 11.3%.
© SAP 2008 / Page 33
Target bulk tarif increase 11.3%Current Cycle of Tariff Consultation – Tariff increase on 1st July 2013
Rand Water Tariff = Rand Water Internal Inflation for Financial Year Ending 30th June 2014
Price Forecast Percent Weighted
Year-End ~ 30 June increase 2014 of total
% Rm % %
TCTA 8.47% 2845 37.2% 3.24%
DWA 10.8% 603 7.9% 0.69%
Raw Water 8.7% 3448 45.0% 3.92%
Energy - Eskom 15.0% 887 11.6% 1.74%
Energy - Municipalities 15.0% 725 9.5% 1.42%
Chemicals 8.9% 360 4.7% 0.42%
Multi-Partnered Uncontrollable Costs 5420 70.8% 7.50%
Labour 8.0% 1303 17.0% 1.36%
Other 7.8% 933 12.2% 0.96%
Total 7656 100.0% 9.82%
Page 34
Target bulk tariff increase 9.82%Current Cycle of Tariff Consultation – Tariff increase on 1st July 2013
NERSA approved a general tariff increase of 8% on the price of electricity.
Following the announced increase, Eskom went into the different categories of
their tariff structure to apply different rates on their diverse customer profile
based on Eskom’s priorities and justification. This would result in an average
8% increase on Eskom’s average price.
The Eskom tariff structure is based on 23 categories determined by their
customer profile.
Megflex is the wholesale price aimed at big industrial consumers (the drivers of
our economy) and municipalities (slightly different from the industrial version).
Given that 97% of Rand Water’s energy received from Eskom is based on only
one category i.e. Megaflex, it follows that the tariff increase that will matter most
to Rand Water is the Megaflex tariff increase.
Depending on Eskom’s priorities and rationale on restructuring the tariffs,
different categories would be affected differently by the price increase.
Page 35Current Cycle of Tariff Consultation – Tariff increase on 1st July 2013
The table below illustrates the price The table below shows the actual percentage
movements in the last three years per item on increase per item.
the Megaflex tariff category applicable to Rand
Water
ESKOM PERCENTAGE CHANGE PER ITEM
(Based on Megaflex) - Palmiet Pumping
UNITSStation 2011/12 2012/13 2013/14
(Based on Megaflex) - Palmiet Pumpi
UNITS ng Station 2011/12 2012/13 2013/14
SUMMER WINTER SUMMER WINTER SUMMER WINTER
SUMMER WINTER SUMMER WINTER SUMMER WINTER
Administration Charge 1 2,016.00 2,016.00 2,320.80 2,320.80 2,506.50 2,506.50
Service Charge 1 2,104.29 2,104.29 2,422.28 2,422.28 2,616.06 2,616.06 Administration Charge 1 15.1% 15.1% 8.0% 8.0%
Service Charge 1 15.1% 15.1% 8.0% 8.0%
kWh Peak 3,616,395 0.5104 1.8283 0.5875 2.1046 0.6568 2.0133
Standard 8,977,295 0.3127 0.4752 0.3600 0.5470 0.4520 0.6099 kWh Peak 3,616,395 15.1% 15.1% 11.8% -4.3%
Off-Peak 12,470,300 0.2187 0.2539 0.2517 0.2923 0.2868 0.3312 Standard 8,977,295 15.1% 15.1% 25.6% 11.5%
Notified Network Access 48,863 8.63 8.63 9.93 9.93 10.67 10.67 Off-Peak 12,470,300 15.1% 15.1% 13.9% 13.3%
TX Network Access 48,863 4.3 4.3 4.95 4.95 5.35 5.35 Notified Network Access 48,863 15.1% 15.1% 7.5% 7.5%
NetworkDemand Charge 43,030 16.35 16.35 18.82 18.82 20.23 20.23 TX Network Access 48,863 15.1% 15.1% 8.1% 8.1%
Reactive Energy 326,863 0.0756 0.087 0.094 NetworkDemand Charge 43,030 15.1% 15.1% 7.5% 7.5%
Reliability & Afordability 25,063,990 0 0 0.0233 0.0233 New Items Reactive Energy 326,863 15.1% 8.0%
Premium Connection Charge 1 24,390.00 24,390.00 24,390.00 24,390.00 24,390.00 24,390.00 Reliability & Afordability Charges 100.0% 100.0% New Items
Electrifcation & Rural Subsidy Levy25,063,990 0.0397 0.0397 0.0457 0.0457 0.0520 0.0520 Premium Connection Charge 1 0.0% 0.0% 0.0% 0.0%
Envrironmental Levy 25,063,990 0.0200 0.0200 0.0200 0.0350 0.0350 0.0350 Electrifcation & Rural Subsidy Levy 15.1% 15.1% 13.8% 13.8%
Envrironmental Levy 0.0% 75.0% 75.0% 0.0%
Monthly Bil 300,767,880 10,240,431 16,928,953 11,707,974 19,783,852 14,456,818 21,364,379
Monthly Bil 14.3% 16.9% 23.5% 8.0%
Annual Costs 142,950,736.43 164,723,323.60 194,204,503.62
R/kWh 0.4753 0.5477 0.6457 Annual Costs 15.2% 17.9%
% Increase on R/kWh 26.8% 15.2% 17.9% R/kWh 15.2% 17.9%
Page 36What drives the high increase?
Increase Proportion Contribution
Per Item of Bill to Total Increase
Administration Charge 8.0% 0.02% 0.00%
Service Charge 8.0% 0.02% 0.00%
kWh TOTAL 12.6% 72.5% 9.2%
Notified Network Access 7.5% 3.2% 0.2%
TX Network Access 8.1% 1.6% 0.1%
NetworkDemand Charge 7.5% 5.4% 0.4%
Reactive Energy 8.0% 0.0% 0.0%
Reliability & Afordability Charges 100.0% 3.6% 3.6%
Premium Connection Charge 0.2%
Electrifcation & Rural Subsidy Levy 13.8% 8.1% 1.1%
Envrironmental Levy 47.4% 5.4% 2.6%
17.9%
Rand Water is therefore unable to reduce its tariff based on this energy tariff
which is higher than the projected tariff.
Page 37Looking forward and other strategic
matters
Rand Water Priority areas
Capex plan for next 5 years
Funding overview
PAIA and PAJA
Other strategic matters
Other strategic issues
Page 38Priority areas
Quality and Growth RW Top 10
quantity of Initiatives Academy Risks
Raw Water
RAND
RAND WATER
WATER
STRATEGY
2030
Presidential Organizational Bulk
Outcomes Preparedness Sanitation
Rural
development
39
Page 39Capital expenditure in the near and
medium term
Capital budget for 2012/13 Capital expenditure 5-year plan
• Total planned capital expenditure =
• Continuing business – R1.5 billion
Annual budget R11 billion (2013 – 2017)
• Augmentation projects – R1 billion 5-year plan
2012/13 • Projected R8 billion for augmentation
• Renewal projects – R 0.5 billion
projects
Project distribution by value
Relation to asset replacement value
• Expenditure planned on 300 projects
• Estimated current asset replacement value of R80 billion –
• Top 15 projects have total planned expenditure of about R1 billion
should spend 1% to 2% per annum on renewal
• Many smaller projects
• Forecast average demand growth of 1.75% per annum to 2030
Typical renewal projects
Funding for augmentation and renewal
• Zwartkopjes – East Rand system: pipelines
• Augmentation – R1.6 billion p.a.
• Pre-stressed concrete pipelines
• Upgrade/replacement of switchgear, pumps, motors, valves, • Renewal – R0.6 billion p.a.
instrumentation • Need better long term balance
Capital expenditure split between main plant
categories (Rm) Capital expenditure forecast on continuing business
3.0
2.6
2.4 2.4 2.3
Reservoirs 2.5
Pumping R122
R1,484 2.0
Rm
1.6
1.4
1.5 1.2
1.0 1.0
Pipeline 1.0 0.7
R4,061
0.5
Purification -
R2,463
Page 40
Financial yearMajor capital projects 2012 – 2013
Actual cost to Estimated total R11 billion 5-year capital expenditure plan on continuing
date cost business
Major capital projects Rm Rm
Palmiet - Klipfontein augmentation 1 520 Year of Augmentation Renewal Total
System
BG3 pipeline 466 612 completion (Rm) (Rm) (Rm)
Zuikerbosch to Palmiet pipeline 158 1,376
Zuikerbosch scheme (phase 1) 20 2,312
Eikenhof 2016 552 242 794
Sedimentation tanks at Zuikerbosch 101 330
Mapelton 2017 519 187 706
Palmiet Engine Room 3b 4 475
Palmiet 2016/17 3,276 454 3,730
Co-generation 5 465
Raw Water 2016 538 566 1104
Growth investments and green agendas
Vereeniging 325 752 1077
Hydropower Zuikerbosch 2016/17 2,766 431 3,197
Zwartkopjes 2015 234 501 735
Total 8,210 3,134 11,344
Effluent re- Sedibeng
use Scheme
Page 41Funding overview
Rand Water has made use of the capital markets for many decades, Sources of funding
with a history of regular issuances going as far back as 1970.
Facility Utilisation Available
Recent issuances amount
RW02 RW21
600
468 506 Cash 700 0 700
400
R’m General banking 2 500 2 2 498
208
200 facilities
-
2000 2001 2002 2003 2004 2005 2006 2007 2008 2009 2010 2011 2012 DMTN 5 000 974 4 026
• RW02 was issued at a nominal value of R208 million in 2000, but DFI 1 000 0 1,000
has since been tapped into for an additional R425 million by Rand Total 9 200 980 8 220
Water during its 12 year tenor.
• RW21 was issued in April 2011 at a nominal value of R468 million,
Credit ratings
and Rand Water made a tap issuance of R506 million in 2012.
Standard & Poors Fitch Ratings
• Over the next 5-year period, Rand Water has a funding requirement
Short term A+ F1+ (zaf)
of R6 billion which will be funded thru the available funding facilities
Long term BBB AA+ (zaf)
The RW21 bond is the only Rand Water Issuance that is currently
trading in the capital market and has not matured. Debt profile
Salient features of bond RW21
17%
Amount issued ZAR974 million
Coupon 9.97% RW02 (R208m) matured: July 2012
Capital profile Bullet RW21 (R974m) maturing: April 2021
Interest profile Fixed
83%
Date of maturity 21 April 2021
Tenor 10 year < 1 year 9 years Page 42
Credit rating A-, Standard & Poor’sRand Water & the Promotion of Access to Information Act, No 2 of
2000 (PAIA)
• Rand Water’s compliance with the above Act, is in accordance with Section 14, being an
office of state
• As required by the Act, a manual has been compiled and has been published in the
Government Gazette, no. 23888, dated 4 October 2002. This manual is updated annually
• The manual has been submitted to the Human Rights Commission for the first time on
15 August 2002 and updated versions has been submitted to the Commission ever since
• The manual is available in English, Zulu and Southern Sotho
• The manual is also electronically available on Rand Water’s website and intranet
• In terms of the Act, the Chief Executive is the Information Officer and a Deputy
Information Officer has been designated since 15 July 2002. Currently there are two
Deputy Information Officers, being the Group Company Secretary and the Group Shared
Services Executive
Page 43Rand Water & the Promotion of Administrative Justice Act (PAJA)
• South Africa is a constitutional
• The person must be informed of his rights
democracy. Government and state organs
Rand Water as an Organ of State is subject
must act within the confines of the law. In
to the provisions of PAJA .
order to give effect to the protection of
people’s rights, the Constitution has a Bill • Example: Blacklisting/delisting of Service
of Rights which at section 33 provides Providers from RW’s database due to
that everyone has a right to an financial irregularities, fraud, corruption
administrative action that is lawful, etc. – before blacklisting is done, the
reasonable and procedurally fair. Services Provider is given the opportunity
to attend meeting, the allegations and
• National legislation (PAJA) was passed in
findings of an internal investigation is
order to give effect to section 33 of the
presented to the SP who is then given the
Bill of Rights. PAJA sets out mandatory
opportunity to defend/rebut the allegations
rules for a fair procedure where rights or
with factual corroboration;
legitimate expectation of a person or a
group are affected. The mandatory • Letters to non-successful tenderes are
procedure is that before an administrative sent notifying them of them not being the
decision is made: successful tenderer
The person affected by the decision must • Land and rights – servitude
be given written adequate notice of the negotiations/expropriations – process put
nature and purpose of the administrative in place to ensure proper consultation with
action; the land owners before servitude is
registered or expropriated.
• The person must be given an opportunity Page 44
to make representationStrategic Issues 1. It is important to note that some municipalities have passed on to households Rand Water’s original tariff of 13.5 per cent. Rand Water suggests that this differential be utilised by local councils to establish a fund for Project 15% 2. Project 15% - There is growing alarm that this project has not been successful. Rand Water would like to offer its assistance which will help to reduce the high growth in demand. SALGA and Rand Water should work closely to impart lessons from other local councils where Rand Water has worked on this matter. 3. Energy Tariffs – In previous years, local councils have imposed a far high tariff increment than Eskom. 4. Encroachment on Rand Water Servitudes - The issue of informal settlements imposes a great risk to people close to Rand Water’s pipe network and the supply of water. This is an issue that requires urgent assistance to water boards and other state owned utilities. 5. Experiencing steep increases in input costs, i.e chemicals and energy and fluctuations in steel prices 6. Higher wage rate increase in the water sector 7. Maintain and improve Rand Water’s credit profile 8. Default risk by major municipalities Page 45 9. Deteriorating raw water quality as a result of poor catchment management
Thank You

            Page 46
You can also read