20 First Half of Interim Management Report - Acerinox
←
→
Page content transcription
If your browser does not render page correctly, please read the page content below
Interim Management Report - First Half of 2021

Interim Management
Report
First Half of
20
Free translation from the original in Spanish. In the event of discrepancy, the Spanish-language version prevails.

                                                                                                                     0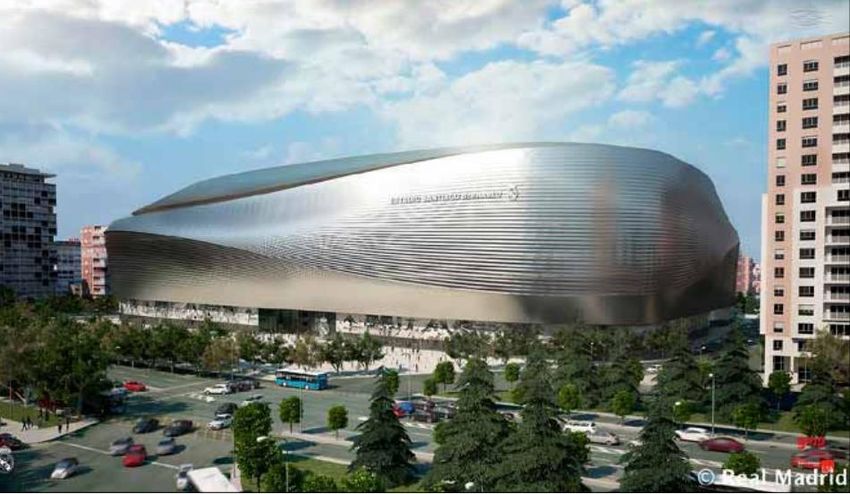
Interim Management Report - First Half of 2021
Presentation of the First Half 2021 results via
webcast and conference call
Acerinox will hold a presentation for its First Half 2021 results today at 10.00 AM CET, directed by the CEO,
Mr. Bernardo Velázquez, the COO, Mr. Hans Helmrich, and the CFO, Mr. Miguel Ferrandis.
The presentation can be followed by phone and online.
To access the presentation via telephone conference, you can join 5-10 minutes before the event, on the
following numbers:
From Spain: 919 01 16 44. PIN: 355000
From UK (local): 020 3936 2999. PIN: 355000
From United States: 1 646 664 1960. PIN: 355000
Rest of countries: +44 20 3936 2999. PIN: 355000
You can follow the presentation through the Shareholders and Investors section of the Acerinox website
(www.acerinox.com).
Both the presentation and all the audiovisual material will be available on the Acerinox website after the
event.
Model of the Santiago Bernabéu Stadium incorporating stainless steel cladding
1Interim Management Report - First Half of 2021
Highlights
First Half of 2021
"The Acerinox Group achieves its best half-yearly results since the First Half of
2007"
The Group continues to eradicate accidents, and the accident rate was reduced by 34% in
comparison with the first half of 2020.
Melting shop production, at 1,343,946 tonnes, increased by 29% with respect to the first half of 2020.
Revenue, amounting to EUR 3,066 million, increased by 32% in comparison with the same period of
2020.
EBITDA, which totalled EUR 378 million, was 2.3 times higher than in the first half of 2020. The EBITDA
margin was 12%.
Profit after tax and non-controlling interests amounted to EUR 203 million, compared with EUR 2
million in the January-June 2020 period.
Operating cash flow amounted to EUR 108 million.
The Group’s net financial debt, totalling EUR 838 million, increased by EUR 66 million with respect to
31 December 2020 due to increased working capital (EUR 253 million) and payment of the dividend
(EUR 135 million).
The Annual General Meeting held on 15 April approved the distribution of a dividend of EUR
0.50/share, which was paid on 3 June 2021.
Second Quarter of 2021
"The positive trend that began in the Third Quarter of 2020 continues"
Melting shop production, at 675 thousand tonnes, increased by 1% with respect to the first quarter of
2021.
Revenue, amounting to EUR 1,625 million, increased by 13% in comparison with the previous quarter.
EBITDA, which totalled EUR 217 million, was 35% higher than in the first quarter of the year. The
EBITDA margin was 13%.
Profit after tax and non-controlling interests totalled EUR 125 million, 61% higher than in the first
quarter of 2021.
Melting shop production and revenue increased by 54% and 39%, respectively, in comparison with
the second quarter of 2020, which was seriously affected by Covid-19, and EBITDA was 2.7 times
higher.
Operating cash flow amounted to EUR 84 million, despite the EUR 100 million increase in working
capital.
The Group’s net financial debt, totalling EUR 838 million, increased by EUR 82 million with respect to
31 March 2021, but was EUR 33 million lower than at 30 June 2020.
The Annual General Meeting held on 15 April approved the distribution of a dividend of EUR
0.50/share, which was paid on 3 June 2021.
A sustainable steel line was launched.
The Group was awarded with the Golden Level by Ecovadis for its commitment to sustainability.
2Interim Management Report - First Half of 2021
Outlook
The improvement that commenced in summer 2020 was maintained in the second quarter.
In view of the positive demand situation and the greater visibility afforded to us by our backlog, we estimate
that EBITDA will improve from the second to the third quarter, both in the stainless steel and the high-
performance alloys divisions.
Expected cash generation in the third quarter will enable us to reduce the Group’s net financial debt.
3Interim Management Report - First Half of 2021
Main economic and financial figures
QUARTER FIRST HALF
Consolidated Group
Variation
Q1 2021 Q2 2021 2021 2020
2021/2020
Melting shop production (thousands of tonnes) 668 675 1,344 1,044 29%
Revenue (EUR million) 1,441 1,625 3,066 2,331 32%
Adjusted EBITDA (EUR million) 161 217 378 179 111%
% of sales 11% 13% 12% 8%
EBITDA (EUR million) 161 217 378 165 130%
% of sales 11% 13% 12% 7%
EBIT (EUR million) 117 173 290 34 762%
% of sales 8% 11% 9% 1%
Profit before tax and non-controlling interests (EUR million) 106 163 269 22 1,097%
Profit after tax and non-controlling interests (EUR million) 78 125 203 2 9,249%
Depreciation and amortisation charge (EUR million) 44 44 88 88 -1%
No. of employees at period-end 8,153 8,302 8,302 8,385 -1%
Net financial debt (EUR million) 756 838 838 872 -4%
Gearing ratio (%) 43% 48% 48% 46% ---
No. of shares (millions) 271 271 271 271 0%
Shareholder remuneration (per share) 0.00 0.50 0.50 0.00 ---
Average daily volume of trading (millions of shares) 0.84 1.62 1.23 1.03 20%
Profit per share after tax and non-controlling interests 0.29 0.46 0.75 0.01 9,249%
Second quarter 2021 First half 2021
Stainless High- High-
Consolidated Stainless Consolidated
Division performance performance
Group Division Group
alloys alloys (1)
EUR million
Melting shop production
654 22 675 1,304 40 1,344
(thousands of tonnes)
Net sales 1,425 201 1,625 2,698 368 3,066
Adjusted EBITDA 201 16 217 353 26 378
Adjusted EBITDA margin 14% 8% 13% 13% 7% 12%
EBITDA 201 16 217 353 26 378
EBITDA margin 14% 8% 13% 13% 7% 12%
Depreciation and
-37 -6 -44 -74 -11 -88
amortisation
EBIT 163 11 173 279 15 290
EBIT margin 11% 5% 11% 10% 4% 9%
(1)
The purchase of VDM took place on 17 March. The first half of the year includes the results of VDM for the March-June period.
4Interim Management Report - First Half of 2021
Stainless steel division
Stainless steel market
Strong recovery of apparent consumption in the first half of 2021
The first half of 2021 confirmed the recovery of demand which became noticeable towards the end of 2020.
Increased confidence in the economy and improvement in activity are reflected in a process of inventory
replenishment throughout the supply chain, which was severely depleted worldwide and in all sectors in
2020.
This greater confidence arising from progress in vaccination processes in different countries is resulting in
the reactivation of consumption among stainless steel end customers, which is driven by consumer goods
industries such as the automotive, food industry and, particularly, domestic appliance manufacturing
industries. Other sectors, such as the restaurant and investment good for project sectors, are also
recovering.
Inventories in our industry remain below the average level for recent years.
UNITED STATES
In the first half of the year, the restrictions imposed as a consequence of Covid-19 were lifted as the
vaccination rate rose. This, together with the positive situation of the economy, resulted in an upturn in most
stainless steel-consuming industries.
Based on the latest available data, we estimate that apparent flat product consumption in the North American
market improved by 6% until May, in comparison with the same period of 2020.
The inventory figures published by the industry reflect levels below the average for recent years.
Imports remain tight, with a flat product market share of approximately 14%.
5Interim Management Report - First Half of 2021
EUROPE
Based on the latest available data, we estimate that apparent flat product consumption in the European
market improved by 16% in the first half of the year.
Demand remains robust and inventories low.
There was a decrease in the pressure from imports, which stood at around 20%.
The European Commission extended the safeguards for another three years, maintaining the quotas for all
products. Also, provisional anti-dumping measures were approved for cold-rolled flat materials from India
and Indonesia, the effects of which are already becoming apparent in the market. The definitive measures
are expected to be implemented in November for a period of five years.
These measures are implemented alongside the anti-dumping measures for hot-rolled flat products from
China, Indonesia and Taiwan which had been in place since April 2020.
The European market has gradually returned to the system of base price and alloy surcharge.
ASIA
Demand in Asia remains positive, although the Covid-19 situation and potential lockdown in various countries
could affect its performance.
China is continuing its policy of promoting its local market, and has eliminated the 13% export rebate.
The positive situation of the Asian markets and the increase in the price of maritime transport is reducing
exports to other markets.
6Interim Management Report - First Half of 2021
Stainless steel division production
The stainless division improved production at all plants with respect to the first half and second quarter of
2020, which were the most difficult periods due to Covid-19.
2020 2021 Variation
Q2 21 / H1 21 /
Q1 Q2 Q3 Q4 12 Months Q1 Q2 H1
Thousands of tonnes Q2 20 H1 20
Melting shop 599 420 524 601 2,144 650 654 1,304 56% 28%
Cold rolling 393 290 331 369 1,383 394 400 795 38% 16%
Long products
57 49 51 53 210 63 61 124 23% 17%
(hot rolling)
Columbus is continuing to develop and market, through long-term contracts, a carbon steel range for the
local South African market, enabling it to optimise its production capacity.
Due to the lockdown decreed by the Malaysian government, Bahru Stainless has remained closed since the
beginning of June.
Stainless steel division results
Q2 Q1 Q2 H1 H1 % Q2 21 % H1 21
EUR million 2021 2021 2020 2021 2020 / Q2 20 / H1 20
Melting shop production
654 650 420 1,304 1,019 56% 28%
(thousands of tonnes)
Net sales 1,425 1,273 894 2,698 2,053 59% 31%
Adjusted EBITDA 201 152 71 353 156 182% 126%
Adjusted EBITDA margin 14% 12% 8% 13% 8%
EBITDA 201 152 57 353 142 252% 149%
EBITDA margin 14% 12% 6% 13% 7%
Depreciation and amortisation
-37 -37 -40 -74 -80 -7% -8%
charge
EBIT 163 115 -26 (1) 279 19 (1) --- 1,376%
EBIT margin 11% 9% -3% 10% 1%
Operating cash flow
98 25 104 123 68 -6% 81%
(before investments)
(1)
Including EUR 42 million of impairment losses on assets at Bahru Stainless
The positive market situation that is being experienced by the stainless steel industry is reflected in this
division's production and sales figures. Specifically, production and sales increased by 28% and 31%,
respectively, in comparison with the first half of 2020.
Cost control and the conversion of fixed costs into variable costs to adapt swiftly to demand were maintained.
Total operating expenses (operating expenses and staff costs) increased by 15%, far below the increase in
production, in comparison with the first half of 2020.
7Interim Management Report - First Half of 2021
EBIDTA for the first half of the year, amounting to EUR 353 million, was 2.5 times higher than in the same
period of 2020, evidencing a clear positive evolution from the first to the second quarter. All factories
recognised positive EBITDA in the six-month period. Worthy of note is the EBITDA margin, which was 13%.
Operating cash flow totalled EUR 123 million despite the increase in working capital experienced in the
opening months of the year, due to higher activity levels.
Q2 2021 Q1 2021 Q2 2020 H1 2021 H1 2020
EBITDA 201 152 57 353 142
Changes in working capital -67 -146 66 -214 -31
Changes in operating working capital -84 -141 61 -225 -5
- Inventories -134 -113 80 -247 89
- Trade receivables -50 -160 88 -210 41
- Payable to suppliers 101 131 -107 232 -134
Other adjustments to working capital 16 -5 5 11 -27
Income tax -28 27 -2 -1 -25
Finance costs -8 -7 -6 -14 -9
Other adjustments to profit 0 -2 -11 -1 -8
OPERATING CASH FLOW 98 25 104 123 68
8Interim Management Report - First Half of 2021
High-performance alloys division
High-performance alloys market
In the first half of 2021 the high-performance alloys market recovered in all of our consumer sectors except
for aerospace.
The recovery has been noted in the oil and gas industry. Strong activity was recorded in major oil pipeline
projects in the second quarter.
The chemical industry enjoyed a strong recovery, with demand constantly improving.
The electronics industry continued to perform well, driven by OLED technology, which is a major high-
performance alloy consumer.
High-performance alloy consumption in the automotive industry has continued to perform well since the
fourth quarter of 2020.
Production
High-performance alloy melting shop production improved with respect to the second quarter and the first
half of 2020 due to an improved customer backlog.
2020 (1) 2021 Variation
12 Q2 21 / H1 21 /
Q1 Q2 Q3 Q4 Q1 Q2 H1
Thousands of tonnes months Q2 20 H1 20
Melting shop 19 18 14 13 64 18 22 40 18% 6%
Finishing shop 10 11 10 8 38 8 11 19 2% -6%
(1) January and February 2020 pro forma, prior to the acquisition of VDM
9Interim Management Report - First Half of 2021
Results
The improvement in the various industries resulted in a 6% increase in production compared with the first
half of 2020.
Q2 Q1 Q2 % Q2 21 / % H1 21
H1 2021 H1 2020 (1)
EUR million 2021 2021 2020 Q2 20 / H1 20
Melting shop production
22 18 18 40 37 18% 6%
(thousands of tonnes)
Net sales 201 167 208 368 413 -4% -11%
Adjusted EBITDA 16 10 13 26 33 21% -22%
Adjusted EBITDA margin 8% 6% 6% 7% 8%
EBITDA 16 10 13 26 33 21% -22%
EBITDA margin 8% 6% 6% 7% 8%
Depreciation and amortisation
-6 -5 -6 -11 -11 2% 1%
charge
EBIT 11 4 8 15 22 39% -33%
EBIT margin 5% 2% 4% 4% 5%
(1) January and February 2020 pro forma, prior to the acquisition of VDM
EBITDA for the first half of the year, amounting to EUR 26 million, was 22% lower than that of the same period
of 2020, although quarter-on-quarter improvement was substantial (+72%).
Due to the increase in activity, working capital had increased by EUR 39 million at 30 June and, consequently,
the Group's operating cash flow was negative at EUR 15 million.
Q2 2021 Q1 2021 H1 2021 H1 2020 (1)
EBITDA 16 10 26 33
Changes in working capital -32 -7 -39 -15
Changes in operating working capital -29 -14 -43 -11
- Inventories -33 -41 -74 8
- Trade receivables -6 -13 -19 12
- Payable to suppliers 101 40 50 -30
Other adjustments to working capital 7 7 4 -4
Income tax 2 -3 -1 -18
Finance costs -1 -2 -3 -3
Other adjustments to profit 1 2 4 -4
OPERATING CASH FLOW -14 -1 -15 -7
(1) January and February 2020 pro forma, prior to the acquisition of VDM
10Interim Management Report - First Half of 2021
Integration of VDM Metals
The German company VDM Metals, a leader in the production of high-performance alloys, was acquired in
March 2020.
Despite the difficulties arising as a result of the uncertainty surrounding Covid-19 and global travel
restrictions, the online meetings held enabled major milestones to be satisfactorily reached and achieved a
positive result of the integration. Synergies valued at EUR 5.2 million were achieved in the first half of the
year, 42% higher than the estimated target for this period.
Best practices in the stainless steel and high-performance alloys divisions, which were incorporated into
long- and flat-product technical exchange projects, both in Europe and the United States, boosted efficiency
in the manufacture of standard products. Shared resources enabled new products to be created in eight
different types of alloy, such as wide coil, plates and precision strips.
Furthermore, the high-performance alloys division has joined the Excellence 360º cost reduction and
efficiency improvement program, as detailed in the corresponding section of this Report.
The development of joint commercial strategies allows customer relations to be optimised and presence to
be increased in the project and high-performance alloy sectors in certain geographical areas.
11Interim Management Report - First Half of 2021
Results of the consolidated Acerinox Group
Revenue totalled EUR 3,066 million in the half year, representing a 32% increase on the first half of 2020,
thanks to a sound performance in terms of both volume and price.
The most significant figures are summarised in the table below:
Q2 Q1 Q2 H1 H1 % Q2 21 % H1 21
EUR million 2021 2021 2020 2021 2020 / Q2 20 / H1 20
Net sales 1,625 1,441 1,172 3,066 2,331 39% 32%
Adjusted EBITDA 217 161 94 378 179 131% 111%
Adjusted EBITDA margin 13% 11% 8% 12% 8%
EBITDA 217 161 80 378 165 171% 130%
EBITDA margin 13% 11% 7% 12% 7%
EBIT 173 117 -11 (1) 290 34 (1) --- 762%
EBIT margin 11% 8% -1% 9% 1%
Profit (Loss) before tax 163 106 -19 269 22 --- 1,097%
Profit (Loss) after tax and non-controlling
125 78 -26 203 2 --- 9,249%
interests
Operating cash flow (before investments) 84 23 111 108 75 -24% 44%
Net financial debt 838 756 872 838 872 -4% -4%
(1)
Including EUR 42 million of impairment losses on assets at Bahru Stainless
Acerinox continues to prioritise the use of an agile and lightweight cost structure that allows it to swiftly adapt
to changes in the market. Given the increase in activity, both personnel costs and operating expenses have
risen with respect to the previous period. This rise is nevertheless lower than the growth in volumes.
In this connection, total personnel costs and operating expenses dropped from 24% of sales in the first half
of 2020 to 22% in the first half of 2021.
EBITDA in the first half of the year, amounting to EUR 378 million, was 130% higher than in the same period
of 2020 and stands at its highest level since the first half of 2007, when average nickel prices reached USD
43,600 dollars. The EBITDA margin was 12%.
EBITDA in the second quarter, amounting to EUR 217 million, was 171% higher than in the second quarter
of 2020 and 35% higher than in the preceding quarter.
Quarterly EBITDA in millions of euros
217
161
131
90 97 103 87
74 85 80
Q1 2019 Q2 2019 Q3 2019 Q4 2019 Q1 2020 Q2 2020 Q3 2020 Q4 2020 Q1 2021 Q2 2021
EBIT in the half year amounted to EUR 290 million (first half of 2020: EUR 34 million) (after deducting EUR
43 million of impairment losses on assets at Bahru Stainless).
Profit after tax and non-controlling interests amounted to EUR 203 million (first half of 2020: EUR 2 million).
12Interim Management Report - First Half of 2021
Cash generation
The EBITDA generated, amounting to EUR 378 million, gave rise to an operating cash flow of EUR 108 million
in the half year, despite the increase in working capital.
Working capital increased by EUR 253 million. The high level of activity led to an increase across all line
items in the first two quarters of the year. Physical inventories remain controlled.
Capex in the first half of the year amounted to EUR 49 million.
Q2 2021 Q1 2021 Q2 2020 H1 2021 H1 2020
EBITDA 217 161 80 378 165
Changes in working capital -100 -153 63 -253 -34
Changes in operating working capital -113 -155 50 -268 -16
- Inventories -167 -154 95 -321 104
- Trade receivables -57 -173 93 -229 46
- Payable to suppliers 111 171 -139 282 -166
Other adjustments to working capital 13 2 13 15 -19
- Collective redundancy procedure (ERE)
0 0 0 0 -26
payment at Acerinox Europa
- Sundry adjustments 13 2 13 15 7
Income tax -26 24 -3 -3 -27
Finance costs -9 -9 -9 -18 -12
Other adjustments to profit (loss) 2 0 -20 2 -17
OPERATING CASH FLOW 84 23 111 108 75
Payment for purchase of VDM 0 0 0 0 -313
Payments due to investment -20 -29 -27 -49 -51
FREE CASH FLOW 64 -6 84 59 -289
Dividends and treasury shares -135 0 0 -135 0
CASH FLOW AFTER DIVIDENDS -71 -6 84 -77 -289
Translation differences -11 22 -16 11 -3
Grants and other 0 0 0 0 0
Net financial debt acquired from VDM 0 0 -85 0 -85
Changes in net financial debt -82 16 -17 -66 -377
In June, the shareholder was compensated with a cash dividend of 135 million euros, which in recent years
had been paid in the second half of the year.
13Interim Management Report - First Half of 2021
Balance sheet
ASSETS LIABILITIES
Millions of Millions of
Jun. 21 2020 Jun. 20 Variation Jun. 21 2020 Jun. 20 Variation
euros euros
Non-current
2,060 2,070 2,227 -0% Equity 1,756 1,615 1,880 9%
assets
Non-current
Current assets 3,288 2,664 3,012 23% 1,764 1,827 1,864 -3%
liabilities
- Bank
- Inventories 1,504 1,182 1,302 27% 1,367 1,410 1,435 -3%
borrowings
- Other non-
- Receivables 754 532 577 42% current 397 417 429 -5%
liabilities
Trade
693 464 500 49%
receivables
Other Current
61 68 77 -10% 1,828 1,291 1,494 42%
receivables liabilities
- Bank
- Cash 991 917 1,110 8% 463 280 546 65%
borrowings
- Trade
39 32 23 22% 1,161 879 783 32%
- Other current payables
financial assets - Other current
204 132 165 54%
liabilities
Total equity
Total assets 5,348 4,733 5,239 13% 5,348 4,733 5,239 13%
and liabilities
The net financial debt, amounting to EUR 838 million, increased by just EUR 66 million with respect to 31
December 2020, following the aforementioned increase of EUR 253 million in working capital and the
payment of a dividend of EUR 135 million.
The net financial debt was EUR 33 million lower than at 30 June 2020. It should be noted that VDM Metals
was acquired in March 2020 for EUR 313 million.
At 30 June 2021, Acerinox had immediate liquidity of EUR 1,709 million, consisting of EUR 991 million in
cash and EUR 718 million in available credit lines.
The Group’s term debt maturities total EUR 1,518 million and are fully covered by the current liquidity.
Millions of euros
1,709
1,518
71 2027-2029
Available 85 2026
718
credit lines
289 2025
419 2024
Cash on hand 991 306 2023
262 2022
86 2021
Liquidity Term debt maturities
14Interim Management Report - First Half of 2021
Sustainability
Acerinox has been advocating the Circular Economy for 50 years and has become a global benchmark in
this area by manufacturing products with a recycled content level of over 90%.
The main axes of the Strategic Sustainability Plan, 360º Impact, are the following:
20% reduction in 20% reduction in water
greenhouse gas emissions, abstraction
thereby renewing its
commitment to achieving
climate neutrality by 2050
10% annual reduction in
Frequency Rate of
7.5% reduction in energy Accidents resulting in
intensity Leave
10% annual increase in the
Recovery of 98% of waste proportion of new hires that are
(with just 2% ending up in minorities. Of particular note is the
landfill) fact that female hires rose by 19.6% in
2020 alone.
With respect to the 2030 Sustainability Goals, in the first half of 2021:
The Group continued to achieve the goals relating to green loans from BBVA, Sabadell and
CaixaBank.
The intensity of CO2 emissions (scopes 1+2) fell by 5% with respect to the first half of 2020 (and by
6% with respect to the preceding half year).
Energy intensity fell by 2% with respect to the first half of 2020 (and by 3% with respect to the
preceding half year).
The LTIFR cumulative in the first half of 2021 represented a 34% reduction with respect to the first
half of 2020 (and a 45% reduction with respect to the preceding half year).
Water consumption intensity was reduced by 18% from 2020 to 2021.
15Interim Management Report - First Half of 2021
In the first half of 2021, the Group was awarded a Gold-level rating by the EcoVadis Sustainability rating
platform. In addition to this ranking among companies from all over the world, the Acerinox Group attaches
particular importance to the recognition received from its own industry, having been awarded the three prizes
in the sustainability category by the International Stainless Steel Forum:
First Prize for Bahru Stainless for launching a project to manufacture building bricks using the
sludge generated during the pickling process in stainless steel production.
Second Prize for Acerinox Europa for the project to improve the performance of the graphite
electrodes in electric furnaces, with the consequent reduction in CO2 emissions.
Prize for North American Stainless for the project to reuse the tundish refractories in continuous
casting to prevent them from being sent to landfill.
The Group continues to contribute to the 17 United Nations Sustainable Development Goals (both directly
and indirectly) and to make progress with respect to commitments such as the decarbonisation of its
activities.
SUSTAINABLE STEEL
In line with Acerinox’s commitment to sustainability, and in order to promote the use of sustainable products
and facilitate our customers’ access to a better economy, the Company is launching a sustainable stainless
steel product line.
We expect this product line to be very well received in industries such as the domestic appliance, automotive
and construction industries, among others.
These products, characterised by the large proportion of recycled material used in the manufacturing
process and by the use of renewable energies, will be accompanied by the pertinent certificates issued by
a top-level company.
16Interim Management Report - First Half of 2021
Excellence 360º plan
In 2019 all the Digital Transformation initiatives were unified in a five-year plan (2019-2023) entitled
Excellence 360º. This Plan encompasses the Excellence Plans (continuous improvement projects) and all
the projects constituting the Group’s Digital Strategy.
Excellence 360º is aimed at comprehensively enhancing the business in terms of: production (improving
process quality and productivity); the supply chain (optimising stock and increasing delivery precision); the
commercial area (improving margins and the customer mix); and the purchase of raw materials (optimising
the mix at any given time), all thanks to the use of new technologies and placing the customer and service
at the core of the business.
The Excellence 360º results continued to improve across all business units in the first half of the year, most
notably in terms of maintenance, increased line productivity, energy consumption and optimisation in the
purchase of raw materials.
Estimated annual savings of EUR 58 million were achieved, representing a 64% degree of achievement of
the target set for this period (EUR 91 million).
As a result of the inclusion of VDM in the Acerinox Group, the efficiency plans that VDM had been developing
in the past were unified with the Group’s best practices through internal benchmarking and the Digital
Strategy in order to include the special steels division in Excellence 360º. The EUR 125 million annual target
is therefore being progressively increased, and will reach EUR 140 million in 2023.
Excellence Plan VI Excellence 360º
17Interim Management Report - First Half of 2021
Financial risk management
Although the exceptional circumstances caused by the global Covid-19 pandemic continued in this period,
Acerinox still considers the main financial risks to be those mentioned in its approved financial statements
for 2020, namely: market risk (foreign currency risk, interest rate risk and price risk), credit risk and liquidity
risk.
Effective management of these risks enabled the Group to minimise the unavoidable impacts of the Covid-
19 pandemic, and many of the measures set forth in the 2020 Annual Report remain in place.
CREDIT RISK
With regard to credit risk, claims as of June 30 are exceptionally low and payment delays are similar to those
of any other year prior to COVID-19.
LIQUIDITY RISK
With respect to liquidity risk, Acerinox had arranged credit facilities amounting to EUR 2,547 million, of which
28% were drawable. Net debt amounted to EUR 838 million at 30 June. The cash balances amounted to EUR
991 million.
The most significant financing transactions in the first half of 2021 were as follows:
In January, two long-term loans arranged in 2020 with CaixaBank and Banco Sabadell were converted
into sustainable loans amounting to EUR 80 million each to finance the purchase of the VDM Metals Group.
In February, an ICO-secured credit facility, amounting to EUR 10 million and with a maturity of three years,
was arranged with Liberbank in order to provide the Acerinox Group with sufficient liquidity to mitigate the
economic effects of Covid-19.
In March, the long-term loan of EUR 85 million arranged with Kuxtabank was refinanced, whereby the
conditions were improved by increasing the loan principal by EUR 20 million and extending the final
maturity to 2026.
In May, a long-term loan of EUR 50 million, with a four-year final maturity and tied to sustainable KPIs, was
arranged with BBVA.
In addition, to ensure continued Group liquidity, four credit facilities in euros and one in US dollars, totalling
over EUR 300 million, were renewed in the first half of 2021, with improved financing conditions and a one-
year extension of the maturity.
The Acerinox Group has satisfactorily met the repayment schedules for its borrowings. None of the loans
arranged in the first half of 2021 are contingent upon the achievement of annual results-based financial ratios.
With respect to the high-performance alloys division, financial instruments are arranged or the pertinent
insurance policies are taken out in order to limit the risks that may potentially have the greatest material
impact on the financial statements and results. Derivative financial instruments, such as currency forwards
and futures contracts relating to the metal prices quoted on the LME (“London Metal Exchange”), are used
in order to hedge the volatility of raw material purchase prices, the main raw material being nickel, although
hedges are also arranged for other metals.
18Interim Management Report - First Half of 2021
Annual General Meeting
The shareholders at the Acerinox Group’s Annual General Meeting held telematically on 15 April 2021
approved the distribution of a dividend of EUR 0.50 per share, which was paid on 3 June 2021. This amount
represented shareholder remuneration of EUR 135 million.
The Meeting also approved the re-election of the following directors as members of the Board of Directors:
Tomás Hevia Armengol as Proprietary Director
Laura González Molero as Independent Director
Rosa María García Piñeiro as Independent Director
Marta Martínez Alonso as Independent Director
Nippon Steel Stainless Steel
In August 2020 Nippon Steel Stainless Steel vacated the Group’s Board of Directors and classified its
ownership interest as an available-for-sale asset.
On 17 June 2021, Nippon Steel Stainless Steel sold a 7.9% stake in Acerinox, half of its position, through an
accelerated bookbuilt offering.
19Interim Management Report - First Half of 2021
Alternative Performance Measures (Definitions)
Excellence 360º Plan: estimated efficiency savings for the 2019-2023 period
Operating Working Capital: Inventories + Trade receivables – Trade payables
Net Cash Flow: Results after taxes and minority interests + depreciation and amortisation
Net Financial Debt: Bank borrowings + bond issuance - cash
Net Financial Debt / EBITDA: Net Financial Debt / annualised EBITDA
EBIT: Operating income
Adjusted EBIT: EBIT, net of material extraordinary items
EBITDA: Operating income + depreciation and amortisation + variation of current provisions
Adjusted EBITDA: EBITDA, net of material extraordinary items
Debt Ratio: Net Financial Debt / Equity
LTIFR: (Number of Lost Time Injuries / Total Hours Worked) * 1,000,000
Net financial result: Financial income – financial expenses ± exchange rate variations
ROCE: Net operating income / (Equity + Net financial debt)
ROE: Results after taxes and minority interests / Equity
ICR (interest coverage ratio): EBIT / Financial expenses
20Interim Management Report - First Half of 2021
Disclaimer
This document has been drawn up in good faith on the basis of the data and facts available on the day of its publication
and should be read together with all the public information provided and/or published by ACERINOX, S.A.
This document may contain statements with regard to the future intentions, forecasts and estimates of ACERINOX, S.A.
and its business. These types of statements and/or contents may include declarations or expectations with regard to the
current plans, objectives and forecasts of the Company and its group, including declarations concerning trends or
circumstances which might affect its current financial situation and its ratios, results, strategies, production levels,
expenditure, costs, exchange rates, investments and/or dividend policy. It may also contain references to the situation and
trends of the raw materials market, especially nickel and chrome.
These statements and contents have been issued in good faith, upon the basis of the knowledge and information available
on the date of this announcement and, despite being reasonable, do not constitute a guarantee of future compliance.
These statements and contents are subject to risks, uncertainties, changes and situations beyond the control of
ACERINOX, S.A., meaning that they may not comply, in full or in part, with what is expected and/or declared.
Except to the extent required by the applicable law, ACERINOX, S.A. does not assume any obligation to publicly update
its future declarations and statements, even when new data are published or further unforeseen events which might affect
them arise.
ACERINOX, S.A. provides information on the above and other factors which may affect its future statements concerning
its business, expectations and/or financial results in the documents it submits to the Spanish National Securities Market
Commission. All interested parties are invited to view these documents.
Neither this document nor the information contained herein constitute an offer to sell, purchase or exchange, or an
invitation to make an offer to buy, purchase or exchange, or a recommendation or advice regarding any asset or financial
instrument issued by the Acerinox Group. Any person who acquires assets should do so upon the basis of their own
judgement after receiving the professional advice deemed appropriate. No kind of investment activity should be performed
upon the basis of the information or forecasts contained in this documentation.
Neither ACERINOX, S.A. nor its subsidiaries assume liability of any kind for the damages which may arise from any use
of this document or its contents.
21You can also read