Company Presentation 14th November 2017 - Italiaonline

Page created by Bobby Miranda
 
CONTINUE READING
Company Presentation 14th November 2017 - Italiaonline
Company Presentation
14th November 2017

                       1
Company Presentation 14th November 2017 - Italiaonline
Disclaimer
This presentation contains certain forward-looking statements that reflect the Company’s management’s current views with respect to future events and
financial and operational performance of the Company and its subsidiaries. These forward-looking statements are based on Italiaonline S.p.A.’s current
expectations and projections about future events. Because these forward-looking statements are subject to risks and uncertainties, actual future results
or performance may differ materially from those expressed in or implied by these statements due to any number of different factors, many of which are
beyond the ability of Italiaonline S.p.A. to control or estimate precisely, including changes in the regulatory environment, future market developments,
fluctuations in the price, and other risks. You are cautioned not to place undue reliance on the forward-looking statements contained herein, which are
made only as of the date of this presentation. Italiaonline S.p.A. does not undertake any obligation to publicly release any updates or revisions to any
forward-looking statements to reflect events or circumstances after the date of this presentation. The information contained in this presentation does
not purport to be comprehensive and has not been independently verified by any independent third party.

This presentation does not constitute a recommendation regarding the securities of the Company. This presentation does not contain an offer to sell or
a solicitation of any offer to buy any securities issued by Italiaonline S.p.A. or any of its subsidiaries.

Pursuant to art. 154-bis, paragraph 2, of the Italian Unified Financial Act of February 24, 1998, the executive in charge of preparing the corporate
accounting documents at Italiaonline S.p.A., Gabriella Fabotti, declares that the accounting information contained herein correspond to document
results, books and accounting records.

PRO FORMA 9M 2016
9M 2016 results have been normalized (pro-forma data) for an amount of revenues (-€ 15.7 million) and Ebitda (-€ 2.6 million) to reflect the change in
the perimeter due to the sale and termination of certain business lines (Europages subsidiary, 12.54 business and Moqu arbitration agreement on
Google Ad Sense market) in the course of 2016 and some changes in the directory publication calendar in 2017 vs 2016, and thus to enable
comparison with 9M 2017 results. 9M 2016 NFP, Unlevered FCF and Net Income are reported data. In the presentation the comparison with 9M 2016
results, only for Revenue and EBITDA is made versus 9M 2016 pro-forma (as before described).

                                                                                                                                                       2
Company Presentation 14th November 2017 - Italiaonline
Digital for growth
Our mission is digitizing Italian companies
.

                                              3
Company Presentation 14th November 2017 - Italiaonline
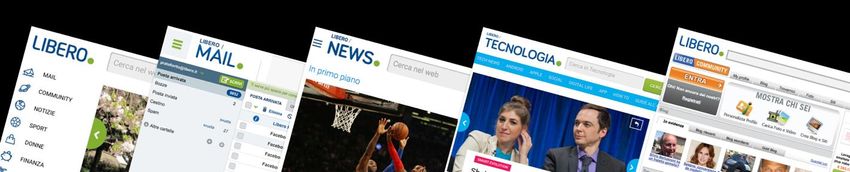
Italiaonline snapshot
                   We are the largest Italian internet company
                   and we provide a complete product portfolio                                                 Turin
                   to digitize Italian companies

                   FY 2016 Revenues                       FY 2016 EBITDA
                                                                                                                                                                63
                                                                                                                                                               AGENCIES
                   € 390 m                                € 67 m (1) (margin 17.2%)                                                                    Milan
                   2017 9M                                2017 9M
                   € 249 m                                € 56 m (margin 22.5%)
                                                                                                                        Florence
                   The undisputed Italian internet leader with
                   54% market reach(2)

                   Strong footprint on the territory
                   ●   63 SME Media Agencies with 812 sales rep (3)
                   ●   35 Large Enterprises accounts                                                                                            Rome

                   Diversified Customer base
                   ● 700 Large Enterprise(4)
                   ● 230,000 SMEs(4)
 (1)   Ebitda FY 2016 bef ore the write-down of Consodata S.p.A. trade receiv ables (€3.2m), as result of the decision to dispose the Company
 (2)   Audiweb Database, powered by Nielsen, TDA av g. 9M 2017
 (3)   # of activ e agents at the end of September 2017
 (4)   # of customers at the end of June 2017

                                                                                                                                                                          4
Company Presentation 14th November 2017 - Italiaonline
A history growth and of successfully executed M&A

                                          Matrix                          Successful                                                  Seat PG
        Spin Off                                                                                               Full speed                                  New Italiaonline
                                        Acquisition                       integration                                                Acquisition

                       (1)                               (2)                                                                  (3)                   (4)

   REVENUES                              REVENUES                        REVENUES                            REVENUES                REVENUES             REVENUES
   € 46 m                                € 51 m                          € 92 m                              € 96 m                  € 87 m               € 390 m
                                                                                                                                     EBITDA
   EBITDA                                EBITDA                          EBITDA                              EBITDA                  € 27 m               EBITDA
   € 19 m                                € 21 m                          € 22 m                              € 34 m                  EBITDA-CAPEX         € 67 m
                                                                                                                                     € 19 m
                                                                                                                                                          EBITDA-CAPEX
                                                                                                                                                          € 44 m

                                         REVENUES                                                                                    REVENUES
                                                                                                                                     € 365 m
                                         € 74 m
                                                                                                                                     EBITDA
                                         EBITDA                                                                                      € 17 m
                                                                                                                                     EBITDA-CAPEX
                                         € -27 m
                                                                                                                                     € -14 m

            2011                              2012                             2013                                    2014          2014
                                                                                                                                    2013 2015                   2016
                                                                                                                                                          20142014
 (1)   2011 pro-forma data to represent FY revenues since spin-off from Wind Telecomunicazioni occurred on March ’11
 (2)   EBITDA is adjusted for the Matrix acquisition cost of €2.1m
 (3)   EBITDA is adjusted for IPO costs effect (1.8€m)
 (4)   EBITDA is adjusted for extraordinary costs effect (8,0€m, mostly related to Seat deal)

                                                                                                                                                                              5
Company Presentation 14th November 2017 - Italiaonline
Rich digital product portfolio

 SME           Web Presence      Website and eCommerce   Digital Marketing

 Large                              AD Sales House
Accounts

Consumers

                                                                             6
Company Presentation 14th November 2017 - Italiaonline
Diversified Customer base
  ENTERTAINMENT                 TECHNOLOGY              AUTOMOTIVE   FOOD

TELECOMMUNICATION                 RETAIL            PERSONAL CARE    TRAVEL

                                             AGENCIES

 LARGE ACCOUNT 700 Customers                                                  SMEs 230K Local Customers
 Note: # of customers H1 2017

                                                                                                          7
Company Presentation 14th November 2017 - Italiaonline
Multiple revenues streams

                     2%
      € mln / %
                       6
                                                                   24%

  31%        77
                     9M 2017
                    REVENUES                             DIGITAL
                    €249 m                              REVENUES

                                   166      67%
                                                  76%

          Digital    Traditional    Other         SMEs             Large account

                                                                                   8
Company Presentation 14th November 2017 - Italiaonline
Management team of excellence

      Antonio Converti – CEO                         Maurizio Mongardi – COO
      37 yrs of Experience                           28 yrs of Experience

                                              NEW
                                             ENTRY
      Gabriella Fabotti – CFO                        Carlo Meglio – CDO
      25 yrs of Experience                           20 yrs of Experience

      Ivan Ranza – CCO SME                           Andrea Fascetti – CHRO
      23 yrs of Experience                           26 yrs of Experience

      Andrea Chiapponi – CCO Large account           Chiara Locati – IR
      20 yrs of Experience                           21 yrs of Experience

                                                                               9
Company Presentation 14th November 2017 - Italiaonline
Italiaonline for SMEs

                        10
Products to lead the digital transformation of Italian SMEs
                                                                                           Cloud Solutions
                                                                                              for SMEs

                                                                Digital Marketing

                                        Website and eCommerce

                                                                                                Coming
                     Digital Presence
                                                                                                 soon

      PagineGialle

 Customer
                      Acquisition             Retention                             Upselling
                                                                                                             11
We put the SME businesses where people search for it                                                                   Acquisition

  Presence

                                                                 We put your business where people search for it
  Acquisition and
  win back

     Cross and up
        selling     A familiar presence for Italian households
                                                                 Instragram Aroundme   Foursquare   Cy lex    Here     iGlobal    Inf obel   TomTom

                             113 books, one for each
  Custom Projects
                             Italian province(1)
                                                                   Waze      Nav mii    Whereto     Opendi   Pagine    Tutto     Ricercare    Brown
                                                                                                             Bianche   Città      imprese     Book

                             16.1 million copies                                        CAR NAVIGATION SYSTEMS
                             distributed to Italian
                             households and businesses(1)

(1) FY 2016 data                                                      Partner w ith

                                                                                                                                                 12
Cutting edge professional web site development                                                   Retention

 Presence

 Website

  Cross and up
     selling

                                                                                      80K
 Custom Projects

                   partnership    website and     Professional   responsive and   80,000 sites      live website
                   with Duda,     eCommerce       web design     mobile website    developed        creation with
                    Spotzer,     production and    with SEO          builder                         online web
                     Ecwid        maintenance     optimization                                         designer

                                                                                                             13
We do for SMEs what top AD agencies do for top brands

                   360° media service for SMEs                        Strategic partnership with
 Presence
                   Powered by

                         Trough the unique expertise
                         of               (100% controlled b y IOL)
 Website
                                Display                                        We have a unique sales network
                                Google Display Network (GDN)                   that our partners can rely on
                                Italiaonline Network

 Digital Mktg                   Social
                                Facebook                                      Unique offer proposition
                                Instagram

                                Search
 Custom Projects                Google AdWords
                                Bing

                                Remarketing
                                Tracking tag
                                Tagless Remaketing

                                Shopping
                                Ecommerce
                                Optimization

                                Email Marketing
                                Libero/Virgilio email
                                Third Party email
                                                                                                                14
Most advanced datacenter to deliver SME cloud applications

 Presence

                                                                                              Coming in
                                                                                                2018
 Website

 Digital Mktg

 Cloud

                                                            •   SaaS (Software as a Service)
                  Largest and most reliable datacenter in
                                                            •   Cloud storage and archiving services
                            Italy: Tier IV Gold             •   Hosting services
                                                            •   eCommerce services

                                                                                                          15
9M 2017 for SMEs

The order intakes of IOL Audience, a unique offering in Italy in media planning services dedicated
to SMEs, improved double digit in Q3 2017 YoY

                                       Powered by

                             Trough the unique expertise of

                                 (100% controlled by IOL)

                                          v1.1:                                   Marketplace to match
       Web Customer care                                        Geo targeted          homeowners
       with new products                                         commercials
                             Performance          Google                            & pre-screened
           dashboard                                           on Sky channels
                             Display ADV          Call only                       service professionals

        IOL4YOU                  IOL Audience                 Sky AdSmart        PagineGialle Casa

                                                                                                          16
Italiaonline
Large Account

                17
Leader digital AD sales house with best programmatic skills

                  DIRECT SALES                        50%                    PROGRAMMATIC SALES       50%

 ● Human sales to advertisers and Media Centers                   ● Deals (Human & Machine2machine)
 ● Both branding and performance goals                            ● Open market (Machine2machine)

                                     DMP (Data Management Platform)
                                   Leveraging proprietary data for inventory enrichment
                                   and multivariable targeting
                                   ● 17 m users (TDA)
                                   ● 8 m email subscribers
                                                                                                        18
The largest Italian advertising inventory

Online ADs      Display 3.5 bln                         monthly
                                                        impressions   Video        110 mln          monthly
                                                                                                    impressions

                             Traditional and innovative                     Top notch “viewability” and
                             formats                                        completion rate
 Cross and up
    selling
                                        7%

                                                                                            28%
   Custom
   Projects                                       43%                       53%
                             50%

                                                                                         18%

                 Premium            Open market      Private deals    Premium     Open market     Private deals

                                          57% programmatic                            72% programmatic
                Source: internal data 9M 2017

                                                                                                                  19
The most active email accounts

Online ADs   Email Marketing                                      9.8 mln                  active accounts (1)

                                                                  3.6 bln                exchanged messages (2)

Direct
Marketing
                                                                                 time spent
                                                                                 per person               2:17        1:14

  Custom
                                                                                                                             (4)
  Projects                                                                                                            18.2

                                                                                                                9.6
                                                MAUs(3) (mln)
                                                                                          5.7
                                                                      3.7
                                                   2.0
                  Libero Mail Saas

                  Subscription services
                                          (1)   Source: internal data, 90 days active mailboxes, avg. 9M 2017
                                          (2)   Source: internal data, 9M 2017
                                          (3)   Source: Audiweb View, powered by Nielsen, TDA avg. 9M 2017
                                          (4)   Includes Android & Google accounts

                                                                                                                                   20
One-stop-shop digital marketing solutions for leading brands

Online ADs
              Bespoke solutions                           Programmatic buy-house
                                                          ● Best of breed campaign management
                                                            buying platforms (DoubleClick/Google)
Direct                                                    ● Full access to Italian and international
                                                            inventory and global AD Exchanges
Marketing
                                                          ● Accurate targeting through first and third
                                                            party data
Custom                                                    ● Performance and branding campaigns
Projects

              ● Branded content
              ● Creative formats
              ● Websites and mini-sites
              ● 20% Customer base benefits from bespoke
                solutions

                                                                                                         21
9M 2017 for Large Accounts

                                                    IOL Advertising grew double-digit YOY figures on revenues
                                                    in Q3 2017 and Q2 2017 vs a flat market1 in first 9M 2017

                                                                                          IOL is the
     New portal project superEva:                       Italiaonline is the advertising   advertising sales        IOL acquires the     IOL signs a
     monthly Visits 9M 2017:                            sales agency for Lettera43 the    agency for 3Bmeteo       food portal          partnership
     5.7 mln / +128% FY 2016.                           important Italian news website    the top w eather         Buonissimo,          w ith AppNexus
                                                                                          forecast site            one of the Top 5     for the use of
                                                                                                                   Italian food sites   Opensource
                                                                                                                                        Prebid
                                                                                                                   1 mln MAUs w itch    technology to
                                                                                          IOL is the advertising   features over        increase
                                                                                          sales agency for         8.000 recipes and
      Italiaonline is the advertising                   The new Virgilio Video is the                                                   programmatic
                                                                                          FattoreMamma a
      sales agency for Sportube                         Italiaonline mediacenter with a                            a new video          sales
                                                                                          netw ork of 34           tutorial section.
      the first sport webtv in Italy                    wide library constantly updated   important blogs of
                                                                                          Italian moms.

  7th February                   18th May               24th May              30th May            18th Jul              04th Sep             11th Oct

                                                   1H                                                                        2H
   (1) Source: FCP-Assointernet, Jan –Sept 2017.

                                                                                                                                                         22
Web Properties

                 23
libero.it | leader email and digital service provider

                                                                          AUDIENCE PLATFORM

                                16.9 mln                                                                                                      9.8 mln
                                   MAUs        (1)                                                                                   FREE SUBSCRIBERS(2)

     9.1 mln                            29.1%                                1.5 bln                                   8.0 mln                                      2:07 h
  Unique Audience (1)               Market Reach (1)                        Page Views        (1)                Active Subscribers (2)                        Average Time Spent (1)
                                                                                                                                                                   Per Person
                        (1)   Source: Audiweb View, powered by Nielsen, TDA av g. 9M 2017 | (2) Source: internal data, 90 day s activ e mailboxes, av g. 9M 2017

                                                                                                                                                                                        24
virgilio.it | engaging content and city portals

                                                                          AUDIENCE PLATFORM

                                16.8 mln                                                                                                      9.8 mln
                                   MAUs        (1)                                                                                   FREE SUBSCRIBERS(2)

    11.6 mln                            37.2%                                0.4 bln                                   1.8 mln                                      0:24 h
  Unique Audience (1)               Market Reach (1)                        Page Views        (1)                Active Subscribers (2)                        Average Time Spent (1)
                                                                                                                                                                   Per Person
                        (1)   Source: Audiweb View, powered by Nielsen, TDA av g. 9M 2017 | (2) Source: internal data, 90 day s activ e mailboxes, av g. 9M 2017

                                                                                                                                                                                        25
paginegialle.it | online directory and home services marketplace

     4.2 mln              13.4%                        12.4 mln                                   16.1 mln              0:06h
  Unique Audience (1)   Market Reach (1)               Page Views         (1)                 Copies distributed   Average Time Spent (1)
                                                                                                                       Per Person
                                     (1)   Sour ce: Audiw eb View , pow er ed by Nielsen, TDA avg. 9M 2017

                                                                                                                                            26
Innovative content factory based on internet trends

       Data Driven Publishing
       Topics selection based on real-time
       search and social trends
                                             1.8 mln                          1.8 mln                   1.5 mln

       Content Factory
       Content production based on
       crowdsourcing and/or content
       syndication                           1.3 mln                          1.0 mln                   0.7 mln

       Engagement
       Proprietary tools for optimizing      1.1 mln                          0.8 mln                   0.6 mln
       engagement rate and making
       contents go viral
                                             Source: Audiweb View, powered by Nielsen, TDA Sept. 2017

                                                                                                                  27
The undisputed Italian internet leader | average daily audience 2016
      TDA DAUs (mln)

                                                                                                                                 10:31
                                                                                                                             Time per person
                                                                                                                                 (mm:ss)
4.3

                                                                                                                       2.1
      BUBBLE SIZE DAILY PAGE VIEWS (mln)                                                                                               Mobile
                                                                                                                                     DAUs (mln)

      Source: Audiweb Database, powered by Nielsen, Av g. FY .2016 | Google and Facebook are not in Audiweb Database
      Note: TDA – Total Digital Audience | DAUs – Daily Activ e Users

                                                                                                                                                  28
Daily Audience | Month of September 2017
             TDA
           DAUs (mln)                                                                                                                  12:01
                                                                                                                                   Time per person
                                                                                                                                      (mm:ss)

        +9% yoy

4.8

                                                                                                                                                        +12% yoy

                                                                                                                                                     2.5
      BUBBLE SIZE DAILY PAGE VIEWS (mln)                                                                                                              Mobile
                                                                                                                                                     DAUs (mln)

      Source: Audiweb Database, powered by Nielsen, September 2017 | Google, Facebook and Microsof t are not in Audiweb Database
      Note: TDA – Total Digital Audience | DAUs – Daily Activ e Users

                                                                                      November 13, 2017                                                           29
Market Outlook

                 30
Internet is driving the advertising market growth
 12.0

        YoY growth                                        +3.5%                 +0.9%
 10.0

        TOTAL €b                    7.9                    8.2                   8.3
  8.0                                                                             0.6
            Other                   0.6                     0.6                   0.4
            Radio                   0.4                     0.4
                                                -5.8%      1.1          -7.4%    1.1
            Press                   1.2
  6.0

                                                +8.0%      2.3          +7.7%    2.5
          Internet                  2.1
  4.0

  2.0           TV                  3.6         +5.2%      3.8          -0.5%    3.8

  0.0

                                                        Titolo asse
                                  2015                    2016                  2017
                                                                                forecast

 DIGITAL SHARE                            27%                     28%                      30%

        Source: Nielsen, Nov ember 2017

                                                                                                 31
Internet is driving the advertising market growth

   YoY growth                                        +8.0%                        +7.7%

    €b            2.1                                   2.3                       2.5

                                   +11.5%                                +9.3%
                                                                                             ● Programmatic sales
                                                                                             ● Google and Facebook partnership
                                                                                  2.00
                                                      1.83
                 1.64
                                                                                             TOP 4 Sales House

                                                                                                                 ≃ 10 Middle sized
                                                                                                                                       >50 (long tail)
                                                                                                                    Sale House

                 0.47               -4.3%             0.45              +1.0%     0.45           ≃50%                ≃30%
                                                                                                                                     Small Sales House

                                                                                                                                         ≃20%

                2015                                 2016                         2017
                                                                                  forecast

   Source: Nielsen, Nov ember 2017 | Others: operators not associated with FCP.

                                                                                                                                                         32
Internet Advertising Market in Europe (2016)

% Internet ADV on Tot ADV*                                                                                              UK

                                                                                                                             SWEDEN

                                                                                          NETHERLANDS

             EUROPE          42
                                                                                                       FRANCE

                          27,3                                                                                               RUSSIA

                                                            GERMANY                                             ITALY

                                                                                                                    12,2
                               BUBBLE SIZE IS INTERNET AD SPENDING (€b)                                                               % 2016 Revenue Growth
 Source: IAB Europe, Adex Benchmark 2016 (May 2017) | (*) Source: ZenithOptimedia,   via eMarketer March 2017       EUROPE

                                                                                                                                                              33
Italy is the country of SMEs, there is a substantial room for growth

Italian SMEs represent 68.0% of the total added value over the national economy,
the highest ratio among main European Countries

              Italy                                Spain               France           UK
              68.0%                                61.3%               57.8%            52.1%

                                                                    Number of SMEs
                                                                                                SME Customers: 230,000
                                                           Number                      %
                                                                                                Market penetration: 6.1%
 SMEs                                                      3,733,146                 99.9%

 Corporates                                                 3,086                     0.2%      Large Account Customers: 700

 Total                                                     3,736,232                 100.0%     Market penetration: 22.7%

Source: European Commission, 2016 SBA Fact Sheet

                                                                                                                            34
Growth Strategies
Organic & M&A

                    35
Six organic growth pillars

          1      Churn Reduction            2              Win Back      3                Up Selling

           ● Shift to evergreen contracts   ● Improve penetration in     ● Multi channel strategy
SMEs                                                                       based on ARPA
           ● Dedicated retention team         segments w/o web
           ● Customer profiling for churn   ● Win back on web Customer   ● Maximize digitization of
             prevention                     ● Improve sales channel        Customers
                                              balance                    ● Focus on website sales

          1       Custom Projects           2         Programmatic       3          3rd Party Sales

          ● Special Advertising             ● Rich Inventory             ● Acquire third party inventories
          ● Branded Content / Native        ● Header Bidding / Google    ● Increase market share
Large       Advertising                       Exchange Bidding           ● Grow brand portfolio and
Account   ● Digital Marketing Solutions     ● Programmatic Sales House     audience

                                                                                                             36
Investments and M&A opportunities

                        CLOUD                                COMMERCE                                    CONTENT

              Acquire applications and/or
                                                        Acquire e-commerce and               Acquire premium content and
STRATEGY    technology company to improve
                                                         marketplaces company                     creative platforms
               product portfolio for SMEs

                                                    ● Develop the “Made in Italy”           ● Increase market share and
             Strengthen Italiaonline market           marketplace                             advertising inventory
OBJECTIVE   position in digital offer for SMEs      ● Improve local growth trhough          ● Acquire valuable customers’
                                                      switching and gig economy               segments

            Revenues increase and improve
                                                     Revenue increase and complete          Revenues increase and improve
RESULTS            marginality through
            disintermediation and synergies                 offer for SMEs                         growth speed

                                         Other small opportunistic targets may also be considered

                                                                                                                            37
M&A opportunities – Tax Assets

                                  Tax assets as of 31 Dec. 2016 €808 m

   Tax Assets
 would provide
   a tax shield
in any M&A deals
                          210                                         599
 which involve the
 consideration of
                     Generated by previous        Generated from non-deducted interest expenses
      profits          Company losses                         (accumulated by SEAT)

                                                                                                  38
Financial
Overview

            39
9M 2017 | Financial highlights

            In Q3 2017 recovery of digital segment and in particular of Digital ADV reduces the revenues decline

            9M 2017 Revenues at € 249 m vs € 280 m pro forma(1) 9M 2016

            Increasing profitability: +5.7% yoy Ebitda, Ebitda margin 22.5% + 3.6 pp vs 9M 2016

            Still good cash flow generation: Unlevered FCF €51 m (+5% yoy), Ebitda Cash Conversion(2) 91%

            Positive Net Financial Position at €77 m, vs € 69 m at 30 June 2017

            Increased Audience(3) :                                 +18% Mobile DAUs                                +10 % Time per person                                      +5% TDA DAUs
(1) 9M 2016 nor malized r esults (pr o-for ma data) for an amount of r evenues (-€ 15.7 m) and Ebitda (-€ 2.6 m) to r eflect the change in the per imeter due to the sale and ter mination of cer tain
    business lines (Eur opages SA, 12.54 business and Moqu ar bitr ation agreement on Google Ad Sense mar ket) in the cour se of 2016 and some changes in the dir ector y publication calendar in 2017 vs
    2016 and thus to enable compar ison w ith 9M 2017 r esults. 9M 2016 Ebit and Unl FCF r epor ted data.
(2) Cash Conver sion = Unl. FCF / EBITDA Repor ted - (3) Sour ce: Audiw eb Database, pow er ed by Nielsen, figur es aver age 6M: Mar - Aug 2017, YOY per fomance | TDA: Total Digital Audience, DAUs: Daily Active User

                                                                                                                                                                                                                 40
9M 2017 | Improved profitability and still good cash generation
    € mln, except for percentages
                                                                                               EBITDA growth due to cost
                                                                                             efficiency, more than 60% (2) not
                              (11.1%)                                                          related to revenues decline

                                 249                                                                                                              EBIT growth also due to
                                                                                          +5.7%                                                  decrease in D&A, write off
                                                  (8.8%)                                                                                         and in non-recurring costs
                                                                                          22.5%                                                                                                       +4.7%
                                  Q3
                                  82
                                                                  18.9%
                                                                                                                                              +13.1 € mil
        280
                                                (9.1%)
                                  Q2
                                  96                                                        56                                                                                                           51.0
                                                                                                                                                                                 48.8
                                                                    53                                                                             24.4
                                                (16.0%)
                                  Q1
                                  70                                                                                       11.3
     9M 2016                  9M 2017                           9M 2016                 9M 2017                          9M 2016                9M 2017                       9M 2016                 9M 2017

                REVENUES1                                                   EBITDA1                                                 EBIT                                             Unlevered FCF

(1) 9M 2016 results hav e been normalized (pro-f orma data) f or an amount of rev enues (-€ 15.7 million) and Ebitda (-€2,6 million) to ref lect the change in the perimeter due to the sale and termination of certain
    business lines (Europages subsidiary , 12.54 business and Moqu arbitration agreement on Google Ad Sense market) in the course of 2016 and a new directory publication calendar in 2017 v s 2016 and thus to
    enable comparison with 9M 2017 results
(2) Figure ref erred to IOL core business only

                                                                                                                                                                                                                      41
9M 2017 | Digital segment leads revenues trend recovery
    € mln, except for percentages (YoY performances)

                                                             249
                                                                                                                                                      166
                                                                               (8.8%)                                                                                      (0.5%)
                                                             Q3                                                                                         Q3
                                                             82                                                                                         53

                                 280                                                                                       181
                                                                              (9.1%)                                                                    Q2                  (7%)
                                                              Q2
                                                              96                                                                                        58

                                                             Q1              (16.0%)                                                                    Q1                (15%)
                                                             70                                                                                         54

                              9M 2016                     9M 2017                                                       9M 2016                     9M2017

                                         REVENUES1                                                                          DIGITAL REVENUES

(1) 9M 2016 results hav e been normalized (pro-f orma data) f or an amount of rev enues (-€ 15.7 million) and Ebitda (-€2,6 million) to ref lect the change in the perimeter due to the sale and termination of certain
    business lines (Europages subsidiary , 12.54 business and Moqu arbitration agreement on Google Ad Sense market) in the course of 2016 and a new directory publication calendar in 2017 v s 2016 and thus to
    enable comparison with 9M 2017 results.

                                                                                                                                                                                                                          42
9M 2017 | 65% of costs saving is structural
           Cost saving
            32.1 €m

              65%

                                                   11%
                                                                                                                             100%
              35%
                                                   89%
                                                                                      100%                            100%
              TOT                               Industrial                         Commercial                         G&A    Labour

                                                                Structural costs saving                Revenues Related

Note: Based on 9M 2017 vs 9M 2016 Pro-forma figures referred to Core business costs only | Italiaonline+DLS+Moqu

                                                                                                                                      43
9M 2017 | From EBITDA to Net Result

              55.9           24.6                                                                                 mainly related to the issue of net
                                                                                                                  deferred taxes that will not have any
                                                                                                                  effects on the cash

   9M                                               3.9
                                                                          3.0             24.4       0.8             17.2
  2017
                                                                                                                                      8.0
  € MLN

              EBITDA   Ope rating D& A a nd    Non opera ting      Non-re cur ring and    EBIT   Net Financials      Taxes          Net result
                           write-down         amortizatio n a nd   restructurin g costs
                                                write-down

              55.4           32.2

   9M                                                                                                               23.7            35.2
  2016                                              4.7
 reported                                                                 7.2                        0.2
                                                                                          11.3
  € MLN

              EBITDA   Ope rating D& A a nd    Non opera ting      Non-re cur ring and    EBIT   Net Financials      Taxes          Net result
                           write-down         amortizatio n a nd   restructurin g costs
                                                write-down

                                                                                                                                                      44
9M 2017 | Capex and Ebitda Cash Conversion
   € mln       Net of one-off investments 9M 2017 capex were €15.7m, down 5.3% YoY, at 6.3% of revenues

                                                                                                            EBITDA Cash Conversion**:
                                                                                                          improved despite Capex increase

                       One-off investments                       8.4%
                                                     21.0      on revenues
                                                                                                                         91%

                                                                                              88%
  5.9%                                               5.4
on revenues
                        16.5                                            6.3%
                                                     15.7             on revenues
                                                                                                                       51.0
                                                                                              48.8

                                          CAPEX                                                      Unl FCF

   * Revenues 9M 2016 pro-forma
   ** Cash Conversion = Unl. FCF / EBITDA Reported          9M 2016                 9M 2017

                                                                                                                                            45
9M 2017 | Improved positive Net Financial Position
 € mln                                 Extraordinary
                                       Dividend
                                       Distributed May 10 th
                                       2017

                    122

                    80
         80
                                                                               77
                                                    69

         42        41.5

                   FY2016                         H1 2017                     9M 2017
                                        Net financial position

                 At Dec. 31st , 2016                    At June. 30th, 2017             At Sep. 30th, 2017

                                                                                                             46
9M 2017 | Change in Net Financial Position
                                                     Cash Flow from operating activities
                                                                   55.2

                                                    72.4             0.3             16.9        80.0

        122.1
                              21.0

                                                                                                              0.7         77.0
                                                                                     156.3
                                                    51.0
                                     Unlevered Free Cash Flow
                                   Ebitda Cash Conversion 91% (1)
                                         vs 88% in 9M 2016

   NFP Dec. 31,              Capex                  OFCF       Income Taxes     Extr. and non   Dividend     Other     NFP Sep. 30,
      2016                                                                        recurring                movements      2017
                                                                                 expenses

  (1) Cash conversion = Unl FCF / EBITDA Reported

                                                                                                                                      47
Business plan 2017-2019 guidelines (organic growth only)

   Revenues                              Revenues are expected to grow with a CAGR 2015 - 2019 of [0%÷0.4%]

   EBITDA                                Stedy growth of marginality to reach 22%÷27% EBITDA margin in 2019

                                         CAPEX expected to decline during the plan and to stabilize at about 6% of revenue in 2019
   CAPEX

   FCF                                   Free cash flow generation to improve during the plan and reach the 55%÷60% cash
                                         conversion of the EBITDA from 2018

 2017 guidance confirmed
 - Revenue is expected to continue to decrease, mainly because of the physiological contraction of some traditional
   businesses, despite the gradual improvement in the performance of digital activities
 - Profitability: Ebitda margin improvement vs FY 2016

   BP as approv ed by the BoD of March 15th 2017

                                                                                                                                     48
Italiaonline Share
IOL versus indices: June 20, 2016 – November 02, 2017                                                                           Shareholders structure
                                Pr ez z o di r i fer i men to   ( bas e al 20/06/20 1 6   = 100)
180
                           Volumi              Italiaonline             FTSE MIB               FTSE Italia Small Cap

160

140

                                                                                                                                  (*) GoldenTree Asset Management Lux S.à r.l., GoldenTree SG Partners L.P., GT NM L.P. e San
                                                                                                                                  Bernardino County Employees Retirement Association

120

                                                                                                                               Share data as of November 02, 2017
                                                                                                                               MARKET                                                                                           MTA
100
                                                                                                                               NOSH Ord (€mln)                                                                                  114.8
                                                                                                                               PRICE (€)                                                                                          3.4
                                                                                                                               MKT CAP Ord (€mln)                                                                                390
 80
                                                                                                                               PERFORMANCE (from June 20, 2016)                                                            +66.5%
                                                                                                                               RELATIVE PERF.vs FTSE MIB (from June 20, 2016)                                               33.7%
                                                                                                                               AVG DAILY VOLUMES YTD (€)                                                                  324,538
60
20-giu-16 03-ago-16 19-set-16 02-nov-16 16-dic-16      01-feb-17 17-mar-17 05-mag-17 20-giu-17 03-ago-17 19-set-17 02-nov-17   Saving Share: NOSH 6.803 | Closing Price (€) 300 | Market Cap (€ mln) 2.0

Source: Thomson Reuters EIKON

                                                                                                                                                                                                                            49
IOL vs Baskets of Peers (average values)
          EBITDA Margin 2017E
30.0%

                                                                                                                                            Intl internet
                    YP players

25.0%                                                                                                D&H                                          17.7
                       4.1
                                                                                               9.9

20.0%                               5.0
                                                                                                                    Intl publishers
                                                                                           Ita internet
15.0%                                                                                                                      13.9
                                                  Ita publishers                     9.0

10.0%                                                           7.5

 5.0%
        3.0                   5.0                     7.0                      9.0                    11.0   13.0                 15.0   17.0               19.0

 Source Thomson Reuters EIKON – data as of 02 Nov 2017 and company analy sis               EV/EBITDA 2017E

                                                                                                                                                            50
Investment Case

                  51
Key investment highlights

 1   Largest internet company in Italy, best positioned to capture market growth

     Market opportunities – Increasing Digital Advertising Market - Internet usage in Italy still lags
 2   compared to European Average

 3   Solid geographical footprint and sales network in Italy

 4   High quality/diversified Customer base

 5   Unique capability to digitize Italian SMEs, technological partnership with leading internet
     player and strategic relationship with Google and Facebook

 6   Clear path to sustainable profitable growth

 7   Experienced management team with a solid track record in M&A execution

                                                                                                         52
Appendix

           53
Group Structure as of 30 June 2017

                                                                                                                                Golden Tree

                                                                                                                                       100%              MOQU ADV S.r.l.(2)
   11 88 0 Solutions AG          16.24%                                                                                                                                       CORE
        (Germany)                                               Italiaonline S.p.A.                         (1)
                                                                                                                                                                              BUSINESS
                                                                                                                                       100%                Digital Local
                                                                                                                                                          Services (DLS)(3)

                                 100%                                                                                                                   100%

                    Pronto Seat S.r.l.                                                                                                  Consodata S.p.A.(4)

              (1)   Italiaonline also holds a 20% stake in Gold Fiv e S.r.l. “in liquidazione”, a 100% stake in Couponing Italia S.r.l. “in liquidazione” and a 100% stake
                    in Telegate Holding Gmbh “in liquidazione”
              (2)   Moqu Adv S.r.l. holds a 100% stake in Moqu Adv Ireland Ltd “in liquidazione”
              (3)   63 activ e territorial units (“DLS”) established as single shareholder limited liability companies directly owned by Italiaonline S.p.A.
              (4)   As the plan of Parent Company to sell the equity holding in Consodata S.p.A. has been put on hold, the assets and liabilities ref erred to this
                    company were no longer classif ied “net non-current assets held f or sale”, pursuant to IFRS 5.

                                                                                                                                                                                         54
Financial Road Map | Jan 2016 – May 2016

        20/01/’16                             05/05/’16                                                                                  08/05/’17
        BoDs approves                         BoDs approve                                                                               Ex-dividend date
        the Merger Plan                       Q1’16 results
                                                                                                                                         10/05/’17
                                              12/05/’16                                                09/11/’16                         Dividend
                                              Shareholders’ meeting to                                 BoD of IOL                        payment date
                      08/03/’16               change the Com pany                                      approves
                      Shareholders’           nam e and approve the                                    9M’16
                      meetings to             reverse stock split                                      results                   06/04/’17
                      approve the             (1,000:1)                                                                          Shareholders’
                      Merge                                                                                                      request to
                                                                                                            14/12/’16            distribute an
                                                                                                                                 extraordinary
                          15/03/’16                    20/06/’16                                            Trade union
                                                                                                            agreement            dividend
                                                       Debut of the m erged Company
                          BoDs
                                                       at Milan Stock Exchange
                          approve                                                                                                27/04/’17
                          FY’15                                                                                                  Ordinary and
                          results                                  22/07/’16                                                     special saving
                                                                   Anticipated exit from                                         shareholders’
                                                                   Consob black list                                             meetings

 Jan.       Feb.     Mar.           Apr.   May     June        Jul.      Aug.      Sep.     Oct.     Nov.        Dec.     Jan.   Feb.     Mar.        Apr.       May
 2016       2016     2016           2016   2016    2016       2016       2016      2016     2016     2016        2016     2017   2017     2017        2017       2017

                                                                                04/08/’16                                                         15/03/’17
                                                                                BoD of the merged Company                                         BoD approves the draft
                                                                                approves H1’16 results                                            financial statement for the
                                                                                                                                                  year ‘16 and the business
                                                                                                                                                  plan update

                                                                                                                                                                          55
Thank you!
IR Contacts
Chiara Locati
+ 39 349 8636553
chiara.locati@italiaonline.it

                                56
You can also read