OCEAN FREIGHT MARKET UPDATE - November 2019 DHL Global Forwarding, Freight Dominique von Orelli - Global Head, Ocean Freight
←
→
Page content transcription
If your browser does not render page correctly, please read the page content below
PUBLIC

DHL Global Forwarding, Freight

OCEAN FREIGHT
MARKET UPDATE
November 2019
Publication Date 1st November 2019
Dominique von Orelli – Global Head, Ocean Freight

                                                        1
PUBLIC

Contents

    TOPIC OF THE MONTH
    DHL introduces “IMO 2020 Compliance Cost Surcharge“

    HIGH LEVEL DEVELOPMENT

    MARKET OUTLOOK
    Freight Rates and Volume Development

    ECONOMIC OUTLOOK & DEMAND DEVELOPMENT

    CAPACITY DEVELOPMENT

    CARRIERS

?   DID YOU KNOW?
    Top 12 Container Carriers’ Order Books

                                                          DHL Global Forwarding | OFR Market Update | November 2019       2
                                                                                                                          2
Topic of the Month
 DHL introduces “IMO 2020 Compliance Cost Surcharge”
IMO 2020 regulation impacts the entire shipping industry

              Background : IMO 2020 introduces a new marine fuel regulation, which limits the sulphur emissions caused by marine fuels. The new
              sulphur level regulation is intended to reduce the amount of air pollution generated by the shipping industry and improve air quality. To
              date, ships have been able to use high sulphur fuel oil (HSFO) with a sulphur content of up to 3.5%. IMO 2020 requires using fuel with a
              sulphur content of 0.5 % or lower and will come into effect as of 1st January 2020.

Ocean Carriers have three options to be compliant with the new regulation: Converting to more expensive low-sulphur fuel oil (LSFO 0.5%), using
Exhaust Gas Cleaning Systems (EGCSs) also called scrubbers or deploying ships powered by liquefied natural gas (LNG).

After the evaluation of the three options, ocean carriers are full steam preparing for the implementation of the new sulphur cap. It is clear that this
change affects the entire shipping industry and the cost of compliance with the new regulation is significant and will severely impact the overall
transportation costs. The ocean carriers, as well as the forwarders, will not be able to absorb these additional costs. Many ocean carriers have already
announced that they will replace their existing fuel charges and introduce a new fuel recovery mechanism.

In order to simplify the complex tariff structure, DHL Global Forwarding will implement a so-called “IMO 2020 Compliance Cost Surcharge” as of
December 1st 2019 (sailing date). The implementation and methodology of the “IMO 2020 Compliance Cost Surcharge” has been announced to our
customers in October 2019.

In case of clarification needed please contact your local Ocean Freight Management or Sales Representation.

Source: DHL

                                                                                                DHL Global Forwarding | OFR Market Update | November 2019   3
                                                                                                                                                            3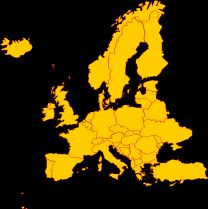
PUBLIC
High Level Market Development – Supply and Demand
ECONOMIC OUTLOOK GDP GROWTH BY REGION1) DHL TRADE BAROMETER6) SUPPLY/DEMAND GROWTH
SUPPLY/DEMAND GROWTH (ANNUALIZED),
(ANNUALIZED),ININ
%%2) 2)
CAGR 75 Demand
2019F 2020F 2021F 2022F 2023F Sep19 index 6%
(2020-23) 70 predicts Sep-
Growth
65 Nov19 trade 5% %
EURO 1.4% 1.2% 1.4% 1.6% 1.6% 1.5%
60 development 4%
MEA 1.9% 2.8% 2.9% 3.1% 3.3% 3.1%
55
AMER 2.4% 2.1% 1.8% 1.6% 1.6% 1.9% 50
3%
ASPA 4.5% 4.3% 4.4% 4.4% 4.5% 4.4% 45 Ocean 2%
Supply
40 Global 1% Growth %
DGF World 2.7% 2.7% 2.8% 2.8% 2.8% 2.8% 35
30
0%
Q1 Q2 Q3 Q4 Q1 Q2 Q3 Q4 Q1 Q2 Q3 2018 2019F 2020F 2021F 2022F 2023F
’17 ’18 ’19
WORLD CONTAINER INDEX (WCI)3) SHANGHAI CONTAINERIZED FREIGHT INDEX (SCFI)4) BUNKER PRICES5)
3,000 1,200
1,100
2,500
1,000
2,000
900
1,500 800
700
1,000 Actual Actual
600
500 Forecast Forecast
500
0 400
Q1 Q2 Q3 Q4 Q1 Q2 Q3 Q4 Q1 Q2 Q3 Q4 Q1 Q2 Q3 Q4
’18 ’19 ’18 ’19
1) real GDP, Global Insight, Copyright © IHS, Q3 2019 . All rights reserved. 2) Demand growth = Port-to-Port Container Traffic growth. Supply growth = Fleet Growth. Source: Drewry Maritime Research. 3) Drewry, in USD/40ft container, including BAF & THC both ends, 42 individual routes, excluding intra-Asia
routes. 4) Shanghai Shipping Exchange, in USD/20ft container & USD/40ft ctnr for US routes, 15 routes from Shanghai. 5) Source: DHL. 6) DHL Global Trade Barometer Jun19, index value represents weighted average of current growth and upcoming two months of trade, a value at 50 is considered neutral,
expanding above 50, and shrinking below 50.
DHL Global Forwarding | OFR Market Update | November 2019 4
4PUBLIC
Market Outlook November 2019 – Major Trades
Overall tight space situation out of Asia. GRI announced as of Nov 1st.
EXPORT REGION1 IMPORT REGION CAPACITY RATE EXPORT REGION IMPORT REGION CAPACITY RATE
AMNO = = AMNO = =
EURO AMLA
AMLA = = ASPA = =
ASPA -- + EURO = =
MENAT -- + MENAT = =
SSA = = SSA = =
AMLA = = ASPA - =/+
AMNO ASPA
ASPA = = AMNO - +
EURO = = AMLA + ++
MENAT = = EURO - +
SSA = = MENAT - +
OCEANIA + ++
Strong Moderate No Moderate Strong
KEY ++ + = - --
Increase Increase Change Decline Decline
Source: DGF
DHL Global Forwarding | OFR Market Update | November 2019 5
5PUBLIC
Market Outlook November 2019 – Ocean Freight Rates Major Trades
Market outlook on smaller trades available in the back-up
OCEAN FREIGHT RATES OUTLOOK
The golden week blank sailing program is in full swing and space is getting tight, thus carriers are planning another round of GRI for1st
ASPA – EURO
November.
Space constraints coming up mid/end of November, as a result of the golden week in far east and several blank sailings on account of the
EURO – ASPA & MEA ongoing scrubber upgrades. First PSS announcements received. This will also affect the empty equipment situation throughout Europe,
especially the hinterland availability and will have a cascading effect on the connected trades i.e. ME / IPBS and AU&NZ.
Space is tight due to the post golden week and Christmas rush. Carriers are reporting to have severe rollover situation, the most in WCSA.
ASPA – AMLA
Reason is a major capacity withdrawal. Rates are on the uptrend for ECSA and WCSA.
Carriers continue extensive blank sailings in Oct/Nov and winter program into USEC (THE alliance) to stabilize market. Potential cargo rush
ASPA – AMNO
in Nov prior to tariff impact expected.
EURO – AMNO Space to North Atlantic (NYC, Norfolk) remains tight, situation to South Atlantic is expected to ease in the upcoming weeks.
Tight space situation due to carriers’ capacity control plans ex Asia with blank sailing plan already in place. Expect a stabilized freight
ASPA – MENAT
environment in November. GRI announced for 1st November.
Blank sailings planned for IPBC services, space is expected to be tight in order to push the freight rates back to a sustainable level. Carriers
ASPA – ASPA
are announcing GRI in the range of USD150/TEU as of 1st Nov.
AMNO – EURO Rates have been extended through end of Q4 2019. Capacity remains stable.
Source: DGF
DHL Global Forwarding | OFR Market Update | November 2019 6
6PUBLIC
Economic Outlook & Demand Development
Rising trade policy uncertainty is weighing heavily on capital spending
Industrial output, construction, & retail sales have declined recently pointing to flat real GDP in Q3, with contractions in DE & IT. Eurozone real GDP
growth is projected to slow from 1.9% in 2018 to 1.1% this year and 0.8% in 2020. Meanwhile, the UK has made little progress toward ratifying a EU
EURO
withdrawal agreement. Negligible real GDP growth is expected in H2 ‘19, followed by a modest acceleration in early 2020 due to precautionary
purchases ahead of the extended Brexit deadline.
In the US real GDP growth slowed to a 2.0% annual rate in Q2, down from 3.1% growth in Q1. Third quarter data are likely to show a further
AMNO deceleration. Data on the US financial accounts through Q2 show considerably more household wealth than previously reported. While this will
support consumer spending in quarters to come, recent monthly data on consumer spending and retail sales were disappointing.
Sales tax in JP was raised again on 1 Oct ‘19 from 8% to 10%. The impact may be muted thanks to several factors. First, the Rugby World Cup,
now taking place in JP, has boosted consumer spending & may off set some negative impacts of the tax increase. Second, many food and beverage
items are exempt. Third, the government will spend some tax proceeds on childcare & pensions. Finally, with the government’s help, small retailers
ASPA will offer customers rebates of up to 5%. These factors mean that, while JP’s growth is set to slow, a recession is probably not in the cards.
Industrial production in CN, fixed asset investment, & housing activity slowed further, & auto sales, exports, & imports all fell again in CN. The
damage from the trade war is evident in falling CN exports to the world & plunging exports to the US. IHS Markit however continues to believe more
modest stimulus will be forthcoming from China’s government.
IN’s economic growth slowed from 5.8% in Q1 to a 6-year low of 5.0% YoY in Q2 ’19. Rate cuts by the Reserve Bank of India this year, coupled with
EMERGING surplus liquidity in the banking system & corporate tax cuts will facilitate investment. Similarly, the Central Bank of Brazil lowered its Selic interest
MARKETS rate by 50 basis points in both Aug & Sep, bringing it to 5.50%. The Central Bank of Russia has also cut interest rates 3 times this year, which will
provide a small boost to Russia’s growth in 2020.
DEMAND Inflows of new orders expanded at the slowest pace since 2012, while business expectations about the year ahead remained close to Global PMI
DEVELOPMENT survey low. Trade worries continue to dominate the outlook, alongside heightened uncertainty & concerns about weaker economic growth.
Source: IHS Markit, IHS Purchasing Manager Index Manufacturing, a PMI at 50 is considered neutral, expanding above 50, and business shrinking below 50.
DHL Global Forwarding | OFR Market Update | November 2019 7
7PUBLIC
Capacity Development
CAPACITY
Maersk has confirmed that the Asia-North Europe ‘AE-2/Swan’ service suspension will last from week 39 to week 47. The move will see the 2M restore its Asia-North
Europe service coverage to six sailings per week, following the temporary removal of the ‘AE-2/Swan’ at the end of September. Maersk and MSC had earlier planned to
restart the service in mid November but delayed the relaunch by two weeks due to weak market demand.
Weak market conditions on the Far East – North Europe route have also forced the OCEAN Alliance to announce six blank sailings in November and three sailings in
December while THE Alliance has announced two blanked sailings so far for November.
In anticipation of the slack winter season, THE Alliance members, Hapag-Lloyd, ONE and Yang Ming, have announced the suspension of the Far East – USEC ‘EC3’
service from November until the end of March next year. In order to provide a seamless coverage of the ports served by the ‘EC3’ during the suspension, the rotation of
the ‘EC1’ service will be adjusted to accommodate additional ports, with calls at Kaohsiung, Xiamen, Hong Kong, Yantian being inserted, as well as an eastbound call at
Manzanillo (Panama). This move effectively merges the ‘EC1’ and ‘EC3’ services into a combined service dubbed ‘Modified EC1’. This will result in the removal of about
6,700 TEU weekly from the Far East – USEC route or about 4% of the total capacity on this route.
THE Alliance will also downsize the capacity deployed on two Far East – USWC services, the ‘PS5’ and ‘PS7’ for the winter slack season from November to March next
year. The average capacity on the ‘PS5’ will be reduced from 8,400 TEU to 6,700 TEU while the ‘PS7’ will be downsized from the 9,800 TEU to the 8,500 TEU scale. These
moves will remove about 3,000 TEU weekly from the Far East – USWC route, or just 1% of the total capacity on this route.
Scrubber retrofitting activity and void sailings during the October ‘Golden Week’ holidays continued to drive the increase in inactive fleet numbers in early October,
with 3.9% of the fleet recorded to be out of active service as at 14 October. The inactive fleet increased across all size sectors to reach 211 units for 898,750 TEU (of which
436,036 TEU due to scrubber retrofits beyond the normal immobilization time for routine maintenance), logging an increase of 145,000 TEU compared to the last survey
on 30 September. With more void sailings already announced in November due to the low freight demand, the inactive fleet will remain bloated in the coming weeks
even as the scrubber retrofit rush is expected to peak in the coming months with as many as 80-90 containerships out at one time in November and December for
retrofits. The number of containerships already fitted with scrubbers has reached 142 units for 1.14 MTEU as at 15 October.
Source: Alphaliner, Dynaliners, carriers
DHL Global Forwarding | OFR Market Update | November 2019 8
8PUBLIC
Carriers 1/2
CARRIERS
Maersk has upgraded its earnings guidance for the full year, with its EBITDA forecast raised from $5.0 Bn to between $5.4 and 5.8 Bn. Preliminary 3rd Q numbers
released by Maersk on 21 October show a total revenue of $10.055 Bn in the 3rd Q and EBITDA of $1.656 Bn. Although topline revenue dropped by 0.9% compared to 3rd
Q 2018, due to slower volume growth and lower freight rates, EBITDA margins were boosted to 16.5%. This came as a result of lower bunker fuel costs, as well as other
cost savings from capacity management on Maersk’s Ocean business and improved margins on its Terminal business.
OOCL log improved 3rd Q 2019 performance. Total liftings increased by 4.1% to 1.781 MTEU, with the Asia-Europe route recording the largest increase of 11.4% while
transpacific volumes increased by 3.5%. OOCL’s total revenue reached $1.646 Bn in the 3rd Q, up 5.8% compared to the same quarter last year as average revenue per
TEU improved marginally by 1.6% to $924/TEU compared to $910/TEU last year. Although the transpacific rates were up 3.4%, Asia-Europe rates were 7.4% lower. OOCL
had also confirmed the completion of the sale of the Long Beach Container Terminal (LBCT) on 24 October to a investment holding fund managed by Macquarie Asset
Management. OOCL will receive $1.78 Bn in cash from the sale, with at least part of the proceeds expected to be used to fund further capacity expansion.
Moody’s on 25 September downgraded CMA CGM’s corporate credit ratings from B1 to B2, both categorized as ‘highly speculative’. Moody’s said that the downgrade
‘reflects that CMA CGM’s liquidity profile has weakened materially in the last twelve months as a consequence of the acquisition of CEVA Logistics,’ together with a heavy
capital expenditure program in a difficult market environment for container shipping. CMA CGM is expected to reduce its debt burden through the sale of a minority stake
in CEVA and a divestment of its terminal assets that Moody’s expects to generate ‘at least $500 M’. CMA CGM’s total debt and lease liabilities stood at $20.2 Bn as at end
of June, with a significant pipeline of new capital expenditure still outstanding. This includes an order book of 15 ships to be delivered from 2019 to 2021 on the
company’s account.
The sanctions applied by the US to COSCO, accused of violating restrictions on Iranian oil trading, do not concern the container shipping activities of the company,
ensured under the umbrella of COSCO Shipping. In an official statement on 25 September, the US Government clarified its position, saying that the sanctions apply only to
COSCO Shipping Tanker (Dalian) Co and COSCO Shipping Tanker (Dalian) Seaman & Ship Management Co. According to the latest statistics on the Far East – US route,
COSCO and OOCL remain the largest carrier on the transpacific eastbound trade with a combined market share of 21.5% for the May-September 2019 period.
On 15 October MSC concluded an order for five more megamax containerships of 23,000 TEU with the South Korean shipbuilder Daewoo Shipbuilding & Marine
Engineering. The five vessels are scheduled for delivery prior to August 2021. This order will bring MSC’s total megamax fleet to 36 units, including 16 next-generation
jumbo vessels of the wider and somewhat bigger 23,000+ TEU type, known as ‘megamax-24’.
Source: Alphaliner, Dynaliners, carriers
DHL Global Forwarding | OFR Market Update | November 2019 9
9PUBLIC
Carriers 2/2
CARRIERS
MSC has joined the position of CMA CGM and Hapag-Lloyd and stated on 17 October that it ruled out the use of Arctic waters
for container shipping. As the polar ice in the Arctic continues to melt, both the North East and North West Passages are now
ice-free in summer. The time window in which this region can be navigated continues to be relatively narrow, but is extending
year after year.
Usage of this route means a major shortcut between North East Asia and North Europe and between North East Asia and the
US East Coast. A trip from Ningbo to Rotterdam via Suez represents a distance of 10,600 miles compared to only 7,800 miles
via the Arctic Northern Sea Route. Shanghai – New York via Panama stands at 10,600 miles, compared to 8,600 miles via the
North West Passage. Despite the advantages of using a shorter route, only a small number of the current containership fleet
have the requisite Arctic ice-class that allows them to use the Arctic route on a commercially viable basis.
CMA CGM, Hapag-Lloyd and MSC declared individually that they will not use this route as a surge in container shipping
traffic could represent a significant danger to the unique ecosystem of this part of the world.
Source: Alphaliner, Dynaliners, carriers
DHL Global Forwarding | OFR Market Update | November 2019 10
10PUBLIC
Did you know?
Top 12 Container Carriers’ Oder Books
Operated Fleet Order book Orders % The Top 12 Container Carriers control 85% of the
No. Carrier Ships TEU Ships TEU Operated Fleet
existing world container fleet.
1 Maersk Line 706 4’196’200 19 45’500 1%
2 MSC 560 3’661’200 11 190’400 5% Their order books stand at 10% of the existing fleet.
3 Cosco Shipping 483 2’966’600 3 5’300 0%
With a fleet capacity of 393’500 TEUs PIL crawled up
4 CMA CGM 507 2’680’800 33 487’500 18%
one rank and is now ahead of HMM.
5 Hapag-Lloyd 233 1’683’700 - - 0%
6 ONE 218 1’572’700 - - 0% HMM is leading in terms of orders in relation to the
7 Evergreen 203 1’294’200 67 568’300 44% currently operated fleet.
8 Yang Ming 97 641’400 24 198’100 31%
9 PIL 120 393’500 - - 0%
With the exception of CMA CGM the top 5 carriers
10 HMM 61 380’500 20 396’000 104% have small order books compared to their operated
11 Zim 63 283’300 - - 0% fleet.
12 Wan Hai 92 263’300 20 48’700 18%
Total Top 12 3’343 20’017’400 197 1’939’800 10%
other carriers 2’795 3’427’200 179 632’900 18%
Total carrier fleet 6’138 23’444’600 376 2’572’700 11%
Share Top 12 54% 85% 52% 75%
Source: Dynaliners based on Alphaliner
DHL Global Forwarding | OFR Market Update | November 2019 11
11PUBLIC
B A C K- U P
12
12PUBLIC
Market Outlook November 2019 – Ocean Freight Rates Additional Trades (1/2)
OCEAN FREIGHT RATES OUTLOOK
EURO – AMLA No capacity issues. Rates remain stable until end 2019.
ME region shows same trend as ASPA; Additional blank sailings, combined with strong commodity demand put pressure on space and container
EURO – MENAT
availability. Space situation continues to be tight.
EURO – SSA Rates remain stable for now, but might increase as of Q1, 2020.
Rates in the market are stable and no changes are expected before December 2019. Space is tight out of USEC & USGC Ports on services
AMNO – MENAT
to M. East & India Subcontinent, but an improvement is expected for November. No space issues out of USWC at this time
AMNO – SSA Rates to South Africa and West Africa unchanged except congestion surcharges in Nigeria. No changes in capacity. Space is available.
AMNO – AMLA Market remains soft on US exports.
Equipment imbalance affecting drop off conditions in CO & CL.
13% VAT to be implemented on all haulage within Costa Rica.
AMLA Exports Space constraints w/weekly rolls at Callao Port.
Carriers introducing service to Posorja EC (deep water port).
Congestion continues at all t/shipment ports in Central America.
AMNO – ASPA carriers are looking for additional cargo for TPWB and are very aggressive in pricing and terms.
Source: DGF
DHL Global Forwarding | OFR Market Update | November 2019 13
13PUBLIC
Market Outlook November 2019 – Ocean Freight Rates Additional Trades (2/2)
OCEAN FREIGHT RATES OUTLOOK
EURO MED - AMNO Rates will remain stable
EURO MED – AMLA Unchanged / stable
EURO MED – ASPA Slight rate increase expected depending on the service.
EURO MED – MENAT Slight rate increase expected depending on the service.
EURO MED – SSA Unchanged / stable
ASPA-SPAC Further blank sailing for week 40+41, will put pressure on space. Carriers have announced GRIs as of Oct 1st.
Source: DGF
DHL Global Forwarding | OFR Market Update | November 2019 14
14PUBLIC
Market Outlook – Volume Outlook in Main Trade Lanes, 2019 Estimate &
2020/23 Growth Forecast in %
2019e, in mTEU 2020e-2023e CAGR, in %
N O R T H N O R T H
A M E R I C A A M E R I C A
I n c l . 4.3 mTEU +2.2% 7.6 mTEU +3.0% I n c l .
M E X I C O F A R E A S T M E X I C O
2.3 mTEU +1.5% 14.6 mTEU +3.8% 18.5 mTEU +3.4%
2.0 mTEU 1.5 mTEU
+3.9% +3.0% 1.7 mTEU +3.4% E U R O P E 7.3 mTEU +2.2% 1.7 mTEU +4.0%
L A T I N L A T I N
I n c l . M E D
A M E R I C A 1.9 mTEU +2.5% 4.4 mTEU +4.8% A M E R I C A
INTRA ASIA
excl. Oceania
40.7 mTEU +3.8%
GLOBAL CONTAINER TRADE 2019e 151.2 mTEU +3.9% CAGR 2020e-2023e
Mid-term growth is mainly driven by Asian tradelanes.
Source: Seabury Jun19 update
DHL Global Forwarding | OFR Market Update | November 2019 15
15PUBLIC
Carrier Mergers, Acquisitions and Alliances
M E R G E R S A N D A Q U I S I T I O N S
United Hyundai
China CMA Hapag Hamburg Maersk Yang
Cosco OOCL Evergreen APL Arab Merchant MSC K Line MOL NYK
Shipping CGM Lloyd Süd Line Ming
Shipping Marine
HYUNDAI
CHINA COSCO SHIPPING EVER CMA CGM MAERSK LINE OCEAN NETWORK YANG
HAPAG-LLOYD MERCHANT MSC
OOCL GREEN APL MARINE Hamburg Süd EXPRESS (ONE) MING
A L L I A N C E S
F O R M E R A L L I A N C E S P R E S E N T A L L I A N C E S
CMA CGM OOCL
MAERSK LINE CHINA SHIPPING MAERSK LINE OCEAN CMA CGM
2M OCEAN 3 2M
MSC UNITED ARAB MSC ALLIANCE CHINA COSCO SHIPPING
SHIPPING COMPANY EVERGREEN
HAPAG-LLOYD
HAPAG-LLOYD HYUNDAI COSCO
ONE
MOL MERCHANT EVERGREEN K-LINE
G6 MARINE CKYHE THE ALLIANCE YANG MING
NYK HANJIN YANG MING
OOCL SHPPING HMM (from 1 April
APL
2020)
*Source: Carriers
DHL Global Forwarding | OFR Market Update | November 2019 16
16PUBLIC
Acronyms and Explanations
AMLA - Latin America OWS - Overweight Surcharge
AMNO - North America PH - Philippines
AR - Argentina PNW - Pacific North West
ASPA - AsiaPacific Ppt. - Percentage points
BR - Brazil PSW - Pacific South West
CAGR - Compound Annual Growth Rate QoQ - Quarter on quarter
CENAC - Central Amercia and Caribbean SAEC - South America East Coast
CNC - CNC Line (Cheng Lie Navigation Co. Ltd.) SAWC - South America West Coast
DG - Dangerous Goods SOLAS - Safety of Life at Sea
DWT - Dead Weight Tonnage SPRC - South People’s Republic of China – South China
EB - Eastbound SSA - Sub-Saharan Africa
ECSA - East Coast South America (synonym for SAEC) SSL - Steam Ship Line
EGLV - Evergreen Marine Corp T - Thousands
EURO - Europe TEU - Twenty foot equivalent unit (20‘ container)
GRI - General Rate Increase TSA - Trans Pacific Stabilization Agreement
HMM - Hyundai USGC - US Gulf Coast
HL - Hapag-Lloyd US FMC - US Federal Maritime Commission
HSUD - Hamburg Süd USEC - US East Coast
HWS - Heavy Weight Surcharge USWC - US West Coast
IA - Intra Asia VGM - Verified Gross Mass
IPBC - India Pakistan Bangladesh Ceylon (= Sri Lanka) VLCS - Very Large Container Ship
IPI - Inland Point Intermodal VSA - Vessel Sharing Agreement
ISC - Indian Sub Continent (synonym for IPBC) WB - Westbound
MENAT - Middle East and North Africa WCSA - West Coast South America (synonym for SAWC)
ML - Maersk Line WHL - Wan Hai
mn - Millions WRS - War Risk Surcharge
MoM - Month-on-Month YML - Yang Ming Line
NOO - Non-operating (vessel) owners YoY - Year-on-Year
OCRS - Operational Cost Recovery surcharge YTD - Year-to-Date
OOCL - Orient Overseas Container Line
DHL Global Forwarding | OFR Market Update | November 2019 17
17You can also read