BMO Global Metals and Mining Conference - 25-27 February 2019 - HIGH GROWTH LARGE SCALE - KAZ Minerals
←
→
Page content transcription
If your browser does not render page correctly, please read the page content below
BMO Global Metals and Mining Conference
                        25-27 February 2019

                               HIGH GROWTH
                               LARGE SCALE
                                  LOW COST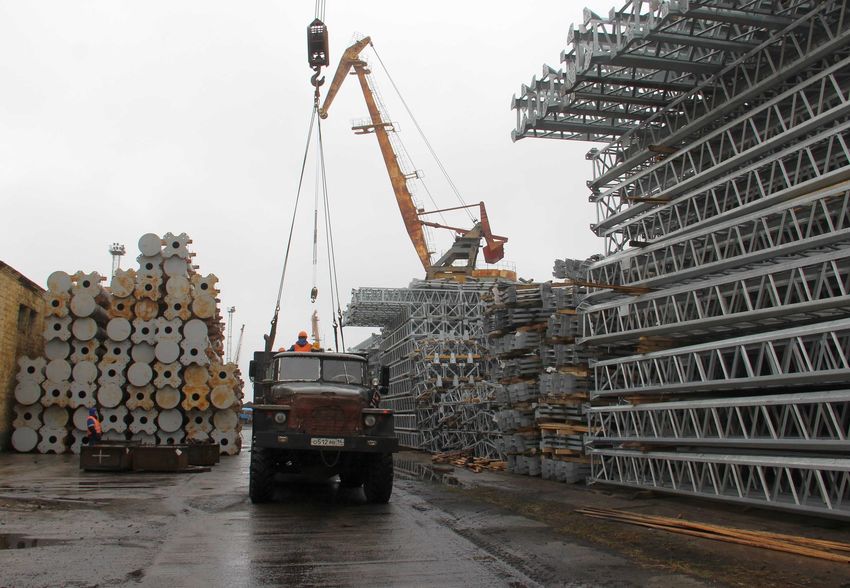
IMPORTANT NOTICE

DISCLAIMER
Certain statements included in this presentation contain forward-looking information concerning the strategy of KAZ Minerals PLC (‘KAZ Minerals’) and its
business, operations, financial performance or condition, outlook, growth opportunities and circumstances in the countries, sectors or markets in which it
operates. Although KAZ Minerals believes that the expectations reflected in such forward-looking statements are reasonable and are made in good faith, no
assurance can be given that such expectations will prove to be correct. By their nature, forward-looking statements involve known and unknown risks,
assumptions and uncertainties and other factors which are unpredictable as they relate to events and depend on circumstances that will occur in the future
which may cause actual results, performance or achievements of KAZ Minerals to be materially different from those expressed or implied in these forward-
looking statements.
Principal risk factors that could cause KAZ Minerals’ actual results, performance or achievements to differ materially from those in the forward-looking
statements include (without limitation) health and safety, community and labour relations, employees, environmental compliance, business interruption, new
projects and commissioning, reserves and resources, political risk, legal and regulatory compliance, commodity prices, foreign exchange and inflation,
exposure to China, acquisitions and divestments, liquidity and such other risk factors as are disclosed in KAZ Minerals’ most recent Annual Report and
Accounts. Forward-looking statements should therefore be construed in light of such risk factors. These forward-looking statements should not be construed
as a profit forecast.
No part of this presentation constitutes, or shall be taken to constitute, an invitation or inducement to invest in KAZ Minerals, or any other entity, and
shareholders are cautioned not to place undue reliance on the forward-looking statements. Except as required by the Listing Rules of the UK Listing Authority
and applicable legislation, KAZ Minerals undertakes no obligation to update or revise any forward-looking statements whether as a result of new information,
future events or otherwise.
Neither this presentation, which includes the question and answer session, nor any part thereof may be recorded, transcribed, distributed, published or
reproduced in any form, except as permitted by KAZ Minerals. By attending this presentation, whether in person, by webcast, or call you confirm your
agreement to the foregoing and that, upon request, you will promptly return any records or transcript of the presentation without retaining any copies.
All relevant financial definitions can be found in the glossary to the Full Year Results 2018 press release.

                                                                                                                                                             1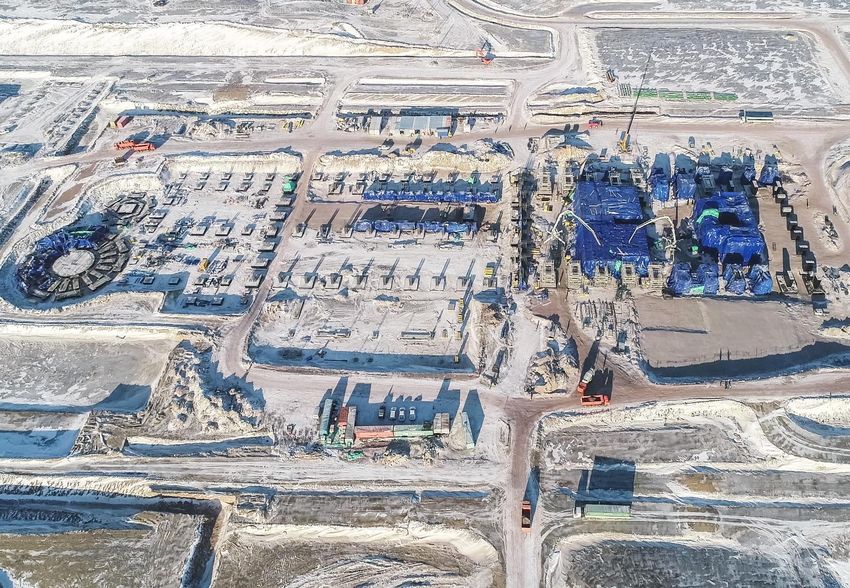
1. Introduction to
   KAZ Minerals
NEAR AND LONG TERM GROWTH IN COPPER

       Proven track                            Near term                        Strong
          record                                growth                         platform
       >50% CAGR                                 Aktogay                       Supports
    copper production                           expansion                     Baimskaya
                                                                                                                   Long
         2015-18                                 project                     construction
                                                                                                                   term
                                                                                                                  growth
►   Achieved annual copper
    production guidance for 10
    years
                                      ►   Adds 80 ktpa from 2022-27   ►   Increased earnings and        ►   Strong NPV and
►   Low cost producer
                                                                          cash flow                         attractive IRR
                                      ►   Low risk brownfield
►   Bozshakol and Aktogay
                                          expansion                   ►   Enables financing of longer   ►   Favourable long
    delivered on time and on
                                                                          term growth                       term copper
    budget, ramped up                 ►   Low capital intensity of                                          fundamentals
    successfully                          $15,000/t

2015                           2018                           2021                    2024                        2027

                                                                                                                              3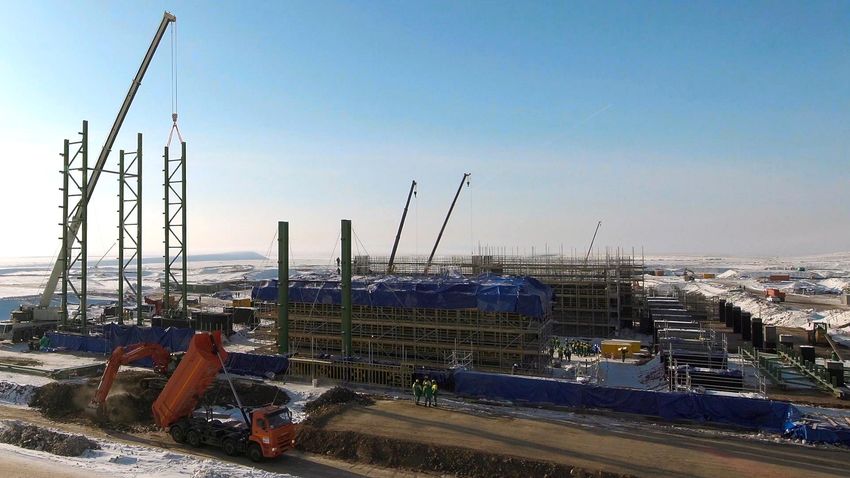
STRONG COPPER MARKET FUNDAMENTALS

 Supply from existing mines forecast to decline       Mt
 materially                                           30
                                                                          Probable Projects
 New copper projects will be required to meet                             Base Case Production Capability
                                                      25                  Primary Demand
 demand, but viable large scale deposits are rare
 Growth in new markets for copper including clean     20
 energy and electrical vehicles could significantly
 increase the supply shortage                         15

                                                                                              c.5 Mt annual supply
                                                      10                                      deficit forecast by 2028

                                                       5

                                                       0

                                                           1992

                                                                   1998

                                                                               2004

                                                                                      2010

                                                                                                 2016

                                                                                                          2022

                                                                                                                   2028

                                                                                                                          2034

                                                                                                                                 2040
                                                      Source: Wood Mackenzie

                                                                                                                                   4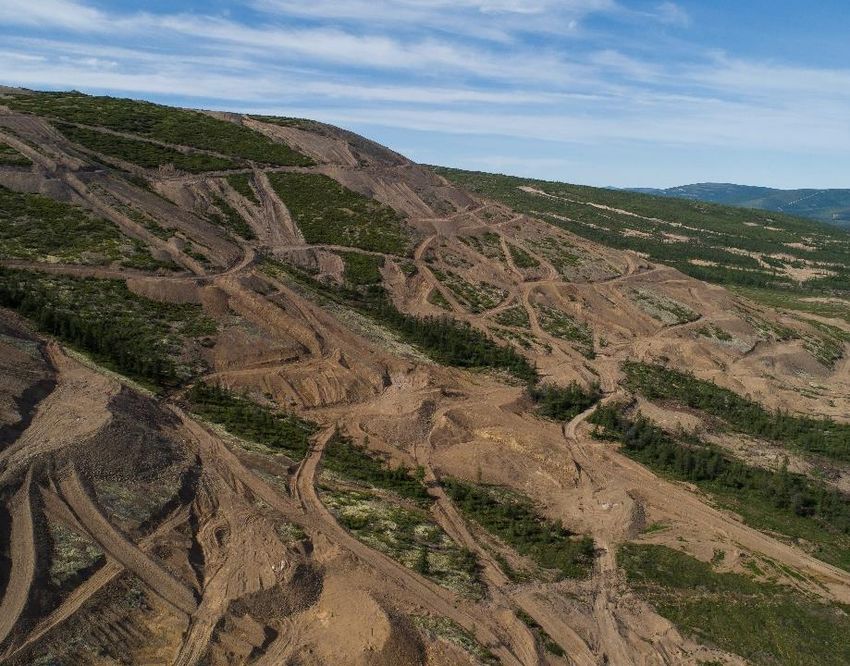
HIGH GROWTH PORTFOLIO

                East Region & Bozymchak                       Bozshakol              Aktogay I (sulphide and oxide)                      Aktogay II            Baimskaya

                                                                             Baimskaya – long term
                                       Aktogay II – low risk                   growth from 2026
                                        brownfield project,
                                         delivers +80 ktpa
     Bozshakol and
                                            2022-2027
    Aktogay delivered
      >50% CAGR,                                                                                                               Group copper production
        2015-18
                                                                                                                               2027-2036 of c.500 ktpa

 2015                     2018                      2021                      2024                     2027                      2030                     2033                        2036

Notes:
Indicative production schedule, not to scale. Assumes 100% ownership, first production from Baimskaya in 2026 and ramp up from 2027. Actual construction timetable to be determined      5
during feasibility study.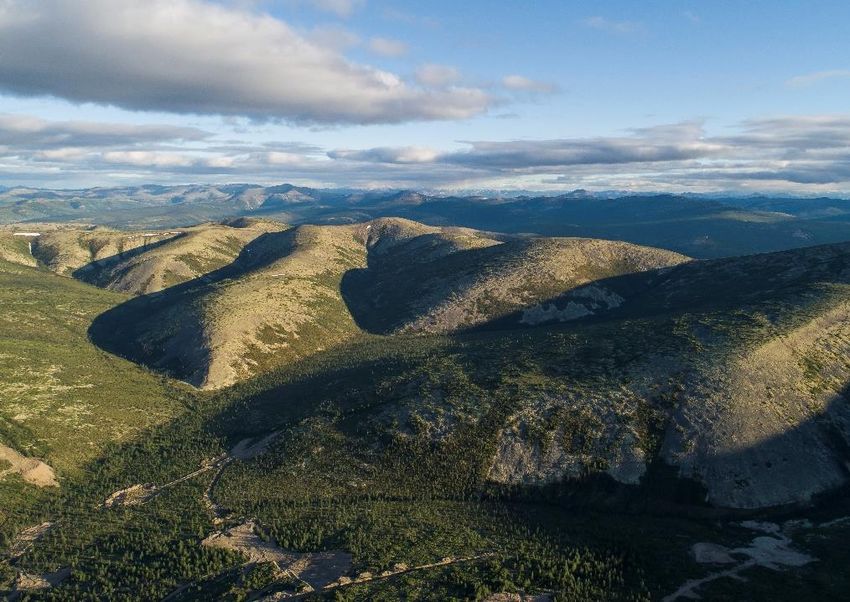
FIRST QUARTILE PRODUCER

Net cash cost curve1

                                                                         2018              USc/lb
                                                                           East Region        94
                                                                           and Bozymchak
                    85 USc/lb
                                                                           Bozshakol          58
                                                                           Aktogay           103

                                        108 USc/lb
                                         $2,370/t

                   1st quartile2                              2nd quartile                   3rd quartile   4th quartile

Notes:
1. Conceptual representation as at 31 December 2018, not to scale.                                                         6
2. Wood Mackenzie first quartile cut off 108 USc/lb, 31 December 2018.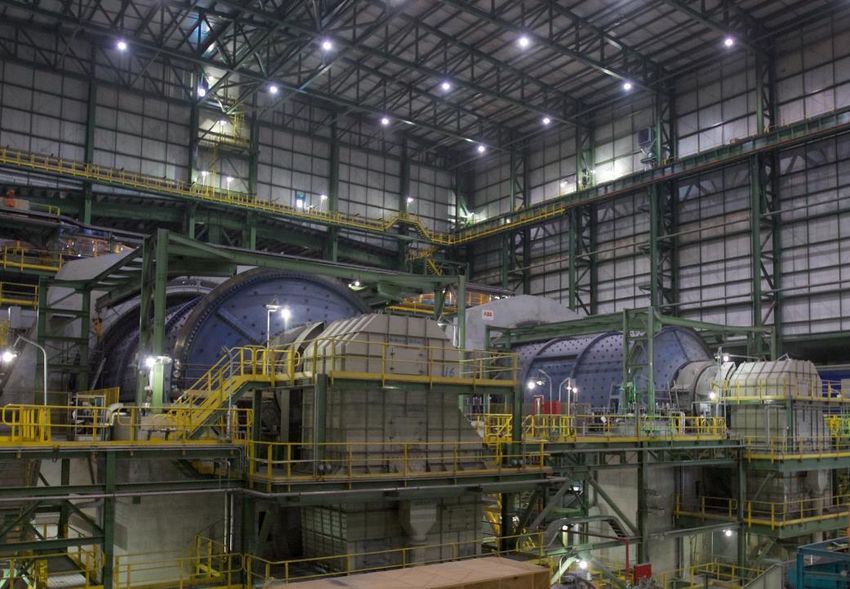
VALUE AND VOLUME

   Aktogay II and Baimskaya will significantly increase                                             Lower capital intensity
   the Group’s copper production at a lower capital                                                 ($/t)2
   intensity than the previous major growth projects                                                          17,700
                                                                                                                                   17,200
                                                                                                                                                                               16,700
   Economies of scale at Aktogay II will maintain cash                                                                                                   15,000
   costs at 100-1201 USc/lb out to 2027

                                                                                                             Aktogay I          Bozshakol              Aktogay II           Baimskaya
   Baimskaya is expected to be in the first quartile of
   the global cost curve
                                                                                                    Low operating costs
   Both projects offer significant NPV uplift and                                                   (USc/lb)3
   attractive IRR                                                                                           120                                            120
                                                                                                                                      90
                                                                                                                100                                        100
                                                                                                                                     70                                         First
                                                                                                                                                                               quartile

                                                                                                             Aktogay I          Bozshakol             Aktogay II            Baimskaya

Notes:
1. 2017 US dollar terms.                                                                                                                                                                  7
2. Approximate capital expenditure per ktpa copper equivalent production calculated as capital expenditure divided by forecast annual copper equivalent production for the first ten
    years after commissioning.
3. Net cash cost guidance in USc/lb for the first ten years of operations. Baimskaya operating costs subject to feasibility study.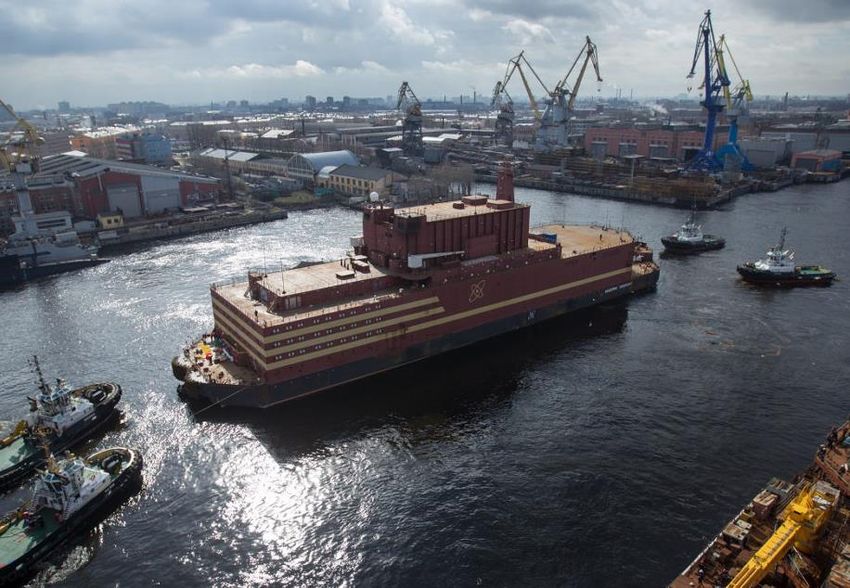
2018 RESULTS HIGHLIGHTS

Production growth                                                                              Revenue growth
kt                                  2017        2018                                           USD million1
                   +14%                                                                                                                +12%

                                                               +3%                                                                                           2,162
                             295                                                                                 1,938
           259
                                                       179              183

                  Copper                                       Gold                                               2017                                        2018

 EBITDA growth                                                                                 Low cost producer
 USD   million2                                                                                Net cash cost, USc/lb3                Diversified peer       Copper peer
                                                                                                                                                                                181
                                                                                                                                                                         158
                                         +6%                                                                                                                      142
                                                                                                                                    125      127    128    129
                                                                                                                      104    107
                                                                                                         85     87
                  1,235                                      1,310                               77

                   2017                                       2018                               Peer   KAZ    Peer   Peer   Peer   Peer     Peer   Peer   Peer   Peer   Peer   Peer
                                                                                                  1             2      3      4      5        6      7      8      9      10     11

Notes:
1. The 2017 comparative is Gross Revenue which includes the results of pre-commercial production from Aktogay sulphide and Bozshakol clay.                                             8
2. The 2017 comparative is Gross EBITDA which includes the results of pre-commercial production from Aktogay sulphide and Bozshakol clay.
3. Source: Company data, most recently reported financial period.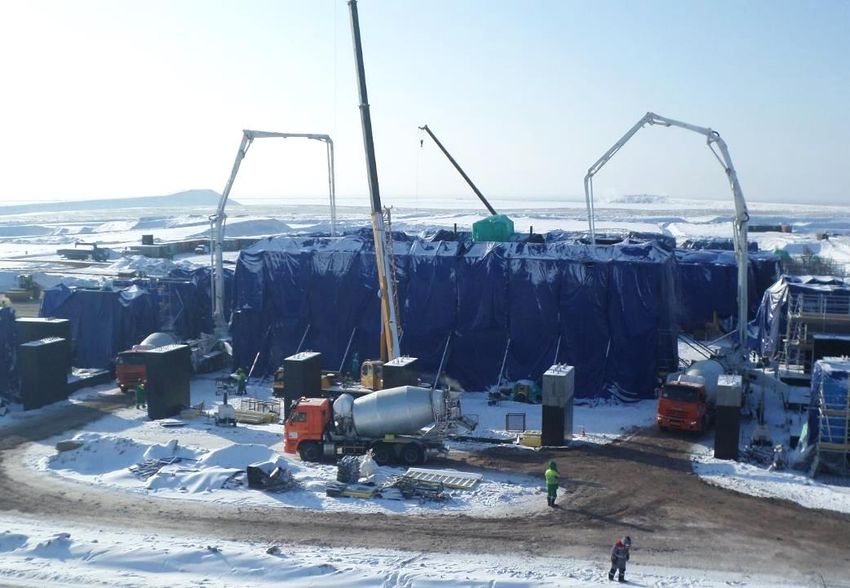
2018 RESULTS HIGHLIGHTS (CONT’D)

 Free Cash Flow                                                                                    Gearing reduced
 USD million1                                                                                      Net debt : EBITDA²
                                          +29%

                                                                 585                                                  1.7x
                                                                                                                                                                   1.5x
                     452

                     2017                                        2018                                                 2017                                         2018

 Final dividend recommended                                                                        Growth pipeline established
                                                                                                                                                                     Baimskaya3,4
 USc/share                                                               12.0                      ktpa copper production
                                                                                                                                                                     Aktogay II3

             6.0                           6.0                                                                                                                     +250
                                                                                                                       295

                                                                                                                                                                   +80
           Interim                         Final                       Full year                                      2018                                  Pipeline projects

Notes:
1. Net cash flow from operating activities before capital expenditure and non-current VAT associated with expansionary and new projects less sustaining capital expenditure.        9
2. Gross EBITDA excludes MET, royalties and special items and includes the results of pre-commercial production from Aktogay sulphide and Bozshakol clay in 2017.
3. Potential ktpa copper production from new project.
4. Based on 100% share.
DELIVERING AGAINST OUR TARGETS
Production
270 295 300
Copper1 kt
50 c.60
Zinc2 kt
160 175 183
Gold3 koz
c.3,000 3,511
Silver3 koz
Gross Cash Cost4 USc/lb
129 130 150
Bozshakol
106110 130
Aktogay
230 244 250
East Region and Bozymchak
Notes:
1. Payable metal in concentrate and copper cathode from Aktogay oxide ore. 10
2. Zinc in concentrate.
3. Payable metal in concentrate.
4. Cash operating costs, plus TC/RC on concentrate sales, divided by copper sales volume.2. Review of operations
BOZSHAKOL

   Achieved or exceeded guidance across all metals                                        2018               2019
                                                                                                           guidance
   28.5 Mt ore processed, including >15 Mt in H2 2018,
                                                              Copper1
   operating at full design capacity                                                       102            105 – 115
                                                                 kt

   Significant improvement in ore throughput at clay
   plant following optimisation works in Q1 2018               Gold1
                                                                                           128            130 – 140
                                                                koz
   Copper grade in sulphide ore processed 0.47%
   (2017: 0.52%), similar grade expected in 2019              Silver1
                                                                                           666                  c.700
                                                                koz
   Strong gold production of 128 koz, ahead of
   guidance (2017: 119 koz)                              Ore throughput        (% of design capacity)
                                                                                H1 2018        H2 2018
                                                                                                                 109%
                                                              92%              97%
                                                                                                  81%

                                                                    Sulphide                             Clay

Notes:
1. Payable metal in concentrate.                                                                                        12
AKTOGAY
Copper production of 131 kt (2017: 90 kt), ahead of 2018 2019
guidance
guidance range due to smooth ramp up and high
grades Copper1
131 130 – 140
kt
Achieved 100% of design throughput capacity for
sustained period in Q2
Sulphide grade 0.61% (2017: 0.66%), expected to
average 0.50% over 2017-21 period and 0.40%
Average ore throughput (%)
from 2022-27
Oxide production of 26 kt (2017: 25 kt), SX/EW plant
89% 90% 87%
maintained design capacity
66% 68% 66%
2019 copper production guidance set at 130-140 kt
with further growth driven by increased ore 47%
throughput 27%
– Oxide c.25 kt
Q1 Q2 Q3 Q4 Q1 Q2 Q3 Q4
– Sulphide 105-115 kt 2017 2017 2017 2017 2018 2018 2018 2018
Notes:
1. Payable metal in concentrate and copper cathode from Aktogay oxide ore. 13EAST REGION AND BOZYMCHAK
Copper production of 62 kt (2017: 67 kt), slightly 2018 2019
guidance
below 65 kt guidance
Gold and silver output exceeded guidance by 10% Copper1
62 c.55
kt
and 18%, respectively
– Strong contribution from Bozymchak
Gold1
55 40 – 45
koz
Zinc output of 50 kt, below guidance due to lower
than forecast zinc grades
Silver1
2019 copper production expected to be c.55 kt with 2,356 c.1,800
koz
corresponding reduction in by-products
– Geological conditions limit ore extraction volumes Zinc2
50 c.50
at Orlovsky, modest recovery expected in 2020 kt
– Artemyevsky extraction continues through
transition zone
Notes:
1. Payable metal in concentrate. 14
2. Zinc in concentrate.2019 GROUP PRODUCTION GUIDANCE
Bozshakol Aktogay East Region & Group
Bozymchak
Copper1
105 – 115 130 – 1402 c.55 c.300
kt
Zinc3
c.50 c.50
kt
Gold4
130 – 140 40 – 45 170 – 185
koz
Silver4
c.700 c.500 c.1,800 c.3,000
koz
Notes:
1. Payable metal in concentrate and copper cathode from Aktogay oxide ore. 15
2. Range includes c.25 kt of cathode production from oxide ore.
3. Zinc in concentrate.
4. Payable metal in concentrate.3. 2018 results
HEALTH AND SAFETY

   Four fatalities occurred in 2018 (2017: 4)                                                    Fatality frequency rate
   – No fatality is acceptable, target is zero
   – Zero fatalities from rock fall incidents following                                                             0.13
       ground control improvements                                                                                                 0.11

   – Zero fatalities at open pit operations
   Industry focused on tailings in 2019
                                                                                                                    2017           2018

Improving our performance
   Health and safety audits conducted at all mines                                               Total Recordable Injury Frequency Rate1
   Group-wide workshops held to share best practice
                                                                                                                                ICMM2 average 2017 3.94
   Investments in emergency response and medical
   support capabilities
                                                                                                                    1.60           1.74
   New occupational health measures include
   improved medical monitoring, rehabilitation and
   return to work procedures                                                                                        2017           2018

Notes:
1. Total Recordable Injury Frequency Rate or TRIFR is the number of Recordable Injuries occurring per million hours worked.                               17
2. International Council on Mining and Metals.
EARNINGS AND FREE CASH FLOW GROWTH
$m (unless otherwise stated) 2018 2017 Volume growth from Aktogay has increased
Gross Revenues1 2,162 1,938
earnings and cash flow
Gross EBITDA2 1,310 1,235 EBITDA $1,310 million, 61% margin
Margin 61% 64% Competitive net cash cost of 85 USc/lb, all
operations in the first quartile of the global cost
Revenues 2,162 1,663
curve
EBITDA3 1,310 1,038
Free Cash Flow increased to $585 million
Net cash cost (USc/lb)4 85 66
Net debt $1,986 million at 31 December 2018,
Free Cash Flow5 585 452 $1,467 million of gross liquid funds
EPS – based on Underlying Profit ($)6 1.18 1.07
Gearing of 1.5x EBITDA
Net Debt (1,986) (2,056)
Final dividend of 6.0 US cents per share
recommended
Notes:
1. Gross Revenues includes the results of pre-commercial production from Aktogay sulphide and Bozshakol clay in 2017. 18
2. Gross EBITDA excludes MET, royalties and special items and includes the results of pre-commercial production in 2017.
3. EBITDA excludes MET, royalties and special items.
4. Cash operating costs, plus TC/RC on concentrate sales, less by-product Gross Revenues, divided by copper sales volume. 2017 includes pre-commercial production costs.
5. Net cash flow from operating activities before capital expenditure and non-current VAT associated with expansionary and new projects less sustaining capital expenditure.
6. EPS based on Underlying Profit excluding special items.VOLUME DRIVES EBITDA GROWTH
($m)
Copper sales weighted towards the
second half of 2018 when copper
Volume2 prices were lower Commodity prices
175 13
(12) (12) 11 1,310
1,235 (92) (8)
Copper
Bozshakol and Aktogay costs
increased as maintenance
normalised, unit costs remain below
or within long term guidance
General mining and wage inflation
in East Region and $9 million
impairment of historic operating
VAT
Gross Aktogay Bozshakol East Region By-product Cost Copper By-products EBITDA
EBITDA and volume impact³ price price 2018
2017¹ Bozymchak
Notes:
1. Includes the results of pre-commercial production in 2017. 19
2. Change in sales volumes at current year margin.
3. Net change in cash costs per tonne.COMPETITIVE UNIT COSTS
Bozshakol 2018 Bozshakol and Aktogay operations remain
gross cash cost
guidance structurally low cost – low strip ratios, access to
130-150 USc/lb
power, water and transport networks
99 102
Both operations delivered below cost guidance
121 129 (71)
Strong gold and silver output at Bozshakol resulted
58
in low net cash cost of 58 USc/lb (2017: 54 USc/lb)
2017 2018 2017 2018 2018
Aktogay 2018 Costs increased from 2017 at both mines as
gross cash cost maintenance costs normalised following the ramp
guidance
130 up of operations. Bozshakol costs also impacted by
110-130 USc/lb
87 increased volumes from the higher cost clay plant
100 106 (3)
103
2017 2018 2017 2018 2018
Copper sales volumes (kt) Gross cash cost (USc/lb) By-product credit (USc/lb) Net cash cost (USc/lb)
20COMPETITIVE UNIT COSTS (CONT’D)
East Region and Bozymchak 2018 2018 costs were in line with market guidance,
gross cash cost
guidance increase on prior year was mainly due to reduction
230-250 USc/lb
in sales volumes and some cost inflation
70 244 (150) Strong by-product credits maintain competitive first
64 208
quartile net cash cost position at 94 USc/lb (2017:
94
42 USc/lb)
2017 2018 2017 2018 2018
Group Group net cash cost amongst the lowest of pure-
play copper producers globally
296
256
Increase in net cash cost from prior year (2017:
144 (59)
66 USc/lb) mainly reflects ramp up of Aktogay
138
(where by-product credits are minimal) to 45% of
85
Group copper production
2017 2018 2017 2018 2018
Copper sales volumes (kt) Gross cash cost (USc/lb) By-product credit (USc/lb) Net cash cost (USc/lb)
21MOVEMENT IN GROUP NET DEBT
($m)
Sustaining capex
1,310 Guidance Actual
17
Bozshakol 35 24
(2,056)
Aktogay 30 20 (27) (1,986)
East Region & Bozymchak 50 40
Other - 1
Total 115 85
(530)
(85)
(197)
Expansionary capex
(95)
Guidance Actual
Bozshakol 40 5
(208) Aktogay 550 494
East Region & Bozymchak 40 30
(115)
Other - 1
Total 630 530
Net debt¹ Gross Working MET and Income Net Sustaining Expansionary Dividend Other Net debt¹
31 Dec 2017 EBITDA capital royalties paid tax paid interest paid capex capex paid movements² 31 Dec 2018
increase
Notes:
1. The excess of borrowings over gross liquid funds. 22
2. Includes $25 million advance receipt in respect of NFC’s equity investment in Koksay, $15 million advances paid on the Baimskaya copper project, other non-current VAT, foreign exchange
and other movements.2019 FINANCIAL GUIDANCE
Gross cash cost Sustaining capex Expansionary capex
(USc/lb) ($ million) ($ million)
Bozshakol 130-150 Bozshakol1 50 Bozshakol2 40
Aktogay1 50 Aktogay I & II3 470
Aktogay 105-125
East Region & 50 East Region & 70
Bozymchak1 Bozymchak4
East Region & 260-280
Bozymchak Group 150 Baimskaya 70
Other 20
Group 670
Notes:
1. Includes $10 million of sustaining capital expenditure deferred from 2018. 23
2. Bozshakol final retention payments to contractors of c.$40 million carried over from 2018.
3. Includes $400 million for Aktogay II and $70 million for Aktogay I, of which $50 million was carried over from 2018 mainly for final stage of heap leach cells.
4. Principally Artemyevsky underground mine extension, includes $10 million carried over from 2018.4. Aktogay expansion project
LOW-RISK NEAR TERM GROWTH

   Aktogay II is a $1.2 billion project approved in                                   Indicative copper production profile2
   December 2017 to double sulphide processing
   capacity from 25 to 50 Mtpa                                                                                   Aktogay I + oxide             Aktogay II

   Low-risk execution due to existing site infrastructure
   and identical concentrator design to Aktogay I and
   Bozshakol

                                                                                      Copper production
   First production expected in 2021, ramp up in 2022

   Adds c.80 kt of annual copper production from
   2022-27 and c.60 kt from 2028 onwards

   Net cash cost 100-120 USc/lb1

   Accelerated processing reduces mine life from 56 to
   27 years
                                                                                              2016        2018    2020     2022      2024   2026    2028    2030

Notes:
1. Net cash cost guidance in USc/lb for the period 2022-27 in 2017 US dollar terms.                                                                                25
2. Indicative production schedule, not to scale.
OPERATING COSTS AND SUSTAINING CAPEX
Net cash costs to 2027 expected to be maintained Copper processing grade profile2
at 100-120 USc/lb1
12 months to 31 December 2017,
supergene enriched 0.66%
Operating cost efficiencies from larger scale mining
operations offset the effect of accelerated grade
decline, as processing volumes are brought forward
2017 – 2021
Aktogay I c.0.50%
Sustaining capital expenditure estimated to increase
from $30-$40 million to $50-$60 million per annum
from 2022 2022 – 2027
Aktogay I and Aktogay II c.0.40%
Life of mine sulphide
resource grade 0.33%
Notes:
1. 2017 US dollar terms. 26
2. Sulphide ore.PROJECT SCHEDULE AND PROGRESS
2018 Completed
Long lead time equipment ordered,
locked-in pricing
✓
Initial excavation and earthworks ✓
Detailed engineering ✓
Site infrastructure ✓
Schedule Start date
Permanent camp and mine
Commenced
maintenance facilities
Foundations Commenced
Structural steel Commenced Structural steel works, Aktogay
Mill installation 2020
First ore processed 2021
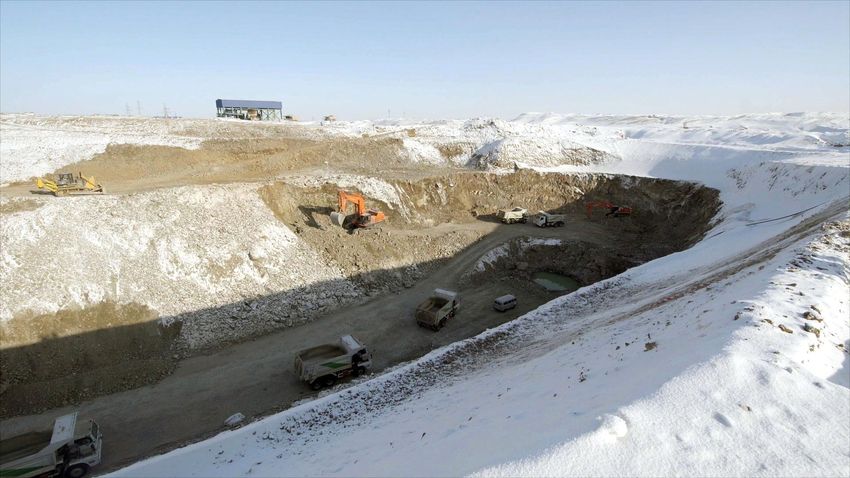
27Aktogay site layout,
AKTOGAY
July 2018 II EXPANSION PROJECT PLAN Aktogay I existing
concentrator
Aktogay II plant site
initial earthworks
Notes: Conveyor from open 28
1. Indicative.
pit mine and crusherPrimary crusher and
conveyor earthworks,
January 2019
29Sulphide concentrator II
laying of foundations,
January 2019
30Sulphide concentrator II
foundations - aerial view,
January 2019
31Sulphide concentrator II
first structural steel,
February 2019
325. Baimskaya acquisition update
BAIMSKAYA PROJECT OVERVIEW

     The Group has agreed to acquire the Baimskaya
     copper project for $900 million in cash and shares
     – $675 million Initial Consideration plus Deferred
       Consideration of $225 million                                                                        Baimskaya

     Indicative $5.5 billion nominal capex budget 2018-
                                                                                                                                          Licence area
     261
                                                                                                                                          Mineral trend
     60 Mtpa ore processing capacity, c.25 year mine life                                                                                 Peschanka
                                                                                                                                          deposit
     Average annual production2 of 250 kt copper and
     400 koz gold, copper equivalent 330 ktpa3

     First quartile net cash costs over life of mine, higher
     grades in first ten years of operations
                                                                                                                                          10 km
     Potential for resource expansion in c.1,300 sq. km
     licence area
                                                                                                  Baimka mineral trend and licence area
1.    In nominal terms based on 100% share of development capital expenditure, subject to confirmation in feasibility study.
                                                                                                                                                          34
2.    Average for first ten years of operations, based on 100% share of production.
3.    Assuming analyst consensus long term copper price of 6,700 $/t and gold price of 1,300 $/oz.
GLOBALLY SIGNIFICANT COPPER RESOURCE
Mineral Resources (Mt copper)1 Possible project
42.5 Under construction
37.0 KAZ Minerals project
27.5 26.7
24.1
22.0
16.4 15.2 15.0
13.4 13.0
9.5
7.1 7.0 6.1 5.5 4.1
Pebble
Panama
Reko Diq
Los Azules
El Pachon
(Peschanka)
Kamoa
Taca Taca
Tampakan
Aktogay
Bozshakol
Quellaveco
Resolution
Udokan
Rio Blanco
Kakula
Galore
La Granja
Baimskaya
Creek
Cobre
The Peschanka deposit in the Baimskaya licence area ranks in the top 10 undeveloped greenfield copper
projects globally
1. Source: Company data. Mineral Resources include Measured and Indicated Resources (bottom bar) and Inferred Resources (top bar).
35ACQUISITION COMPLETED
Initial Completion for 75% stake occurred on 22
January 2019
– $436 million1 in cash paid and 22,344,944 of new
KAZ Minerals PLC ordinary shares issued to
Vendor
Bankable feasibility study in progress
– Fluor appointed as the lead contractor for
feasibility study
– Results expected to be announced in the first half
of 2020
During feasibility study, the Group will continue
discussions with banks and consider partnering
options
Deferred Consideration of $2252 million for Peschanka deposit, Baimskaya copper project
remaining 25% stake, payable in shares or cash
dependent on Project Delivery Conditions
Notes:
1. $50 million of the $436 million Initial Cash Consideration has been withheld pending the release of a guarantee agreement made by the acquired entity which is the legal 36
owner of the Baimskaya licence. The final cash payment of $50 million is expected to be settled in 2019.
2. Vendor will not contribute to development capital expenditure due to Deferred Consideration structureFINANCING
Acquisition cost
Cash component ($436 million) covered by existing
cash resources
Project development
Large scale, low cost project and strong execution
credentials will attract a range of finance options
The Group has a strong track record of obtaining
debt facilities to fund major project development
Financing requirements are manageable:
– Capex spread over 2018-26
– Existing asset base is highly cash generative
– Options for phasing of capex deployment
Financing structure to be developed during Bozshakol construction, 2014
feasibility
Expected to attract interest from Russian, Chinese
and international lenders
37OPERATING IN RUSSIA
Development of the Far East of Russia is a high
priority strategic objective of the Russian
Government
Significant support from the Russian Government
is available in the form of power and transport
infrastructure investments and tax incentives
Vendor retained as local partner for development
phase
KAZ Minerals will have a number of advantages
operating in Russia:
– Close political links with Kazakhstan
– Common language and business culture Chukotka region, Russia
– Customs union (Eurasian Economic Union)
– Experience of cold climate and remote locations
38INFRASTRUCTURE AND GOVERNMENT
SUPPORT UPDATES
Power
Floating nuclear facility successfully tested in Murmansk by Pevek
Rosatom Bilibino
110 kV power
Government funded 110 kV Bilibino-Baimskaya power line on
Baimskaya
schedule to be completed by end of 2019
Road
Construction of Baimskaya-Pevek all-season road progressing in 220 kV power
2019 Magadan
Shipping
Northern Sea Route winter traffic increasing
Tax incentives Copper concentrate
transported by sea to
Existing TASED zone expanded to include Baimskaya licence area Asian markets
Group will apply for project TASED status in due course
Shipping
Power
Road
39Russian government funded floating nuclear power facility ‘Akademik Lomonosov’
Delivery of pylons for
 110 kV power line,
       Pevek
Gold mine
Existing motor roads / winter roads with
extended life Pevek
Existing winter roads Krasnoarmeisky
All-season "Magadan-Anadyr" highway
(under construction) Komsomolsky
All-season highway (completed)
Mayskoye Polymetal
Bilibino
Completed section
Kupol Kinross
BaimskayaGovernment funded
road infrastructure under
construction6. Near and long term growth
NEAR AND LONG TERM GROWTH IN COPPER

       Proven track                            Near term                        Strong
          record                                growth                         platform
       >50% CAGR                                 Aktogay                       Supports
    copper production                           expansion                     Baimskaya
                                                                                                                   Long
         2015-18                                 project                     construction
                                                                                                                   term
                                                                                                                  growth
►   Achieved annual copper
    production guidance for 10
    years
                                      ►   Adds 80 ktpa from 2022-27   ►   Increased earnings and        ►   Strong NPV and
►   Low cost producer
                                                                          cash flow                         attractive IRR
                                      ►   Low risk brownfield
►   Bozshakol and Aktogay
                                          expansion                   ►   Enables financing of longer   ►   Favourable long
    delivered on time and on
                                                                          term growth                       term copper
    budget, ramped up                 ►   Low capital intensity of                                          fundamentals
    successfully                          $15,000/t

2015                           2018                           2021                    2024                        2027

                                                                                                                              45
APPENDIX
SUMMARY INCOME STATEMENT

Key line items                                                                                  Reconciliation of Underlying Profit
$m (unless otherwise stated)                                             2018        2017        $m                                                              2018   2017
Revenues1                                                               2,162       1,663        Net profit attributable to equity shareholders of the Company    510    447
Cost of sales                                                         (1,077)       (755)        Impairment charges                                                20     19
Gross profit                                                            1,085         908        PXF fees                                                           -     10
Operating profit                                                          851         715        Underlying Profit                                                530    476
Net finance costs                                                       (212)       (135)
Foreign exchange gain                                                       3           -
Profit before tax                                                         642         580
Income tax expense                                                      (132)       (133)
Profit for the year                                                       510         447
EPS based on Underlying Profit ($)                                       1.18        1.07

 2018 revenues split by product
                                                                  Copper
                    5% 2% 1%
             10%                                                  Gold
                                                                  Zinc
                                                                  Silver
                                                                  Other

                                     82%

Notes:         .
1. Excludes pre-commercial production revenues in 2017: $275 million (Bozshakol clay $21 million, Aktogay sulphide $254 million).                                         47
REVENUES AND SALES VOLUMES
(COMMERCIAL PRODUCTION ONLY)
Revenues1 Sales volumes1
$m 2018 2017 kt (unless otherwise stated) 2018 2017
Copper cathode 690 629 Copper cathode 106 101
Copper in concentrate 1,087 629 Copper in concentrate2 190 108
Zinc in concentrate 101 115 Zinc in concentrate 50 57
Gold bar 68 78 Gold bar (koz) 54 62
Gold in concentrate 144 138 Gold in concentrate (koz)2 115 107
Silver bar 40 50 Silver bar (koz) 2,518 2,940
Silver in concentrate 15 13 Silver in concentrate (koz)2 1,009 745
Other 17 11
Total revenues 2,162 1,663
Average realised prices LME and LBMA Prices
2018 2017 2018 2017
Copper cathode ($/t) 6,531 6,252 Copper ($/t) 6,526 6,163
Copper in concentrate ($/t)3 5,709 5,837 Zinc ($/t) 2,922 2,896
Zinc in concentrate ($/t) 2,015 2,038 Gold ($/oz) 1,268 1,257
Gold bar ($/oz) 1,265 1,262 Silver ($/oz) 15.7 17.0
Gold in concentrate ($/oz)3 1,258 1,280
Silver bar ($/oz) 15.7 17.1
Silver in concentrate ($/oz)3 15.3 16.5
Notes:
1. Excludes pre-commercial production, therefore excludes Bozshakol clay prior to 1 July 2017 and Aktogay sulphide prior to 1 October 2017. 48
2. Payable metal in concentrate.
3. After the deduction of processing charges.GROSS REVENUES AND SALES VOLUMES
Gross Revenues1 Sales volumes1
$m 2018 2017 kt (unless otherwise stated) 2018 2017
Copper cathode 690 698 Copper cathode 106 112
Copper in concentrate 1,087 834 Copper in concentrate2 190 144
Zinc in concentrate 101 115 Zinc in concentrate 50 57
Gold bar 68 78 Gold bar (koz) 54 62
Gold in concentrate 144 138 Gold in concentrate (koz)2 115 107
Silver bar 40 50 Silver bar (koz) 2,518 2,940
Silver in concentrate 15 14 Silver in concentrate (koz)2 1,009 819
Other 17 11
Total revenues 2,162 1,938
Average realised prices LME and LBMA Prices
2018 2017 2018 2017
Copper cathode ($/t) 6,531 6,233 Copper ($/t) 6,526 6,163
Copper in concentrate ($/t)3 5,709 5,804 Zinc ($/t) 2,922 2,896
Zinc in concentrate ($/t) 2,015 2,038 Gold ($/oz) 1,268 1,257
Gold bar ($/oz) 1,265 1,262 Silver ($/oz) 15.7 17.0
Gold in concentrate ($/oz)3 1,258 1,280
Silver bar ($/oz) 15.7 17.1
Silver in concentrate ($/oz)3 15.3 16.5
Notes:
1. Includes pre-commercial production, therefore includes Aktogay and Bozshakol for the full year. 49
2. Payable metal in concentrate.
3. After the deduction of processing charges.GROSS REVENUE RECONCILIATION
($m) Average LME
Volume2 Commodity prices FY 2018 vs FY 2017
252 20 6%
11
(39) (12) (8) 2,162
1%
1,938
Copper Zinc
By-products
volume ($m)
Gold (1) Average LBMA
Silver (4)
Zinc (13)
FY 2018 vs FY 2017
Other 6 1%
(8)%
Gross Aktogay Bozshakol East Region and By-product Copper By-product Gross
revenues Bozymchak volume price price revenues Gold Silver
2017¹ 2018
Notes:
1. Includes pre-commercial revenues in 2017: $275 million (Bozshakol clay $21 million, Aktogay sulphide $254 million). 50
2. Change in sales volumes at current year price.EBITDA RECONCILIATION EBITDA by operating segment $m 2018 2017 Bozshakol1 520 515 Aktogay1 530 374 East Region and Bozymchak 284 371 Corporate services (24) (25) Gross EBITDA1 1,310 1,235 Less: Capitalised pre-commercial production EBITDA - (197) Bozshakol - (12) Aktogay - (185) EBITDA2 1,310 1,038 Notes: 1. Gross EBITDA excludes MET, royalties and special items and includes the results of pre-commercial production in 2017. 51 2. EBITDA excludes MET, royalties and special items.
CASH FLOW

($m)                                                                                                                                                           2018     2017
EBITDA1                                                                                                                                                       1,310    1,038
Working capital movements2                                                                                                                                    (115)      (40)
Interest paid                                                                                                                                                 (229)    (222)
MET and royalties paid2                                                                                                                                       (208)    (151)
Income tax paid                                                                                                                                                 (95)   (110)
Foreign exchange and other movements                                                                                                                               7        5
Net cash flows from operating activities before capital expenditure and non-current VAT associated with major projects                                          670      520
Sustaining capital expenditure                                                                                                                                  (85)     (68)
Free Cash Flow                                                                                                                                                  585      452
Expansionary and new project capital expenditure3                                                                                                             (530)      (69)
Non-current VAT associated with major projects                                                                                                                     3     232
Proceeds from disposal of property, plant and equipment                                                                                                            -        1
Interest received                                                                                                                                                 32       16
Dividends paid                                                                                                                                                  (27)        -
Other investments                                                                                                                                                 10        -
Other movements                                                                                                                                                  (3)      (1)
Cash flow movement in net debt                                                                                                                                    70     631

Notes:
1. EBITDA excludes MET, royalties and special items.                                                                                                                       52
2. Excludes working capital and MET movements arising from pre-commercial production at the Bozshakol and Aktogay operations in 2017.
3. Capital expenditure includes the capitalisation of revenues, costs and working capital outflows during the periods of pre-commercial production in 2017.
SUMMARY BALANCE SHEET

Assets                                                              Non-current assets
$m                                                   2018    2017   $m                                                    2018       2017
Non-current assets                                  2,897   3,215   Intangible assets                                        6          7
Cash and cash equivalents and current investments   1,469   1,821   Property, plant and equipment                        2,130      2,535
Other current assets                                  674     586   Mining assets                                          432        438
Total                                               5,040   5,622   Other non-current assets                               301        170
                                                                    Deferred tax asset                                      28         65
                                                                    Total                                                2,897      3,215

Equity & liabilities                                                Net debt
$m                                                   2018    2017   $m                                                     2018       2017
Equity                                              1,054     998   Cash and cash equivalents and current investments     1,469      1,821
Borrowings                                          3,453   3,877   Less restricted cash                                     (2)         -
Other liabilities                                     533     747   Borrowings                                          (3,453)    (3,877)
Total                                               5,040   5,622      Short-term                                         (539)      (418)
                                                                       Long-term                                        (2,914)    (3,459)
                                                                    Total                                               (1,986)    (2,056)

                                                                                                                                        53
DEBT FACILITIES
Facility Maturity and interest rate Balance as at 31 December 20181
CDB Bozshakol/ Final maturity 2025 Fully drawn – $1,357 million
Bozymchak $ LIBOR + 4.5% Balance sheet covenant
Semi-annual principal and interest payments
CDB Aktogay Final maturity 2029 Fully drawn – $1,343 million
$ LIBOR + 4.2% (USD facility) Balance sheet covenant
PBoC 5 year (RMB facility)
USD facility - semi-annual principal and interest payments
RMB facility - semi-annual principal and quarterly interest payments
DBK Final maturity 2025 Fully drawn – $278 million
$ LIBOR + 4.5% Balance sheet covenant
Semi-annual principal and interest payments (USD)
PXF Final maturity 2021 Fully drawn – $500 million
Margin based on net debt/EBITDA ratio $600m PXF signed in June 2017
- between $ LIBOR +3.0% to 4.5% - Extended final maturity by 2.5 years to June 2021
Monthly interest payments and principal repayments to June 2021 - Monthly principal repayments from July 2018
Notes:
1. Drawn amount excludes arrangement fees. 54DEBT REPAYMENT PROFILE
Repayment Profile1 ($m)
PXF DBK CDB Aktogay CDB Bozshakol/Bozymchak
545 545
445
358
128
2 2
2019 2020 2021 2022-25 2026-29
Notes:
1. Based on drawn debt facilities at 31 December 2018. 55
2. Average debt repayments per annum.GUIDED CAPITAL EXPENDITURE
Expansionary capex ($m)1
Aktogay I Aktogay II Bozshakol East Region & Bozymchak Baimskaya Other
670
20
70
1 530
70
30
40 460
5
60
204
260
400
60
400
200
290
70
2018A 2019 2020 2021
Notes:
1. Approved projects only. Further guidance on Baimskaya will be provided following completion of the feasibility study. 56GROUP CASH COST RECONCILIATION $m (unless otherwise stated) 2018 2017 2016 H2 2018 H1 2018 H2 2017 H1 2017 H2 2016 H1 2016 Copper sales volumes (kt)1 296 256 141 155 141 141 115 87 54 Revenues 2,162 1,663 766 1,064 1,098 942 721 464 302 EBITDA2 (1,334) (1,063) (375) (631) (703) (624) (439) (248) (127) Pre-commercial production3 - 78 62 - - 38 40 33 29 Cost of purchased copper cathode - - - - - - - - - TC/RCs and other adjustments 111 98 31 56 55 53 45 29 2 Gross cash cost 939 776 484 489 450 409 367 278 206 Gross cash cost (USc/lb) 144 138 156 143 145 132 144 146 173 By-product credits (381) (406) (300) (187) (194) (201) (205) (187) (113) Net cash costs 558 370 184 302 256 208 162 91 93 Net cash cost (USc/lb) 85 66 59 88 82 67 64 48 78 Notes: 1. Includes the results of pre-commercial production in 2016 and 2017. 57 2. EBITDA excludes MET, royalties, special items and corporate services. 3. Cash operating costs capitalised during pre-commercial production.
SENIOR MANAGEMENT
    Oleg Novachuk                          Mian Khalil                         Sergey Leu
    Chair                                  General Director, Projects          General Director, Bozshakol
    Joined the Company in 2001,            Joined the Company in 2010,         Joined KAZ Minerals in August 2016
    former Chief Executive and was         with responsibility for construc-   as General Director of Bozshakol
    appointed Chair on 1 January 2018,     tion of major growth projects,      with responsibility for management of
    with responsibility for strategy,      Aktogay and Bozshakol               Bozshakol operations.
    government relations and business      and is currently focused on the
    development.                           expansion project at Aktogay.

    Andrew Southam                         Eldar Mamedov                       Ilsur Dautov
    Chief Executive Officer                General Director, KMM LLP           General Director, East Region
    Joined the Company in 2006,            Joined the Company in 1996,         Appointed General Director of the
    former Chief Financial Officer and     former Head of Legal and was        East Region in March 2014.
    was appointed Chief Executive          appointed as General Director of    Responsible for the management of
    Officer on 1 January 2018, with        the KMM LLP in 2014, with           East Region operations.
    responsibility of executive manage-    responsibility for government
    ment of the Group and leading the      relations, legal, procurement and
    senior management team in the day      administration.
    to day running of the business.

    John Hadfield                          Madina Kaparova                     Ilyas Tulekeev
    Chief Financial Officer                Group Procurement Director          General Director, Bozymchak
    Joined the Company in November         Joined the Company in 1998 and      Joined KAZ Minerals in 2006 and
    2017 as Deputy Chief Financial         was appointed Group Procu-          was appointed General Director of
    Officer and was appointed Chief        rement Director in 2016, with       Bozymchak in 2011, with response-
    Financial Officer on 1 January 2018.   responsibility for development      bility for management of Bozymchak
                                           and implementation of procu-        operations.
                                           rement strategy.

                                                                                                                    58
INCREASING EFFICIENCY REDUCES
ENVIRONMENTAL IMPACTS
ENERGY USE WATER
TJ/kt sulphide ore processed (energy consumption) Water withdrawal per unit of copper (megalitres/kt)
2017 0.24 2017 190.4
2016 0.46 2016 212.4
2015 0.86 2015 180.7
CO2
CO2 emissions per unit of copper (kt)
2017 8.3
2016 10.3
2015 10.8
CO2 emissions per unit of ore processed (kt) CO2 emissions per $ million revenue (t)
2017 0.05 2017 1,289
2016 0.09 2016 1,923
2015 0.20 2015 1,376
59RESTRUCTURING OCTOBER 2014
Disposal Assets
Copper and other metals
Coal mines
Captive Power
KAZ Minerals
Growth projects
Copper and other metals
60MINERAL RESOURCES SUMMARY - 31 DEC 2017
Artemyevsky Irtyshsky Orlovsky Bozymchak Aktogay Aktogay Bozshakol Bozshakol
sulphide oxide sulphide clay
Resources1 (kt) 24,1962 4,645 13,461 15,729 1,583,454 90,257 872,164 26,619
Copper grade (%) 2.06 2.26 3.09 0.84 0.33 0.36 0.35 0.65
Zinc (%) 4.43 5.36 3.99 - - - - -
Gold grade (g/t) 0.9 0.4 0.9 1.4 - - 0.1 0.7
Silver grade (g/t) 88 88 38 8.6 - - 1.3 1.3
Molybdenum grade (%) - - - - 0.008 - 0.005 -
Type of mine Underground Underground Underground Open pit / Open pit Open pit
underground
Concentrator Nikolayevsky Belousovsky On-site On-site On-site On-site
Description Mine with Irtyshsky has Orlovsky is the Bozymchak is Large scale mine, located in East Large scale mine, located in
polymetallic ore, been largest mine in located in Region of Kazakhstan. Commenced Pavlodar Region of Kazakhstan.
operating since operating East Region by Kyrgyzstan production of copper cathode from Commenced production of copper
2005 since 2001 copper metal in oxide ore in December 2015 and in concentrate from sulphide ore in
ore extracted copper in concentrate from sulphide February 2016
ore in February 2017
Notes:
1. Measured and indicated as at 31 December 2017. 61
2. Includes Artemyevsky II expansion.TAILINGS FACILITIES
First Expected
Facility Type construction closure date Status
Bozshakol Downstream 2016 2058 Active
Aktogay Downstream 2017 2045 Active
Bozymchak Dry stack 2014 2032 Active
East Region
Zhezkentsky Upstream 1989 2026 Active
Nikolayevsky Upstream 1980 20201 Active
Belousovsky Upstream 1949 Under review Active
Berezovsky Upstream 1945 - Inactive /
decommissioning
Notes:
1. Artemyevsky mine transitioning in 2020 to in-pit tailings disposal in the Nikolayevsky open pit. 62KAZ Minerals PLC 6th Floor, Cardinal Place 100 Victoria Street London SW1E 5JL UK www.kazminerals.com
You can also read