FY 2018 RESULTS PRESENTATION - MARCH 7, 2019 - ProSiebenSat.1 Media SE

Page created by Chris Vega
 
CONTINUE READING
FY 2018 RESULTS PRESENTATION - MARCH 7, 2019 - ProSiebenSat.1 Media SE
MARCH 7, 2019

     FY 2018
RESULTS PRESENTATION
FY 2018 RESULTS PRESENTATION - MARCH 7, 2019 - ProSiebenSat.1 Media SE
FY 2018
         MAX CONZE – CEO

AGENDA   FINANCIAL UPDATE
         DR. JAN KEMPER – CFO

         STRATEGIC OUTLOOK 2019
         MAX CONZE – CEO

                                  2
FY 2018 RESULTS PRESENTATION - MARCH 7, 2019 - ProSiebenSat.1 Media SE
FOCUS FOR TODAY

1   Wrap-up of FY 2018: Update on financials and dividend

2 First glimpse on Q1 2019: Continuation of positive trend on Group level

3   Update on our strategy communicated at CMD 2018
    − We are in the midst of transformation with clear focus on execution
    − Too early for a dedicated report but like to give an overview of our core
      priorities as first turning points come to life

4 Financial outlook for 2019 – focus on ‘EXECUTE & DELIVER‘

                                                                                  3
FY 2018 RESULTS PRESENTATION - MARCH 7, 2019 - ProSiebenSat.1 Media SE
MARCH 7, 2019

FY 2018

MAX CONZE – CEO
FY 2018 RESULTS PRESENTATION - MARCH 7, 2019 - ProSiebenSat.1 Media SE
GROUP FINANCIALS FOR FY 2018

 [in EUR m]                                [in EUR m]                              [in EUR m]
                              -2%                                       -4%                                   -2%
 EXTERNAL REVENUES                         ADJUSTED EBITDA                         ADJUSTED NET INCOME

                              +1%                                       25%
                              portfolio/                                adjusted
                              currency                                  EBITDA
                              adjusted                                   margin

              4,078   4,009                             1,050                                   550    541
                                                                1,013

               FY      FY                                FY      FY                              FY     FY
              2017    2018                              2017    2018                            2017   2018

                                                                                                                    5
FY 2018 RESULTS PRESENTATION - MARCH 7, 2019 - ProSiebenSat.1 Media SE
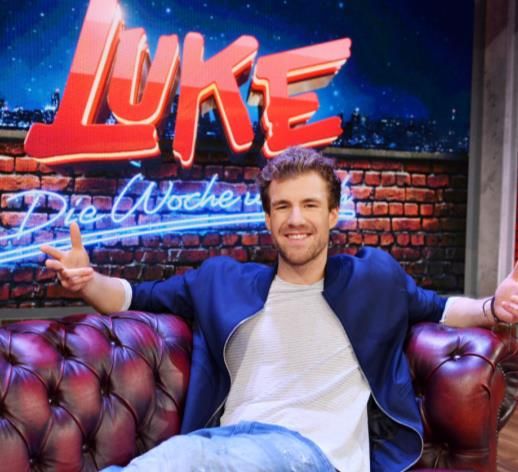
IMPROVEMENT OF PORTFOLIO/CURRENCY ADJUSTED REVENUE
GROWTH ON GROUP LEVEL IN H2 2018
External revenue growth

                GROUP                  ENTERTAINMENT                           CONTENT PRODUCTION &                       COMMERCE
                                                                                   GLOBAL SALES
                                                                                                     21%    23%
                                                                                                                                               18%
                                                                                                                              13%   12%
                                  3%
                0%      0%

                                       0%        -1%

     -4%                                                                          -12%        -10%                -11%
                                                                  -5%
                                                       -7%

           H1                H2             H1               H2                          H1                H2            H1               H2

                                                  Reported         Portfolio/currency adjusted

                                                                                                                                                     6
FY 2018 RESULTS PRESENTATION - MARCH 7, 2019 - ProSiebenSat.1 Media SE
2018 DIVIDEND PROPOSAL

 ADJUSTED EBITDA         DIVIDEND

 EUR     1,013m          EUR      1.19       PER SHARE
 (-4% VS. PY)            (VS. PY EUR 1.93)

 ADJUSTED NET INCOME

 EUR     541m            EUR     269m            TOTAL DIVIDEND PAYMENT
 (-2% VS. PY)            (VS. PY EUR 442m)

                         PAY-OUT RATIO:      ~50%
                                                                          7
FY 2018 RESULTS PRESENTATION - MARCH 7, 2019 - ProSiebenSat.1 Media SE
MARCH 7, 2019

FINANCIAL UPDATE

       DR. JAN KEMPER – CFO &
   Executive Board Member Commerce
FY 2018 RESULTS PRESENTATION - MARCH 7, 2019 - ProSiebenSat.1 Media SE
+1%
GROUP FINANCIALS                                                            portfolio/
                                                                         currency adj.
                                                                        revenue growth
                                                                           in FY 2018

                                                                                         COMMENTS
External revenues and adjusted EBITDA
[in EUR m]
                                                                                •   Slight portfolio/currency adj. revenue
                                                                                    growth supported by Commerce and
                  Q4 2018   Q4 2017     YoY   FY 2018   FY 2017   YoY               CP&GS segment which more than
                                                                                    compensated lower advertising revenues
                                                                                    in Entertainment segment
Ext. revenues       1,323     1,324     0%    4,009     4,078     -2%
                                                                                •   Declining reported revenues and earnings
                                                                                    due to negative net deconsolidation
Adj. EBITDA         379       390       -3%    1,013    1,050     -4%               effects (primarily related to Online Travel,
                                                                                    maxdome and 7NXT)
Adj. net income     236        219      +8%    541       550      -2%
                                                                                •   Reorganization program with positive
                                                                                    impact on Group SG&A expenses
                                                                                    (portfolio/currency adj.)

                                                                                •   Q4 2018: Portfolio/currency adj. revenue
                                                                                    growth of +3%, adj. net income benefited
                                                                                    from lower taxes

                                                                                                                               9
FY 2018 RESULTS PRESENTATION - MARCH 7, 2019 - ProSiebenSat.1 Media SE
-3%
ENTERTAINMENT: SEGMENT PERFORMANCE                                           portfolio/
                                                                          currency adj.
AFFECTED BY ADVERTISING BUSINESS AND                                     revenue growth
                                                                            in FY 2018
DECONSOLIDATIONS
External revenues and adjusted EBITDA
                                                                                          COMMENTS
[in EUR m]
                                                                                 •   Stable TV advertising revenues January
                  Q4 2018    Q4 2017    YoY    FY 2018   FY 2017   YoY
                                                                                     to October 2018 followed by decline at
                                                                                     year-end reflecting tougher comparable
Ext. revenues       827        914      -10%   2,626     2,737     -4%               figures (Q4 2017: +6%) and lower
                                                                                     demand in important add-on booking
                                                                                     season
  Advertising        725       787      -8%     2,238     2,335    -4%
                                                                                 •   Lower other advertising revenues
                                                                                     throughout the year (partly related to
  Distribution       37        35       +3%      141       133     +6%               loss of Sport1 customer)

  Other              65         91      -28%    247       270      -8%           •   Continuing expansion of distribution
                                                                                     business (HD, mobile TV, NPVR, etc.)

Adj. EBITDA          313       333      -6%     881       898      -2%           •   Adj. EBITDA margin improvement due to
                                                                                     lowered SG&A expenses as well as IFRS
                                                                                     16 effect which more than offset adjusted
                                                                                     programming cost increase

                                                                                                                              10
OPERATIONAL KPIS ENTERTAINMENT
                     VIEWING                                 AUDIENCE/                                    ADVERTISING
                       TIME                                 MARKET SHARE                                    SHARE                                              OTHER

                   Total video                                                                        TV core advertising
                                                            Audience share2)                                                                           HD subscribers
                   viewtime1)                                                                           revenue share3)
                                                    +0.8%                                        +1%
        -0%                                                                                                                                  +8%
                                                      pts
               1,078bn
                                                                                                 pts

                  min                                       27.8%                                           94%                                          9.5m
         vs. 1,083bn min in FY 2017                         vs. 27.0% in FY 2017                         vs. 93% in FY 2017                            vs. 8.8m in FY 2017

                                                                                                           Digital & smart
            Total daily TV                             Gross TV advertising                                                                          RAS grid share
                                                                                                             advertising
         consumption (AGF)4)                              market share5)                                   revenue share6)
                                                                                                                                                 (local commissioned)7)
                                                     +1%                                         -1%                                          -1%
        -2%
                                                     pts                                         pts                                          pts

          234min                                               49%                                             6%                                          16%
              vs. 238min in FY 2017                         vs. 48% in FY 2017                            vs. 7% in FY 2017                             vs. 17% in FY 2017

              1) Viewtime for linear P7S1 channels and digital platforms (TV websites, mobile apps, SmartTV, red button (HbbTV), 7TV) excl. Studio71); 2) P7S1 free to air audience share (A 14-49); 3) TV core
              advertising revenues in % of total advertising revenues; 4) Target group: 14+; 5) Gross TV advertising in % of total advertising market spendings (w/o e.g. YouTube, Facebook, Instagram, Search);
              Source: Nielsen; 6) Digital & smart revenues (e.g. APS advertising, Addressable TV, digital platforms) in % of total advertising revenues; 7) Primetime hours of Red Arrow Studios’ local content in
              % of primetime hours of all aired local content; core channels only (SAT.1, ProSieben, kabel eins); limited comparability of FY 2017 figure due to change of calculation method (switch from
              program spend to hours aired)                                                                                                                                                                          11
OUTCOME OF U.S. CONTENT REVIEW: SUBLICENSING AGREEMENT
WITH 7TV JOINT VENTURE AND RECOGNITION OF PROVISION
           SUBLICENSING AGREEMENT WITH 7TV JOINT VENTURE                                                                                                 NO FURTHER USE

▪   Program rights not suitable for exploitation on linear TV anymore, 7TV to offer                                                       ▪   No further use of selected U.S. content
    niche U.S. program going forward

▪   7TV to pay low single-digit Euro million amount reflecting fair market value for
    acquisition of U.S. content (linear and catch-up)

▪   7TV to launch U.S. fiction channel on new platform in 2019

                         ▪     Unscheduled consumption in Q4 2018 and recognition of provision for anticipated losses

                                                                                                       EUR
+5%
CONTENT PRODUCTION & GLOBAL SALES:                                            portfolio/
                                                                           currency adj.
STRONG SEGMENT PERFORMANCE IN Q4                                          revenue growth
                                                                             in FY 2018

External revenues and adjusted EBITDA
                                                                                           COMMENTS
[in EUR m]

                   Q4 2018   Q4 2017    YoY    FY 2018   FY 2017   YoY            •   Strong recovery of Red Arrow Studios’
                                                                                      content production business in H2 2018 due
                                                                                      to realization of projects that were affected
 Ext. revenues       191       148      +29%    552       523      +6%                by phasing, meaningful growth contribution
                                                                                      from Kinetic Content and 44 Blue
                                                                                      Productions
  Production         100        73      +38%    296       305      -3%
                                                                                  •   Studio71 with double-digit growth in
  Global Sales        16        18      -13%     56        46      +22%               FY 2018, strong acceleration in Q4 2018 to
                                                                                      +31% revenue growth

  Studio71           75         57      +31%     199       172     +16%           •   Q4 2018 portfolio/currency adj. segment
                                                                                      revenue growth of +33%

 Adj. EBITDA          11        -2      n.a.     31        19      +66%           •   Growth in adj. EBITDA primarily driven by
                                                                                      reduced losses of Studio71

                                                                                                                               13
OPERATIONAL KPIS CONTENT PRODUCTION & GLOBAL SALES

                        # of                                   # of hours
                                                                                                 Returning shows1)                       Titles in catalogue
                    productions1)                              produced1)
           -11%                                    -12%                                     -4%                                     +10%

                        215                                     1.0k                                      105                                   4.4k
                   vs. 242 in FY 2017                        vs. 1.2k in FY 2017                     vs. 109 in FY 2017                      vs. 4.0k in FY 2017

                                                               Monthly                               # of YouTube                          Monthly minutes
              # of web channels2)
                                                             video views2)                           subscribers2)                            watched2)
          +5%                                     +22%                                     +45%                                     +30%

                       1.4k                                 9.0bn                                     1.2bn                                    38bn
                    vs. 1.3k in FY 2017                    vs. 7.4bn in FY 2017                     vs. 0.8bn in FY 2017                     vs. 30bn in FY 2017

          1) Current shows in production with revenues EUR >50k (including pilots, commercials, without development deals, multiple seasons counted as separate productions, without digital productions
          of RedSeven); 2) Excluding unconsolidated subsidiary in France                                                                                                                                   14
+16%
COMMERCE: STRONG GROWTH ACROSS ALL                                             portfolio/
                                                                            currency adj.
FOUR KEY VERTICALS                                                         revenue growth
                                                                              in FY 2018

External revenues and adjusted EBITDA
                                                                                            COMMENTS
[in EUR m]
                  Q4 2018   Q4 2017     YoY     FY 2018   FY 2017   YoY
                                                                                   •   Strong and balanced portfolio/currency
                                                                                       adj. revenue growth of +16% in FY 2018
Ext. revenues       306       262       +17%     831       818      +2%                with contributions from all key verticals
  Consumer
                     73        63       +15%     204        178     +15%           •   Deconsolidation of Online Travel business
  Advice
                                                                                       (etraveli, tropo, COMVEL revenues:
  Matchmaking        45        31       +45%      143       123     +16%               -EUR 134m) partly offset by first time
                                                                                       consolidation of Jochen Schweizer,
  Experience &                                                                         eHarmony and Aboalarm (EUR 40m)
                     53        38       +39%      94        55      +71%
  Gift Vouchers
                                                                                   •   Q4 2018 portfolio/currency adj. segment
  Beauty &                                                                             revenue growth of +20%
                     134       111      +21%     337       278      +21%
  Lifestyle
                                                                                   •   Decline in adj. EBITDA primarily related to
  Other              -/-       18       -100%     54        184     -71%
                                                                                       implementation of new media contract
                                                                                       with SevenOne Media as well as provision
Adj. EBITDA          54        58       -6%      103       135      -24%               at Verivox due to insolvency of large
                                                                                       energy provider
                                                                                                                               15
OPERATIONAL AND FINANCIAL KPIS COMMERCE

                  CONSUMER                            MATCHMAKING2)                           EXPERIENCE &                                 BEAUTY &
                   ADVICE                                                                    GIFT VOUCHERS3)                               LIFESTYLE

               # of transactions1)                    # of registrations                            # of orders                       # of transactions4)

         +2%                                  +38%                                     +49%                                    +28%

                  3.5m                                    2.6m                                      1.3m                                   3.0m
                  vs. 3.4m in 2017                         vs. 1.9m in 2017                        vs. 0.9m in 2017                        vs. 2.4m in 2017

                 Ext. revenues                            Ext. revenues                           Ext. revenues                           Ext. revenues
                    in EUR                                   in EUR                                  in EUR                                  in EUR
         +15%                                  +16%                                    +71%                                    +21%

                204m                                      143m                                      94m                                   337m
                  vs. 178m in 2017                         vs. 123m in 2017                        vs. 55m in 2017                         vs. 278m in 2017

           1) Includes number of Verivox orders and of SilverTours bookings; 2) Consolidation of eHarmony as of November 2018; 3) Consolidation of Jochen Schweizer Group as of October 2017; 4) Includes
           Flaconi and Amorelie B2C only                                                                                                                                                                    16
INCREASE IN NET DEBT DRIVEN BY M&A, DIVIDEND AND SHARE BUYBACK

Netfinancial
Net  financial
             debtdebt
[inEUR
[in EURm]m]                                                                                                                                    2.1x

                                 1.6x                                                                                                                              2.1x

                   1.6x                                                                               531                                                         2,163

                                1,632

                             12/31/2017                                                             Change                                                       12/31/2018

                                                                                                                                                                              LEVERAGE RATIO

                          Leverage ratio: Net financial debt/LTM adjusted EBITDA; LTM adjusted EBITDA amounts to EUR 1,013m (previous year: EUR 1,050m)
                          Note: IFRS net financial debt as per P7S1 definition (i.e. excluding EUR 155m lease liabilities and EUR 22m real estate liabilities)                             17
UPDATE ON SHARE BUYBACK PROGRAM

          •   On November 7, 2018, the Executive Board and Supervisory Board of P7S1
              resolved on a program for the buyback of own shares by the Company
              with a total volume of up to EUR 250m and an overall period of 12 to 24
              months

 SHARE    •   On that basis, the Executive Board of P7S1 resolved upon a first tranche of
              such a buyback of own shares of the Company through the stock exchange
BUYBACK   •   The first tranche of the buyback has been executed in the period from

PROGRAM       November 9, 2018 to December 11, 2018 (including)

          •   A total number of 2,906,226 shares have been acquired; this corresponds
              to approx. 1.25% of the share capital of P7S1. The average purchase price
              per share paid on the stock exchange amounted to EUR 17.2044

          •   In total, own shares were acquired for an aggregated amount of EUR
              49,999,999.46 (not including costs of acquisition)

                                                                                            18
MARCH 7, 2019

STRATEGIC OUTLOOK
      2019

      MAX CONZE – CEO
OVERALL POSITIVE GROUP REVENUE PERFORMANCE IN Q1 2019
Portfolio/currency adj. external revenues
                                      Q4 2018 Q1 2019E
                                                                                                        Comment on Q1 2019
                                        YoY     YoY
 GROUP                                                                                                  CONTINUATION OF POSITIVE TREND

 ENTERTAINMENT                                                                                          BELOW PRIOR YEAR
 Audience share/video views1)
 TV core advertising revenues2)                                                                         Below prior year with late Easter as key driver
 Digital & smart advertising revenues3)                                                                 Return to low double-digit growth
 Distribution revenues                                                                                  Improvement vs. Q4 2018, high single-digit % growth
 Other revenues                                                                                         Flat, growth of AdTech/7Sports offset by program sales

 RED ARROW STUDIOS4)                                                                                    DOUBLE-DIGIT GROWTH

 NUCOM GROUP5)                                                                                          DOUBLE-DIGIT GROWTH
                    1) Basis Audience Share: all German TV households, A 14-49, Mon-Sun, 3-3h. Source: AGF in cooperation with GfK/videoScope/P7S1 TV Deutschland; Basis video views: includes own digital
                    channels (websites, mobile apps, smartTV, HbbTV), YouTube (TV Content/Germany) and syndication (TV Content/Germany); 2) TV core advertising revenues include traditional TV brand
                    advertising revenues and SevenVentures excl. Addressable TV; 3) Digital & smart advertising revenues refer to all digital and targeted advertising revenues (e.g. APS advertising, Addressable TV,   20
                    digital platforms); 4) Refers to segment Content Production & Global Sales; 5) Refers to segment Commerce
CAN WE GROW AGAINST A DECLINING TV MARKET?

                                                                                                                 VIEWING TIME                                                  ADVERTISING MARKET
 MARKET VIEW                                                                                              [average minutes per day]1),2)                                           [in EUR m]2)
 DEVELOPMENT FY 2018 YoY

 TOTAL VIDEO                                                                                                               +2%                                                             +4%

 TV                                                                                        TV
                                                                                                                           -2%                                                      -3% to -4%

 ONLINE VIDEO                                                                           ONLINE
                                                                                        VIDEO3)
                                                                                                                         +34%                                                             +48%

 ENTERTAINMENT SEGMENT                                                                              EXT. REVENUE4)                      SHARE
                                                                                                                                                                                          IMPACT
 FY 2018                                                                                                                                                                               [illustrative]

 TV CORE ADVERTISING                                                                               ~EUR 2.1BN                          ~80%                                 -1%  ~EUR -20M

 DIGITAL & SMART AD, DISTRIBUTION, OTHERS                                                          ~EUR 0.5BN                          ~20%                                +4%  ~EUR +20M

                   1) Target group: A 14-69; 2) Source: TV advertising market and online video advertising market (ViewTime Report, SevenOne Media, forsa). Total video advertising market (Magna Global, as of
                   December 2018); 3) Free (incl. social networks) and paid video; 4) Portfolio/currency adjusted                                                                                                 21
OUR VISION: CREATE A
CONSUMER-CENTRIC
ENTERTAINMENT
AND COMMERCE
CHAMPION
                          ENTER-
                          TAINMENT    COMMERCE
                          & CONTENT   CONSUMERS
CONSUMER-LED & OBSESSED                    NEED
                          CONSUMERS
CONTENT-LED               LOVE

DIGITAL FIRST

TOTAL REACH

GROWTH-DRIVEN

PASSIONATE CREATORS

                                                  22
RECAP CMD:
STRATEGIC PRIORITIES ACROSS OUR THREE PILLARS

     ENTERTAINMENT                                         RED ARROW STUDIOS1)                             NUCOM GROUP2)
                                                                                                           FOCUSED PORTFOLIO
 1   LOCAL CONTENT                                         5        INTERNAL CONTENT FEED              6   SERVING CONSUMER NEEDS

 2   DIGITAL ATTACK                                                 SYNERGISTIC FOOTPRINT
                                                                                                           MARKET LEADERS

 3   TOTAL REACH                                                    SCALE OF STUDIO71

 4   SMART REACH

     TOTAL MONETIZATION

     ONE ENTERTAINMENT

 7   ONE COMPANY            ORGANIZATIONAL SET-UP FOR FUTURE GROWTH

               1) Refers to segment Content Production & Global Sales; 2) Refers to segment Commerce                                23
1 LOCAL CONTENT
    INCREASE IN MARKET SHARE & VIDEO VIEWS SUPPORTS OUR TRACK
       FACTUAL                      SHOW/REALITY                                               COMEDY                                             FICTION                              SPORTS

• Galileo and taff with      • Format brand TVOG                                 • Formats with top face                            • New co-production with                   • U21 EURO qualifier
  highest market shares        successfully expanded,                              Luke Mockridge (Dt.                                7TV: CheckCheck with                       matches for the next four
  since 2016                   e.g. The Voice Senior                               Fernsehpreis & Grimme-                             Klaas Heufer-Umlauf                        years secured
• SAT.1 Frühstücksfernsehen • New lighthouse Dancing                               Preis winner) success-                           • Bestseller crime movies                  • Strategic eSport rights
  with six-year-high in 2018   on Ice established                                  fully expanded                                     successfully launched,                     portfolio
                             • GNTM with best start                              • New faces established,                             e.g. Zersetzt
                               since 2011                                          e.g. Faisal Kawusi

                            INCREASED AUDIENCE SHARE BY +1.4%pts TO 27.5% IN 20191)

                           1) February 2019 YTD, Basis: all German TV households, A 14-49, Mon-Sun, 3-3h; Source: AGF in cooperation with GfK/videoScope/P7S1 TV Deutschland                         24
2 DIGITAL ATTACK
 7TV – PREPARATION OF JOINT STREAMING PLATFORM LAUNCH

                                                                                               STRONG MANAGEMENT                                           TEAM INCLUDING
                                                                                               DEDICATED CONTENT LEAD

                                                                                               IN 2019 UP TO EUR 100M INVEST1) TO CREATE THE
                                                                                               LEADING GERMAN ENTERTAINMENT HUB

                                                                                               USER INCREASE BY 27%2) YOY

                                                                                               STAFF OF 200 PREPARING FOR RELAUNCH IN
                                                                                               SUMMER 2019 – WITH ENTIRE P7S1 TRAILER
                                                                                               VOLUME

                                                                                              >30 NEW CONTENT
                                                                                              PARTNERS3)

            1) 7TV invest, jointly by P7S1 and Discovery; 2) Based on monthly active users of 7TV and on number of subscribers of maxdome and Eurosport Player, December 2018; 3) Only extract of all
            channels/partners, e.g. GEMA/VFF portfolio of FTA channels.                                                                                                                                 25
            Source: P7S1 company data
3 TOTAL REACH
 BUILD NEW SALES METRIC TO COMMERCIALIZE TOTAL REACH
 RECAP: OBJECTIVE           METRICS                                                     MONETIZATION

                                          # OF MINUTES
                                                                                 ✓
                                                                                        BUILD MARKETABLE                H2
                                          Total video viewtime: no. of minutes

                            TOTAL VIDEO
                                                                                        AD PRODUCTS                    2019
               OWN APPS &                 viewed across all platforms                   based on Total Video and Total
         .de   WEBSITES
                                                                                        Reach metrics
     +
                                          # OF AD IMPRESSIONS                           • Packaged across all platforms
               DIGITAL                                                            IN
               CHANNELS /
                                          Cross campaign rating: no. of ad       PREP   • Pricing / Yield Management
               YOUTUBE                    impressions across all platforms
     +
                                                                                        RUN SALES SET-UP
                                                                                        to market our new ad products
                            TOTAL REACH

               LINEAR TV
                                          # OF EYEBALLS                                 covering all platforms
                                          Market currency (AGF): no. of       H1
                                          eyeballs reached across all        2019       • Client focused
                                          platforms (YouTube in negotiation)            • Direct and efficient

                                                                                                                          26
PILOT
4 SMART REACH                                                                                   of smart ad
                                                                                               portfolio with
 LAUNCHING NEXT LEVEL OF OUR TARGETABLE OFFERINGS                                              NuCom assets
                                                                                                 launched

 RECAP: OBJECTIVE              COMMERCIAL LAUNCH OF NEW AD PRODUCTS

       Smart Reach                   ADDRESSABLE TV SPOT                        CROSS-DEVICE BRIDGE
             =
   Addressing individual                 P7S1 MEDIA
    audiences based on
       data insights                                                                                    ID

        Age

   SOCIODEM   GEO   PURCHASE
                     INTENT
                                                  ADDRESSABLE TV SPOT

                                   Targeting individual households by       Delivering ONE advertising message to
                                replacing linear ads with Addressable TV      an individual household across all
                                spots (digital spot-overlay) on smart TVs           Entertainment devices

                                   SUCCESSFUL           COMMERCIAL            SUCCESSFUL           COMMERCIAL

                                             ✓                                           ✓
                                      TEST               LAUNCH H1               TEST               LAUNCH H2

                                                                                                                    27
4 TECH PLATFORMS
 ROLL-OUT OF OUR TECH PLATFORMS WITH 2019/20 AS KEY YEARS

  Advertising
  offerings
                   SOM                  SOM       Video      KPI-driven    Retail     Video       Influencer

                                                                                                               ‘Applications’
                  AddTV                Digital   audience     solutions    media     content      marketing
                                                  reach                             marketplace

  Technology
  platforms     AdServer                                     ADITION

                                                                                                               ‘Infrastructure’
                Demand Side Platform                        Active Agent

                Supply Side Platform                          Yieldlab

                Data Management Platform                     The ADEX

                                                                                                                                  28
5 INTERNAL CONTENT FEED – RAS1) FOR ENTERTAINMENT

 GROW RED ARROW STUDIOS’ GRID SHARE…                                                                …BY PRODUCING CONTENT FOR ENTERTAINMENT

                                                                                                                                           UPCOMING
                                                                                                                                             IN Q2
                                                                                                                                                                                                              UPCOMING
                                                                                                                                                                                                                IN Q2
                                                                     2023+                                       SUPERHERO GERMANY

                                                              >30%
                                                                       2019                                                                          UPCOMING
                                                                                                                                                       IN Q2
                                                             ~20%                                                                                                                 TOP CHEF GERMANY

                                                                FY 20182)

                                                                   16%                                                  MEIN BESTER STREICH

   On track to achieve >30% Red Arrow Studios’                                                                          Strong pipeline of local content for our
       grid share in Entertainment by 2023+                                                                            Entertainment segment produced by RAS

                  1) Red Arrow Studios; 2) Primetime hours of Red Arrow Studios local content in % of primetime hours of all aired local content; core channels only (SAT.1, ProSieben, kabel eins; limited
                  comparability of FY 2017 figure due to change of calculation method (switch from program spend to hours aired)                                                                                   29
6 FOCUSED PORTFOLIO – NUCOM GROUP
 STRONG GROWTH TRAJECTORY TO ~EUR 2BN TARGET
                                                                                                                                                                            REVENUE2)
                                                                                                                                                                            [in EUR BN]           ~2.0
          ESTABLISHED NUCOM &
           SIGNED DEAL WITH GA                                                                                      ACQUIRED MAJORITY
                                                                                                                      IN AROUNDHOME
• Carve-out 10 focus companies and
  foundation of NuCom Holding                                                                                     ▪ NuCom took over GA‘s
• Minority investment of GA in NuCom                                                                                shares, now holding 94%
• Buyout of minorities in core assets to                                                                          ▪ In exchange, GA increased
  simplify NuCom structure                           KICKED-OFF MAJOR                                               stake in NuCom to 28.4%                                               ~1.0
                                                    OPER. IMPROVEMENTS
                                                                                                                                                                                0.8
                                                    • Tech/IT audits with GA                                                             Q1 2019
                 INTRODUCED
                                                    • Pricing reviews with GA
                NEW PROCESSES                                                                                                                                                                     INCL.
                • Governance                                                                                         MANAGEMENT/
                                                                                                                                                                                                  M&A
                • Media, data                                                                                        ORG. UPGRADES
                • Holding services
                                                                                              Q4                Top-notch network and                                          2018       2019E   2023+3)
                                                                Q3                          +20%1)              talents: Hired 4 new CEOs
                                                                                                                and 5 further C-level
                                                                                                                candidates for portfolio
                                                                                                                                                                               On track to achieve
                              Q2                              +14%1)                                                                                                               revenues of
 Q1 2018
                            +17%1)               Revenue
                                                                                                                      DELIVERED                                                ~EUR 1BN in 2019
  +9%1)                                           growth
                                                                                                                    EHARMONY DEAL

                              1) Portfolio/currency adjusted revenue growth (YoY) of segment Commerce; 2) Reported revenues of segment Commerce; 3) Mid-term target 2023+                             30
6 FOCUSED PORTFOLIO – NUCOM GROUP
 M&A DEALS TO STRENGTHEN TWO OF OUR CORE VERTICALS

                     >250M                              140M                                                                                >200M                               85M
                    EUR PRO-FORMA                                                                                                          EUR PRO-FORMA                          USD
                                                           EUR
                      COMBINED                                                                                                                COMBINED                         ENTERPRISE
                                                        ENTERPRISE
                     REVENUES of                                                                                                             REVENUES3)                          VALUE4)
                                                          VALUE2)
                      VERTICAL1)

  NUCOM GROUP INCREASED SHARE TO                                                                EHARMONY INTEGRATION WITH PARSHIP ELITE
  MAJORITY OF 94% IN AROUNDHOME                                                                 GROUP ON TRACK: LEVERAGE PEG‘S LEARNINGS
  STREAMLINED ORGANIZATION AND                                                                  (E.G. CAMPAIGNING)
  GOVERNANCE

               1) Combined revenues of Consumer Advice Vertical (Verivox, SilverTours, Aroundhome) 2018E; 2) Publicly stated enterprise value as of January 2019; 3) Parship Elite Group and eHarmony pro-
               forma combined revenues on time of acquisition Q3 LTM 2018; 4) Publicly stated enterprise value as of October 2018                                                                            31
               Source: P7S1 data; NuCom Group, company information
7 ONE COMPANY – SET-UP FOR FUTURE GROWTH

                                     ProSiebenSat.1 Media SE

                                                                                                                                                         • Clear & efficient holding
                                                                                                                                                           structure established
                                                                                                                                                         • Sharpened Executive
                                                                                                                                                           Committee to 3 members

                           RAINER                         MAX                     CONRAD
                                                                                                                                                         • Increased independency &
                         BEAUJEAN1)                      CONZE                    ALBERT                                                                   operative decision-making
                                                                                                                                                           power for each segment
     Entertainment                         Red Arrow Studios3)                                          NuCom Group4)
                                                                                                                                                         • Each segment led by two
                                                                                                                                                           co-CEOs
                                                                                                                                                         • W. Link & M. Tod to co-lead
                                                                                                                                                           the Entertainment segment
                                                                                                                                                         • NuCom co-CEOs directly
  WOLFGANG   MICHAELA                       JAMES                     REZA                        DR. FLORIAN             CLAAS VAN                        report to Group CEO
    LINK       TOD2)                        BAKER                     IZAD                        TAPPEINER                DELDEN

                        1) As of July 2019; 2) As of April 2019; 3) Refers to segment Content Production & Global Sales; 4) Refers to segment Commerce                                 32
OPERATIONALIZATION OF OUR STRATEGIC
TRANSFORMATION ONGOING
  Streamlined our organization with lean executive team
              and dedicated segment heads

        Strengthening our tech foundation with new
   Chief Technology Officer (CTO) starting in June 2019

    Established a dedicated Chief HR Officer (CHRO)
       in January 2019 to ensure best-in-class staff

          Focused strategy execution along clear
             operational and financial KPIs

   Started further discussions with potential partners
                to diversify and drive scale

                                                          33
RECAP: OUR GROUP GROWTH AMBITIONS

                           FY 2018                                                                                                   AMBITION IN ~5+ YEARS
                                                                                                                                     INCL. BOLT-ON M&A

               REVENUES                               ADJ. EBITDA                                                                                    REVENUES                            ADJ. EBITDA
                     [EUR]                                   [EUR]                                                                                         [EUR]                               [EUR]

               4BN                                       1BN                                                                                         6BN                               1.5BN
 NON-ADVERTISING                   DIGITAL                   SMART ADVERTISING SHARE                                         NON-ADVERTISING                          DIGITAL                 SMART ADVERTISING SHARE OF
  REVENUE SHARE                 REVENUE SHARE                   OF ENTERTAINMENT                                              REVENUE SHARE                        REVENUE SHARE               ENTERTAINMENT ADVERTISING
      GROUP                        GROUP1)                    ADVERTISING REVENUES2)                                              GROUP                               GROUP1)                         REVENUES2)

   44      %                       30           %                          6      %                                              50            %                     50            %                       25           %

             COMMERCE                         RED ARROW STUDIOS                                                                                    COMMERCE                      RED ARROW STUDIOS
             REVENUES                          GRID SHARE (LOCAL                                                                                   REVENUES                       GRID SHARE (LOCAL
                   [EUR]                                                                                                                                [EUR]
                                                COMMISSIONED)                                                                                                                      COMMISSIONED)

           0.8BN                                    16%                                                                                            2BN                                30%
                             1) Incl. digital businesses from Entertainment, NuCom Group (referring to the segment Commerce) and Red Arrow Studios (referring to the segment Content Production & Global Sales); 2) Digital
                             & smart revenues (e.g. APS advertising, Addressable TV, digital platforms) in % of total advertising revenues                                                                                    34
OUTLOOK FY 2019

                                                    FY 2019 OUTLOOK                                                               COMMENTS

 GROUP REVENUES                                            mid single-digit                                Group revenue growth to be mainly driven by
                                                            increase (%)                                            non-advertising business
                                                                                                                                                                  Weaker
                                                                                                                                                                advertising
                                                                                                         About flat development, provided TV advertising       market could
   ENTERTAINMENT                                                                                        market/revenues come in stable to slightly declining    meaningfully
                                                                                                                                                               impact Group
                                                         about in line with                                                                                    revenues and
                                                                                                         Continuation of positive development driven by          earnings
   RED ARROW   STUDIOS1)                                 mid-term revenue                                       production business and Studio71
                                                          growth targets
                                                                                                            Dynamic revenue increase due to organic            Every 1%pt TV
   NUCOM GROUP2)                                                                                                   growth and consolidation                     advertising
                                                                                                                                                               market decline
                                                                                                                                                                 to reduce
                                                                                                           Margin decline largely as a result of indicated          Group
 ADJUSTED EBITDA MARGIN                                           22-25%                                         investments in Entertainment                  revenues and
                                                                                                                                                               adj. EBITDA by
                                                                                                                                                                 ~EUR 20m
                                                                                                           Decline reflects lower adj. EBITDA and result
 ADJUSTED NET INCOME                                      below prior year                                            from 7TV joint venture

                1) Refers to segment Content Production & Global Sales; 2) Refers to segment Commerce                                                                          35
MARCH 7, 2019

 FY 2018
APPENDIX
GROUP P&L
[in EUR m]                                                        Q4 2018                        Q4 2017                                     Δ   FY 2018   FY 2017     Δ

Revenues                                                                1,323                         1,324                             0%        4,009     4,078     -2%

Adjusted EBITDA                                                           379                            390                           -3%         1,013     1,050    -4%

  Reconciling items                                                       -358                              -8                               ~      -443       34       ~

EBITDA                                                                      20                          382                          -95%           570      1,084   -47%
  Depreciation, amortization and
                                                                            -65                           -49                        +33%           -222      -263   -16%
  impairments
      Thereof PPA                                                            -14                            -12                      +22%            -50       -84   -40%

Operating result (EBIT)                                                    -44                           333                                 ~      348       820    -58%

  Financial result                                                           -19                          -95                         -81%            -4      -174   -98%

      Thereof interest result                                                 -8                            -17                       -51%           -63       -83   -24%

Result before income taxes (EBT)                                           -63                          238                                  ~      344       646    -47%

Net result1)                                                                -31                           167                                ~      248        471   -47%

Adjusted net income2)                                                     236                             219                         +8%            541      550     -2%

Net financial debt                                                      2,163                         1,632                         +33%           2,163     1,632   +33%

                          1) Attributable to shareholders of P7S1; 2) Fraction of adjusted net result attributable to shareholders of P7S1                                 38
FINANCIAL POLICY FRAMEWORK ALIGNED WITH INVESTMENT
REQUIREMENTS AND TO DRIVE EPS GROWTH
                   FRAMEWORK UNTIL              FRAMEWORK FOR FY 2018
                   FY 2017                      AND BEYOND

                   pay-out ratio of 80-90%      pay-out ratio of 50%
 Dividend          of adjusted net income       of adjusted net income

 New investments   limited residual amount of   meaningful share of FCF,
 (organic, M&A)    FCF, limited EPS growth      investments to drive EPS growth
                                                                                   TSR
                                                share buybacks benchmarked
 Share Buyback     n/a
                                                against investment opportunities

                   1.5 – 2.5x net financial     1.5 – 2.5x net financial
 Leverage ratio    debt/adjusted EBITDA         debt/adjusted EBITDA

                                                                                         39
OVERVIEW OPERATIONAL KPIS
Entertainment                                                                                                  Content Production & Global Sales                                                                     Commerce
                                                             FY                FY                                                                                         FY               FY                                                                                   FY               FY
                                                                                                YoY                                                                                                        YoY                                                                                                   YoY
                                                            2018              2017                                                                                       2018             2017                                                                                 2018             2017
                                                          1,078bn 1,083bn                                      RAS                                                                                                   Consumer Advice
Total video viewtime1)                                                                          -0%                                                                        215             242             -11%                                                                 3.5m            3.4m            +2%
                                                             min     min                                       # of productions1)                                                                                    # of transactions1)
Total daily TV consumption                                    234              238                             RAS                                                                                                   Matchmaking2)
                                                                                                 -2%                                                                       1.0k            1.2k            -12%                                                                 2.6m            1.9m           +38%
(AGF)2)                                                       min              min                             # of hours produced1)                                                                                 # of registrations
                                                                                              +0.8%            RAS                                                                                                   Experience & Gift Vouchers3)
Audience share3)                                           27.8% 27.0%                                                                                                     105             109             -4%                                    1.3m                                          0.9m           +49%
                                                                                               pts             # of returning shows1)                                                                                # of vouchers
Gross TV advertising                                                                             +1%           RAS                                                                                                   Beauty & Lifestyle
                                                             49%              48%                                                                                         4.4k            4.0k            +10%                                                                  3.0m            2.4m           +28%
market share4)                                                                                   pts           Titles in catalogue                                                                                   # of transactions4)
TV core advertising                                                                              +1%           Studio71
                                                             94%               93%                                                                                         1.4k            1.3k            +5%
revenue share5)                                                                                  pts           # of web channels2)
Digital & smart advertising                                                                      -1%           Studio71
                                                              6%                7%                                                                                       9.0bn           7.4bn            +22%
revenue share6)                                                                                  pts           monthly video views2)
                                                                                                               Studio71
HD subscribers                                               9.5m             8.8m              +8%                                                                      1.2bn           0.8bn           +45%
                                                                                                               # of YouTube subscribers2)
RAS grid share                                                                                   -1%           Studio71
                                                              16%              17%                                                                                       38bn             30bn           +30%
(local commissioned)7)                                                                           pts           monthly minutes watched2)
1) Viewtime for linear P7S1 channels and digital platforms (TV websites, mobile apps, SmartTV, red             1) Current shows in production with revenues EUR >50k (including pilots, commercials, without         1) Includes number of Verivox orders and of SilverTours bookings; 2) Consolidation of eHarmony as of
button (HbbTV), 7TV) excl. Studio71; 2) Target group: 14+; 3) P7S1 free to air audience share (A 14-49); 4)    development deals, multiple seasons counted as separate productions, without digital productions of   November 2018; 3) Consolidation of Jochen Schweizer Group as of October 2017; 4) Includes Flaconi and
Gross TV advertising in % of total advertising market spendings (w/o e.g. YouTube, Facebook,                   RedSeven); 2) Excluding unconsolidated subsidiary in France                                           Amorelie B2C only
Instagram, Search); Source: Nielsen 5) TV core advertising revenues in % of total advertising revenues;
6) Digital & smart revenues (e.g. APS advertising, Addressable TV, digital platforms) in % of total
advertising revenues; 7) Primetime hours of Red Arrow Studios’ local content in % of primetime hours of
all aired local content; core channels only (SAT.1, ProSieben, kabel eins); limited comparability of FY 2017
figure due to change of calculation method (switch from program spend to hours aired)

                                                                                                                                                                                                                                                                                                                      40
CONSUMER ADVICE: LEADING ONLINE PRICE COMPARISON PORTALS
AND MARKET PLACE TO SAVE CONSUMERS’ MONEY

 CONSUMER ADVICE                                                    CONSUMER NEED                             BUSINESS MODEL

                                                                                                              Subscription
Online price comparison portal for energy,
  telco, insurance and financial services
                                                                                                              Cost per order / lead
                                                                             SAVINGS
                                                                                                              Cost per click
        Online price comparison                                                     EUR
           portal rental cars

                                                                             >48             BN
                                                                   Money wasted by German households
                                                                                                              E-Commerce

   Digital marketplace for high-value                              on too expensive contracts every year 1)   Consumer products
        around-home purchases

                        1) Verivox Geldverschwendungsreport 2018                                                                      41
MATCHMAKING: MARKET LEADER IN ONLINE MATCHMAKING IN GSA
WITH STRONG INT’L PRESENCE AFTER EHARMONY ACQUISITION

   MATCHMAKING                                        CONSUMER NEED                  BUSINESS MODEL

                                                                                     Subscription

  Leading online matchmaking portal                                                  Cost per order / lead
 in Germany, Austria and Switzerland                           LOVE
                                                                                     Cost per click

                                1)
  Online matchmaking portal in the
                                                            >25            M
                                                       Singles in Germany, Austria
                                                                                     E-Commerce

   US, UK, Canada and Australia
                                                             and Switzerland         Consumer products

                     1) Part of Parship Elite Group                                                          42
EXPERIENCE & GIFT VOUCHERS: COMBINING THE LEADING MARKET
PLACES FOR EXPERIENCES AND GIFT VOUCHERS IN GSA

   EXPERIENCE &
                                                                 CONSUMER NEED                    BUSINESS MODEL
  GIFT VOUCHERS1)

                                                                                                  Subscription

    Expert market place for leisure                                                               Cost per order / lead
  experiences and short trips in GSA                                  EXPERIENCES
                                                                                                  Cost per click
                                                                                   EUR

  Leading German market place for
                                                                              >29          BN
                                                                              Spend on gifts in
                                                                                                  E-Commerce

    gift and experience vouchers
                                                                             Germany every year   Consumer products

                      1) Both brands part of Jochen Schweizer mydays Group                                                43
BEAUTY & LIFESTYLE: LEADING ONLINE AND OMNICHANNEL
PLAYERS IN THE BEAUTY & LIFESTYLE SEGMENT

        BEAUTY &
                                                  CONSUMER NEED                      BUSINESS MODEL
        LIFESTYLE

                                                                                     Subscription
    Leading online beauty pure play
    e-commerce player in Germany

                                                                                     Cost per order / lead
    One of the leading e-commerce                      WELL-BEING
  players for sensual products in GSA
                                                                                     Cost per click
                                                       EUR                EUR

                                                  >17                 >4
   One of the leading players in the
 healthcare market outside pharmacies                                                E-Commerce
                                                             BN                 BN
                                                  Beauty & Care       OTC market
       Meta-search engines for                  market in Germany1)   in Germany1)   Consumer products
        fashion and furniture

                       1) Source: Euromonitor                                                                44
This presentation contains "forward-looking statements" regarding
             ProSiebenSat.1 Media SE ("ProSiebenSat.1") or ProSiebenSat.1 Group,
             including    opinions,   estimates     and    projections    regarding
             ProSiebenSat.1's or ProSiebenSat.1 Group's financial position, business
             strategy, plans and objectives of management and future operations.
             Such forward-looking statements involve known and unknown risks,
             uncertainties and other important factors that could cause the actual
             results, performance or achievements of ProSiebenSat.1 or
             ProSiebenSat.1 Group to be materially different from future results,

DISCLAIMER
             performance or achievements expressed or implied by such forward-
             looking statements. These forward-looking statements speak only as of
             the date of this presentation and are based on numerous assumptions
             which may or may not prove to be correct.

             No representation or warranty, expressed or implied, is made by
             ProSiebenSat.1 with respect to the fairness, completeness, correctness,
             reasonableness or accuracy of any information and opinions contained
             herein. The information in this presentation is subject to change
             without notice, it may be incomplete or condensed, and it may not
             contain all material information concerning ProSiebenSat.1 or
             ProSiebenSat.1 Group. ProSiebenSat.1 undertakes no obligation to
             publicly update or revise any forward-looking statements or other
             information stated herein, whether as a result of new information,
             future events or otherwise.

                                                                                       45
You can also read