Q4 2020 Jon Erik Engeset, CEO David Bandele, CFO 17 February 2021 - GlobeNewswire
←
→
Page content transcription
If your browser does not render page correctly, please read the page content below

Q4 2020 Jon Erik Engeset, CEO David Bandele, CFO 17 February 2021

Disclaimer and important notice
    This company presentation (the “Presentation”) has been prepared by Hexagon Composites ASA (“Hexagon” or the “Company”).
    The Presentation has not been reviewed or registered with, or approved by, any public authority, stock exchange or regulated market place. The Company
    makes no representation or warranty (whether express or implied) as to the correctness or completeness of the information contained herein, and neither
    the Company nor any of its subsidiaries, directors, employees or advisors assume any liability connected to the Presentation and/or the statements set out
    herein. This presentation is not and does not purport to be complete in any way. The information included in this Presentation may contain certain forward-
    looking statements relating to the business, financial performance and results of the Company and/or the industry in which it operates. Forward-looking
    statements concern future circumstances and results and other statements that are not historical facts, sometimes identified by the words “believes”,
    expects”, “predicts”, “intends”, “projects”, “plans”, “estimates”, “aims”, “foresees”, “anticipates”, “targets”, and similar expressions. The forward-looking
    statements contained in this Presentation, including assumptions, opinions and views of the Company or cited from third party sources are solely opinions
    and forecasts which are subject to risks, uncertainties and other factors that may cause actual events to differ materially from any anticipated development.
    None of the Company or its advisors or any of their parent or subsidiary undertakings or any such person’s affiliates, officers or employees provides any
    assurance that the assumptions underlying such forward-looking statements are free from errors nor does any of them accept any responsibility for the
    future accuracy of the opinions expressed in this Presentation or the actual occurrence of the forecasted developments. The Company and its advisors
    assume no obligation to update any forward-looking statements or to conform these forward-looking statements to the Company’s actual results. Investors
    are advised, however, to inform themselves about any further public disclosures made by the Company, such as filings made with the Oslo Stock Exchange
    or press releases. This Presentation has been prepared for information purposes only. This Presentation does not constitute any solicitation for any offer to
    purchase or subscribe any securities and is not an offer or invitation to sell or issue securities for sale in any jurisdiction, including the United States.
    Distribution of the Presentation in or into any jurisdiction where such distribution may be unlawful, is prohibited. This Presentation speaks as of 17 February
    2021, and there may have been changes in matters which affect the Company subsequent to the date of this Presentation. Neither the issue nor delivery of
    this Presentation shall under any circumstance create any implication that the information contained herein is correct as of any time subsequent to the date
    hereof or that the affairs of the Company have not since changed, and the Company does not intend, and does not assume any obligation, to update or
    correct any information included in this Presentation. This Presentation is subject to Norwegian law, and any dispute arising in respect of this Presentation is
    subject to the exclusive jurisdiction of Norwegian courts with Oslo City Court as exclusive venue. By receiving this Presentation, you accept to be bound by
    the terms above.

2
Agenda
    •   Q4 highlights and key developments

    •   Key market developments

    •   Summary Group highlights and financials

    •   Outlook

    •   Q&A                                             Q4 2020

    •   Appendix: Segment financials & other material

3
Key developments in the quarter

    •   All time high EBITDA performance in Agility

    •   Leading US brands set ambitious eco-targets by means of Renewable
        Natural Gas (RNG)

    •   Successful listing of Hexagon Purus (HPUR.OL) on the Euronext
        Growth exchange, raised NOK 750 million in new capital
4
    •   Unveiled LPG smart cylinder
Hexagon’s g-mobility solutions had a
    positive CO2 impact in 2020

                              CO2           157,000
                                            Petroleum cars

               726,000*
               Metric tons of GHG avoided   957,000
                                             Acres of forest

5    *estimated 2020 measurement
Q4 2020 – strong quarter driven by Agility

       Revenues              EBITDA                     ex Purus
     NOK 803 million       NOK 69 million        Revenues NOK 770 million
    (NOK 770 million Q3)   (NOK 65 million Q3)    EBITDA NOK 121 million

6
COVID- 19 Impact

    • 100 cases to-date, including one fatality

    • Supply chain disruptions causing challenges

    • All production facilities have remained open
      during the quarter and no COVID-19
      transmissions have taken place on-site

    • Underlying market demand is strong

7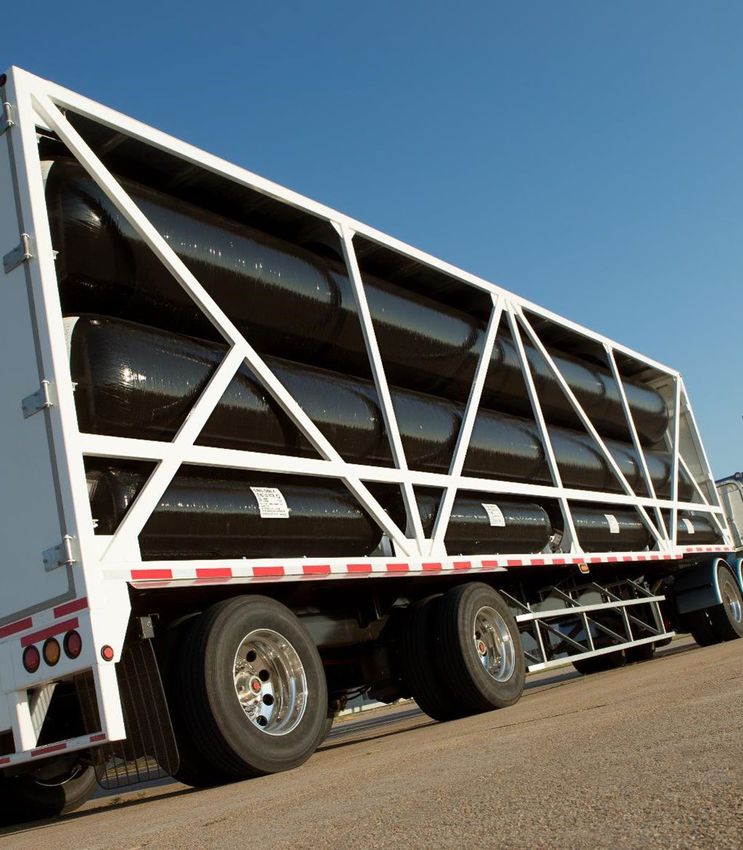
Semiconductor shortage

    • Volkswagen down 100,000 cars in the first quarter of 2021
      - Golf platform including Volkswagen, ŠKODA, SEAT and
        Audi affected

    • Impacting Hexagon CNG-LDV volumes in Q1’2021

         …”We are now feeling the effects of the global
    semiconductor bottleneck. We are doing everything in our
      power to minimize lost production and to ensure that
    normal deliveries to customers can be resumed as rapidly
                           as possible.”

       - Murat Aksel, Group Board of Management Member responsible for
8                        purchasing, Volkswagen Group
Hexagon Group

                                                                                              Hexagon Group

                                 g-mobility
                                                                                                                                                            75%

          Hexagon                                       Hexagon                                         Hexagon                                 Hexagon   Hexagon
           Agility1)                                    CNG LDV                                        Digital Wave                             Ragasco    Purus

                                      ~75%                                                                       ~2%                             ~17%       ~6%

9   Note: data as of LTM Q’4’20 revenue
    1) Hexagon Agility represents the combination of Mobile Pipeline and Agility Fuel Solutions. Combination and name is effective 01.01.2021
    2) Hexagon Digital Wave will be an own business area effective 01.01.2021.
Hexagon Group
     Revenue by geography

                                                                         31%

                                          63%
                                                                Europe         5%

                          North America                                         Asia
                                                     1%

                                                South America

10   % of sales revenue
The US is
Hexagon’s largest
market
Climate climbing the priority list in the
US
• Rejoining the Paris Climate Accord
• Targeting zero emissions by 2050
• Proposing USD 2 trillion climate plan over 4 years
11 Source: The New York Times: “Biden Announces $2 Trillion Climate Plan”RNG (Renewable Natural Gas – biomethane) at the core of the
US response
Metric tons C02 equivalents / year
200
USD per diesel gallon equivalent
150
Diesel RNG
100
170
50
USD 2.65-3.20 USD 1.20-1.85
48
0 2
-50 -83
-100
Diesel Truck Electric truck* RNG Truck **
Converting entire Purchase >6,000 Cutting fleet
Ordered ~1000 natural gas
long-haul fleet to emissions by 45%
CNG/RNG
RNG powered vehicles by 2038
trucks
trucks by 2022 between 2020 –
2022
Note: *Electric uses today’s US electric grid, **RNG includes fuel produced from landfill and dairy sources
12 Source : TruStar EnergyRebound in US oil and gas rig count
(# of rigs)
800 Oil Gas
700
600
500
+60%
400
300
200
100
0
Mar Apr May Jun Jul Aug Sep Oct Nov Dec Jan Feb
20 20 20 20 20 20 20 20 20 20 21 21
13 Source: Oil / Gas split as of 12 Feb, Baker HughesEurope is
Hexagon’s second
largest market
EU Green Deal; EUR 1 trillion by 2030
• 13 million zero- and low-emission vehicles expected on
European roads 2025
• Digital technologies to increase efficiency, make transport
cleaner, and boost circular economy
• From 1 to 40 gigawatt of green hydrogen by 2030
14 Source: European CommissionEU Policy quantifying 50% Clean Target by 2025
H2 BEV RNG CNG
15.75% Zero-Emissions 6.75%
22.5% “Clean” 22.5%
45% Low-Emissions 55%
15From waste to
renewable LPG
The European LPG industry addressing
CO2 reductions
• EU targeting 32% renewables in the energy mix by
2030
• Bio-LPG reduces CO2 emissions by up to 80% versus
conventional LPG
• Primary raw material is organic waste
16Establishing
footprint in Asia
Gravity point shifting towards Asia
• China pledging carbon neutral by 2060
• Expected to be the largest market for fuel cell
electric vehicles
• South Korea targeting carbon neutrality by 2050
• Southeast Asia to achieve 23% renewable energy in total
primary energy supply in 2025.
• Hexagon will take leading positions with strong
partners in the region
17Financial update
2021 Reporting Structure
18Current reporting structure as at Q4 2020
Hexagon Composites ASA
100% 75%
Agility Fuel Hexagon Mobile Hexagon Hexagon
Solutions Pipeline and Other Ragasco LPG Purus
Carve out1
Hexagon Hexagon Digital Hexagon Hexagon
Hydrogen & BEV
Mobile Pipeline Wave CNG LDV Masterworks
1) Carve out from Hexagon Purus upon spin-off and effective 01.01.2021
19Reporting structure from 1 January 2021
Hexagon Composites ASA /
Group
100% 75%
g-mobility
Hexagon Hexagon Hexagon Hexagon Hexagon
Agility CNG LDV Digital Wave Ragasco Purus
Agility Fuel
Mobile Pipeline
Solutions
20 Note: data as of LTM Q’4’20 revenue
1) Hexagon Agility represents the combination of Mobile Pipeline and Agility Fuel Solutions. Combination and name is effective 01.01.2021
2) Hexagon Digital Wave will be an own business area effective 01.01.2021.Summary of reporting changes for Hexagon Group (HEX.OL)
From 2021 onwards
• Hexagon Purus (HPUR.OL) quarterly earnings report and presentation published prior to
Hexagon Group (HEX.OL)
• Hexagon Group presentation will focus primarily on the collective of “Hexagon” or
“Hexagon proforma” segments, i.e.:
• g-mobility
• Digital Wave
• Ragasco
• Hexagon Group financials will include Hexagon Purus as 100% consolidated and include a
Minority Interest related to the non-controlled interest in Hexagon Purus (25%)
• Hexagon Proforma numbers for 2020 will be issued in line with Q1 2021 reporting
21Q4 2020 Financials 22
Group highlights from Q4 2020
     •   Record EBITDA in Agility
          •   Further deliveries to major logistics customers
          •   Very strong Medium & Heavy-Duty CNG Truck sales

     •   Mobile Pipeline still impacted by COVID-19
          •   Strong sales in seasonal virtual interconnect projects

     •   Modest CNG Light-Duty Vehicle volumes
          •   Slower ramp-up after production relocation of major customer
          •   Good profitability after receipt of annual volume rebate

     •   Seasonal LPG performance
          •   Good European sales volumes
          •   Smaller volumes to wide spread of markets

     •   Successful Hexagon Purus spin-off
          •   Very high interest in private placement attracting NOK 750m in additional capital
          •   Hexagon Group retains 75% ownership

23
Financial highlights Q4 2020
Hexagon Composites Group
Revenue EBITDA Profit after tax
NOKm NOKm NOKm
-29
-139 (-30%) -102
(-15%) 98 (-927%)
942 (10%) 11
803 69
(9%)
-91
Q4’19 Q4’20 Q4’19 Q4’20 Q4’19 Q4’20
• Strong Agility revenues • Record Agility EBITDA offset by • Y-o-Y effects of interest & charges
lower volumes elsewhere NOK +13m; FX NOK -30m
• Otherwise, volumes lower than
Q4 ’19 but overall higher than • Strategic/transaction related costs • Tax NOK -56m due to provisions
Q3 ‘20 NOK -20m on tax assets (Purus)
24Hexagon (ex Purus) Proforma* | Q4 2020
Hexagon Group Hexagon Purus e-mobility business Hexagon (ex Purus)
NOKm NOKm NOKm
803 33 770
121
69
(16%)
(9%)
-52
Revenue EBITDA Revenue EBITDA
Revenue EBITDA
Quarterly Hexagon Proforma* EBITDA > NOK 100m at 16% margin
25
* Unaudited and preliminary proforma aggregation, where CNG LDV business reported in Hexagon Purus in Q4 is included
25Group Revenue by segment Q4 2020 | Before Group eliminations*
Revenue Q4’19 (Proforma after internal reorganizations**) Revenue Q4’20
NOKm, before group eliminations NOKm, before group eliminations
108
141
106
NOK NOK
144
954* 501 839*
million 83 million
542
168
Agility Fuel Solutions (Heavy and Medium-Duty) Agility Fuel Solutions (Heavy and Medium-Duty)
Hexagon Purus (e-mobility & CNG Light-Duty Vehicles) Hexagon Purus (e-mobility & CNG Light-Duty Vehicles)
Hexagon Mobile Pipeline & Other Hexagon Mobile Pipeline® & Other
Hexagon Ragasco LPG Hexagon Ragasco LPG
26 **Preliminary unaudited pro-forma figures after adjusting for reorganizations of e-mobility business unitsHexagon Group Balance sheet | Q4 2020 vs Q3 2020
Assets Liabilities & Equity
NOKm NOKm
7 000 7 000
6 208 6 208
5 989 5 989
6 000 Hexagon NOK 404m 6 000
886
957 Purus NOK 1 246m 830
1 650 262
5 000 5 000 354 262
653 314 Purus is debt free
625 1 206 All IBD is under Hexagon
4 000 832 4 000
1 479 NIBD Hexagon = 0.8bn
741
3 000 3 000
Equity ratio 58% (50%)
2 000 2 000 Incl. Minority Interest of NOK 411m
3 547 3 592
3 192 3 012
1 000 1 000
0 0
30/09/2020 31/12/2020 30/09/2020 31/12/2020
Other current liabilities Interest bearing debt
Cash Receivables Inventory Fixed assets
X Other long term liabilities Equity
Lease liabilities from right of use assets
Stronger balance sheet after listing and private placement of Hexagon Purus
27
*The bond was issued in NOK and the company entered into a currency swap hedging arrangement converting the instrument to USD and is therefore accounted for as USD and subject to non-
cash FX translation movements; Interest bearing debt is stated excluding NOK 79m of related mark to market positions classified as non-current assets at the end of Q4 and not netted in liabilitiesHexagon proforma leverage | Q4 2020
NOKm • As of Q4 2020, Hexagon has a total NIBD of
1 206 NOK 0.8 bn
1 100 106
404 • Total IBD of 1.2 bn and cash of NOK 0.4 bn
802
• Unsecured Bond NOK 1.1 bn. Maturing March
2023
• Secured Bank facility of NOK 0.6 bn, currently
NOK 0.5 bn undrawn. Maturing September
1 246 1 246 2021
• Hexagon Purus currently debt free and holds
-444 cash of NOK 1.25 bn
Bond Bank loan Total IBD Hexagon Purus cash NIBD Group Adj. for Proforma • NOK 0.75 bn private placement and capital
cash Purus Cash Hexagon injection from Hexagon Composites ASA
NIBD
NIBD/EBITDA 3,1x • Ring-fenced Hexagon Purus from financial
2,5x covenants in loan Agreements
1,6x
1,2x
0,6x
2016 2017 2018 2019 Q4 2020 proforma
Hexagon
28Preliminary and unaudited
Full Year 2020
Financials
29
29Financial highlights Preliminary and Unaudited Full Year 2020
Hexagon Composites Group
Revenue EBITDA Profit after tax
NOKm NOKm NOKm
-170
-336 (-47%) -260
(-10%) 360 (-243%)
3 416 (11%) 107
3 080
190
(6%)
-153
2019 2020 2019 2020 2019 2020
• COVID-19 impacts felt especially in • Y-o-Y EBITDA impact on CNG LDV (- • Y-o-Y effects of tax NOK -96m due
Mobile pipeline and US transit bus 90m) & Mobile Pipeline (-70m) mainly to provisions on tax assets
• Major customer assembly facility • Strategic/transaction related costs (Purus)
relocation in CNG LDV NOK -29m • All other below the line effects are
• Otherwise robust performance • Total e-mobility ramp-up effect NOK net NOK +6m
driven by Agility and LPG (Ragasco) -132m (-108m)
30Hexagon (ex Purus) Proforma* | Full Year 2020
Hexagon Group Hexagon Purus e-mobility business Hexagon (ex Purus)
NOKm NOKm
NOKm
3 080 2 899
181
3 080
190 322
(6%) (11%)
190
Revenue EBITDA Revenue EBITDA
-132
Revenue EBITDA
Hexagon YTD Q4 2020 Proforma EBITDA of NOK 322m at 11% margin
* Unaudited and preliminary proforma aggregation, where CNG LDV business reported in Hexagon Purus is included, post eliminations
31Group Revenue by segment Full Year 2020 | Before Group eliminations*
Revenue 2019 (Proforma after internal reorganizations**) Revenue 2020
NOKm, before group eliminations NOKm, before group eliminations
600 550
NOK NOK
3,486* 3,187*
349
533 1 806
million million 1 950
338
547
Agility Fuel Solutions (Heavy and Medium-Duty) Agility Fuel Solutions (Heavy and Medium-Duty)
1
Hexagon Purus (e-mobility & CNG Light-Duty Vehicles) Hexagon Purus (e-mobility & CNG Light-Duty Vehicles)
Hexagon Mobile Pipeline & Other Hexagon Mobile Pipeline® & Other
Hexagon Ragasco LPG Hexagon Ragasco LPG
32 **Preliminary unaudited pro-forma figures after adjusting for reorganizations of e-mobility business unitsHexagon Group 2020* Financial Scorecard
Navigated COVID-19 & well positioned for profitable
growth in 2021
• Double-digit EBITDA margin for Hexagon ex-Purus
• EBITDA ramp up impact of NOK -132 million related to Hydrogen business
units
• NOK 272 million EBITDA in Agility Fuel Solutions
• Cash of NOK 1.6bn and additional undrawn liquidity of NOK
0.5bn
• Hexagon cash NOK 0.4bn and undrawn liquidity of NOK 0.5 bn
• Purus cash NOK 1.2bn
• 58% Equity Ratio
• Spun off Hexagon Purus with current valuation of NOK
~14bn**, retaining 75% ownership
33 *2020 = Preliminary and unaudited ** as of 15th February 2021Outlook &
2021 Full year guidance
34Hexagon Agility
Medium & Heavy-
Duty Vehicles
Green focus driving g-mobility demand
• Strong orderbook for 2021 to deliver growth targets
• Modest first quarter after record H2 2020
• Sustainability targets drive fleet demand for Heavy-Duty
Truck business
• Continued deliveries to major logistics suppliers
• Improved adoption among small fleet owners
• Positive demand for European bus
• COVID-19 continues to be disruptive and planned
OEM shutdowns may delay some orders
• Refuse segment expected to pick up in 2021
35Hexagon Agility
Mobile Pipeline
Diversifying the customer portfolio
• Expect pick up in mobile refueling, flare gas capture, and
energy intensive applications in 2021
• Customer synergies with Agility’s automotive business
• Awarded USD 5.7 million (NOK 48.5 million) industrial gas
company order (delivery in Q2’2021)
• Positive outlook for oil & gas segment
• Increasing rig count
• ESG drives conversion to CNG and RNG
36Hexagon
CNG-LDV
CNG Light-Duty Vehicles
• Semiconductor shortage affecting our volumes in Q1
• Call-offs expected to resume in Q2
37Hexagon
Digital Wave
Building our IoT opportunity and
improving the circular economy
• Profitable existing product offerings
• Developing a new business model in 2021 incorporating
• IoT of tank systems & real-time health monitoring
• Life extension & improving circular economy of our
industry
• Service & leasing models
• Some Opex investment to realize opportunities
38Hexagon
Ragasco
Strong demand for LPG leisure use
• Expect seasonally strong first half of 2021
• Supported by continued strong leisure market in
Europe
• Onboarding of smart tank pilot programs with key
European customers through 2021
39Hexagon (ex Purus) 2021 targets*
Substantial and profitable growth
Revenue target 2021 EBITDA target 2021 EBITDA margin target 2021
>15% >30% ~12%
11-12%
9-10%
~3.5 bn ~400 m
2020E Target 2021E 2020E Target 2021E 2020E Target 2021E
40
40 * Excluding Hexagon Purus and subject to no material unforeseen impacts from global pandemic; as guided in CMD January 11th 2021Hexagon (ex Purus) 2021 Guidance | as at Q4 2020
Hexagon (ex Purus): Q1 relatively weak while Q2 – Q4 expected to be strong
CURRENT 2021 EXPECTED
OPPORTUNITIES RISKS
PERFORMANCE TO TARGET
• Continued sustainability • Productivity improvements • Prolonged Covid-19 recovery
AGILITY (INCL MP) driven adoption
• Semi-conductor • Indonesia and India • Prolonged shortage of
CNG LDV shortage will impact Q1 electronic components
HEXAGON
• Business as usual • Orders in newer geographies • Orders in newer geographies
RAGASCO
• Investing in opex to
DIGITAL WAVE extend existing
profitable business
41Hexagon Purus
Strong and growing pipeline of hydrogen
activities
• Focus on operational execution of well-diversified order
backlog, including:
• Hydrogen distribution, transit bus, rail and aerospace
business
• Highly active and dynamic pipeline for new business across
Purus’ application and product footprint
42Several recent contract announcements
Leading global
industrial gas
company
Selected by Hino Awarded contract Multi-year frame
Trucks as for supply agreement with
development hydrogen cylinder worth €14m to
partner to provide systems for first deliver multiple
battery packs and hydrogen powered units of hydrogen
drivetrain commuter train in distribution
integration on Selected to supply systems through to Substantial order
the US Selected to deliver
multiple Hino high-pressure 2025 from leading global
high pressure gas company to
platforms hydrogen tanks for
hydrogen cylinders provide type 4
New Flyers Xcelsior
for the first zero- hydrogen cylinders
CHARGE H2™
emission hydrogen for transportation of
hydrogen fuel cell
train in Spain hydrogen to
electric transit
buses industrial customers
43Appendix
Segment financial highlights Q4 2020 | (1/3)

       Agility Fuel Solutions*                                                                                                               Hexagon Purus* (e-mobility, incl. MW & CNG LDV)
       NOKm                                                                                                                                  NOKm

                         Revenue                                                     EBITDA                                                                  Revenue                                      EBITDA

                             +41                                                         +46                                                                                                                 -35
                            (+8%)                                                      (+66%)                                                                   -85                                       (-408%)
                                        542                                                         116                                                       (-50%)
                   501                                                                             (21%)                                              168
                                                                               70                                                                                                                   -9
                                                                             (14%)                                                                                                                (-5%)
                                                                                                                                                                        83

                                                                                                                                                                                                                      -43
                                                                                                                                                                                                                    (-52%)
                 Q4’19                 Q4’20                                 Q4’19                Q4’20                                              Q4’19             Q4’20                      Q4’19             Q4’20

         • Record quarter for EBITDA driven by volume and product mix
                                                                                                                                                 • VW Group relocation of CNG vehicle assembly line completed
         • Volumes driven by Medium and Heavy-Duty Truck and European                                                                              however ramp-up not yet in full
           Transit bus as tough EU clean air directives in cities requiring
                                                                                                                                                 • Please see separate CNG and e-mobility figures and comments on
           compliance within 2025, driving increasing CNG/RNG adoption in
                                                                                                                                                   next slide
           European cities

46
     * 2019: preliminary unaudited pro-forma figures after adjusting for reorganizations of e-mobility business units; 2020 segment reported been included in Agility segment reporting in 2020
     *2019:   preliminary unaudited pro-forma figures after adjusting for reorganizations of e-mobility business units; 2020: segment reported
Segment financial highlights Q4 2020 | (2/3)
Hexagon Purus CNG-LDV* Hexagon Purus e-mobility*
NOKm NOKm
Revenues Revenues
EBITDA EBITDA
71
57 54
51
97 43
87 33
51
32 38 37
-21 -16 -28
22 -29 -35
14 0 9 -52
-13 -13
1 1 1
Q3’19 Q4’19 Q1’20 Q2’20 Q3’20 Q4’20 Q3’19 Q4’19 Q1’20 Q2’20 Q3’20 Q4’20
• 2020 revenues for CNG LDV was adversely impacted by lower calls-
off from VW Group due to relocation of its CNG vehicle assembly
line, in addition to effects from COVID-19
• Continued Opex investment ahead of revenues driving negative
• Production at VW’s relocated facilities restarted towards the mid to results
end of Q3’20; call-offs recommenced
• Volume based price rebate received in Q4 (NOK 9m)
47 * 2019: preliminary unaudited pro-forma figures after adjusting for reorganizations of e-mobility business units; 2020 segment reported including a restatement of Q1-Q3 for amounts reported in AgilitySegment financial highlights Q4 2020 | (3/3)
Hexagon Mobile Pipeline & Other* Hexagon Ragasco (LPG)
NOKm NOKm
Revenue EBITDA Revenue EBITDA
-12
-38 -13 -33
(-26%) (-56%)
(N/A) (-23%) 22
144 6 141 (16%)
(4%) 108
106
10
(9%)
-7
(-7%)
Q4’19 Q4’20
Q4’19 Q4’20 Q4’19 Q4’20 Q4’19 Q4’20
• Macro impacts from COVID-19 led to some delays in customer
• Seasonally typical volume
taking delivery of new modules in Q4’20
• Shortfall versus Q4 2019 due to no sales to Bangladesh during
• Strong deliveries to virtual-interconnect opportunities in North
this period
America and Indonesia
48 * 2019: preliminary unaudited pro-forma figures after adjusting for reorganizations of e-mobility business units; 2020 segment reported been included in Agility segment reporting in 2020
*2019: preliminary unaudited pro-forma figures after adjusting for reorganizations of e-mobility business units; 2020: segment reportedGroup cash Q4 2020*
NOKm
+693.0
1,800
1,650
-14
1,600
1,400
723
1,200 -62 -9
190 -27 -18
1,000 957 76 -166
800
600
400
200
0
Start of Q4’20 Underlying Operating From Capex Product Interest and Debt Private FX translations End of Q4’20
Ops working Operations Development charges paid repayment Placement on cash
capital excluding in Hex Purus
changes OPWC
Strong net cashflow from Operations given wind-out of OPWC; Debt repayments made with excess cash;
Hexagon Purus private placement net receipts at end of quarter
* Preliminary unaudited pro-forma figures which may be subject to reclassification changes upon final year-end audit; Full and final FX translations pending have been included in Agility segment reporting in 2020
49Consolidated financial statements | P&L
Hexagon Composites ASA
Income Statement (NOK 1 000) Q4 2020 Q4 2019 31.12.2020 31.12.2019
Revenue from contracts with customers 802 560 938 695 3 070 865 3 404 209
Other operating income 242 3 229 9 511 11 915
Total revenue 802 802 941 923 3 080 375 3 416 124
Cost of materials 270 015 460 402 1 500 976 1 673 120
Payroll and social security expenses 244 418 243 771 941 425 853 706
Other operating expenses 219 283 139 625 448 348 599 209
Gain / Fair value adjustment earn-out -69 625
Total operating expenses before depreciation 733 716 843 798 2 890 750 3 056 409
Operating profit before depreciation (EBITDA) 69 086 98 126 189 626 359 715
Depreciation and impairment 62 071 62 618 248 340 239 606
Operating profit (EBIT) 7 015 35 508 -58 714 120 109
Profit/loss from investments in associates and joint ventures -1 107 90 -1 885 -749
Net financial items -47 810 -31 292 7 757 -8 114
Profit/loss before tax -41 902 4 306 -52 841 111 246
Tax 49 332 -6 539 99 740 3 755
Profit/loss after tax -91 234 10 846 -152 582 107 491
50Consolidated financial statements | Balance sheet & cash flow
Hexagon Composites ASA
BALANCE SHEET (NOK 1 000) 31.12.2020 31.12.2019 CONDENSED CASH FLOW (NOK 1 000) 31.12.2020
ASSETS
Profit before tax from continuing operations -52 841
Property, plant and equipment 747 266 804 099
Right-of-use assets 257 337 283 817 Depreciation and write-downs 248 340
Intangible assets 2 105 569 2 204 253 -18 739
Change in net working capital and other
Investment in associates and joint ventures 2 142 651
Non-current current assets 79 848 48 992 Net cash flow from operations 176 759
Total non-current assets 3 192 161 3 341 811 Net cash flow from investment activities -138 868
Inventories 740 639 783 669
Trade receivables 624 978 520 426 Net cash flow from financing activities 1 434 228
Contract assets (incl. prepayments) 814 3 962 Net change in cash and cash equivalents 1 472 119
Cash and short-term deposits 1 649 882 177 651
Total current assets continuing operation 3 016 313 1 485 708 Net currency exchange differences 112
Total assets 6 208 474 4 827 519 Discontinued operations 177 651
EQUITY AND LIABILITIES Cash and cash equivalents at start of period 0
Paid-in capital 2 165 590 1 270 018 Cash and cash equivalents at end of period 1 649 882
Other equity 1 014 975 882 975
Equity attributable to equity holders of the parent 3 180 565 2 152 993
Non controlling interests 411 221 0
Total equity 3 591 786 2 152 993
Interest-bearing long-term liabilities 1 206 127 1 298 058
Lease liabilities 237 266 246 929
Other non-current liabilities 261 999 285 512
Total non-current liabilities 1 705 392 1 830 499
Interest-bearing current liabilities 0 2 857
Lease liabilities short-term 25 198 47 703
Contract liabilities (incl. prepayments from customers) 53 371 94 540
Other current liabilities 832 726 698 927
Total current liabilities 911 296 844 027
Total liabilities 2 616 688 2 674 526
Total equity and liabilities 6 208 474 4 827 519
51Financial statements | P&L
Hexagon Purus e-mobility (excl. CNG LDV)
Income Statement (NOK 1 000) Q4 2020 Q4 2019 31.12.2020 31.12.2019
Revenue from contracts with customers 32 455 69 072 178 121 207 154
Other operating income 293 3 529 1 693 4 140
Total revenue 32 749 72 601 179 814 211 294
Cost of materials 10 340 45 589 86 717 128 232
Payroll and social security expenses 40 719 42 354 123 497 143 157
Other operating expenses 34 093 22 724 110 322 83 167
Total operating expenses before depreciation 85 153 110 668 320 536 354 556
Operating profit before depreciation (EBITDA) - 52 404 - 38 067 - 140 722 -143 261
Depreciation and impairment 7 247 5 286 26 906 25 508
Operating profit (EBIT) - 59 652 - 43 353 - 167 628 -168 769
Profit/loss from investments in associates and joint - 1 107 90 - 1 885 -749
ventures
Finance income 1 207 - 10 110 3 243
Finance costs - 66 230 - 8 596 - 113 969 -27 397
Profit/loss before tax - 125 782 - 51 859 - 273 373 -193 672
Tax - 20 253 - 11 316 35 579 -25 777
Profit/loss after tax before discontinued operations - 146 035 - 40 544 - 308 952 -167 895
Profit/loss after tax for the period from discontinued 11 537 17 479 - 34 602 69 279
operations
Profit/loss after tax - 134 498 - 23 065 - 343 554 -98 616
52Financial statements | Balance sheet & cash flow
Hexagon Purus e-mobility (excl. CNG LDV)
BALANCE SHEET (NOK 1 000) 31.12.2020 31.12.2019 CONDENSED CASH FLOW (NOK 1 000) 31.12.2020
ASSETS
Profit before tax from continuing operations - 273 373
Property, plant and equipment 76 634 103 359
Right-of-use assets 30 457 53 577 Depreciation and write-downs 26 906
Intangible assets 413 324 475 378 Change in net working capital and other 123 643
Investment in associates and joint ventures 2 066 651
Non-current financial assets 751 3 226 Net cash flow from operations -122 823
Deferred tax assets - 41 213 Net cash flow from investment activities -36 288
Total non-current assets 523 232 677 404
Net cash flow from financing activities 1 387 081
Inventories 61 586 100 678
Trade receivables 26 657 125 015 Net change in cash and cash equivalents 1 227 969
Contract assets (incl. prepayments) 814 3 100
Net currency exchange differences -5 395
Other current financial assets 12 842 5 941
Cash and short-term deposits 1 246 351 65 093 Discontinued operations -41 316
Total current assets continuing operation 1 348 251 299 827 Cash and cash equivalents at start of period 65 093
Assets held for sale 219 771 -
Total assets 2 091 254 977 231 Cash and cash equivalents at end of period 1 246 351
EQUITY AND LIABILITIES
Issued capital 22 909 330
Other paid-in capital 372 -
Share premium 2 055 282 14 443
Other equity - 452 223 -119 590
Total equity 1 626 341 -104 816
Interest-bearing loans and borrowings, related party 161 016 729 428
Lease liabilities 21 795 47 828
Provisions 689 1 613
Net employee defined benefit liabilities 2 635 2 076
Deferred tax liabilities 11 930 22 325
Total non-current liabilities 198 065 803 269
Trade and other payables 83 988 139 207
Contract liabilities 32 068 33 276
Lease liabilities, short term 9 244 12 810
Income tax payable - 20
Other current liabilities 64 390 93 465
Total current liabilities continuing operation 189 690 278 778
Liabilities directly associated with the assets held for sale 77 158 - Note: Balance sheet as of 31 December 2020 is that of Purus’ e-mobility
business with the CNG LDV business treated as a discontined operation;
Total liabilities 464 913 1 082 047 balance sheet as of 31 December 2019 inlcudes the CNG LDV business
53 Total equity and liabilities 2 091 254 977 231Investor relations information
EXCHANGE MARKET CAP INVESTOR BASE
• TICKER SYMBOL: HEX
• ISIN: NO0003067902 NOK ~13bn ~5,300
• EXCHANGE: OSLO BØRS MARKET CAPITALIZATION1 SHAREHOLDERS
> 50%
International
ownership
2021 FINANCIAL CALENDAR EQUITY ANALYST COVERAGE INVESTOR RELATIONS CONTACTS
2021 2022
CARNEGIE HIVA GHIRI
Annual 25-mar
report 2020 • MIKKEL NYHOLT-SMEDSENG VICE PRESIDENT, INVESTOR RELATIONS
E-MAIL: HIVA.GHIRI@HEXAGONGROUP.COM
AGM 28-apr SEB DIRECT: +47 958 667 90
• ANDERS ROSENLUND
Q1 2021 12-may
• HERMAN LIA DAVID BANDELE
Q2 2021 12-aug CHIEF FINANCIAL OFFICER
SPAREBANK 1 MARKETS
E-MAIL:
Q3 2021 04-nov • JONAS MEYER
DAVID.BANDELE@HEXAGONGROUP.COM
Q4 2021 17-feb DIRECT: +47 920 914 83
54
1 As of 16 February 2021You can also read