SFG Investor Presentation - 03-04.09.2020 | Wood & Co Frontier Investor Days - Sphera Franchise Group
←
→
Page content transcription
If your browser does not render page correctly, please read the page content below
SFG Investor Presentation
03-04.09.2020 | Wood & Co Frontier Investor Days

                                                   1
Disclaimer

    This presentation is not, and nothing in it should be construed as, an offer, invitation or recommendation in respect of shares issued by Sphera
    Franchise Group SA ("Sphera"), or an offer, invitation or recommendation to sell, or a solicitation of an offer to buy shares in Sphera.

    Neither this presentation nor anything in it shall form the basis of any contract or commitment. This presentation is not intended to be relied upon as
    advice or recommendation to investors or potential investors and does not take into account the investment objectives, financial situation or needs of
    any investor.

    All investors should consider this presentation in consultation with a professional advisor of their choosing when deciding if an investment is
    appropriate.

    Sphera has prepared this presentation based on information available to it, including information derived from public sources that have not been
    independently verified. No representation or warranty, express or implied, is provided in relation to the fairness, accuracy, correctness, completeness
    or reliability of the information, opinions or conclusions expressed herein.

    This presentation should not be considered a comprehensive representation of Sphera's business, financial performance or results.

    This presentation may contain forward-looking statements. These statements reflect Sphera’s current knowledge and its expectations and projections
    about future events and may be identified by the context of such statements or words such as “anticipate,” “believe”, “estimate”, “expect”, “intend”,
    “plan”, “project”, “target”, “may”, “will”, “would”, “could” or “should” or similar terminology.

    Sphera undertakes no obligation to update or revise these forward–looking statements to reflect events or circumstances that arise after the date made
    or to reflect the occurrence of unanticipated events. Inevitably, some assumptions may not materialize, and un-anticipated events and circumstances
    may affect the ultimate financial results. Projections are inherently subject to substantial and numerous uncertainties and to a wide variety of significant
    business, economic and competitive risks.

    Therefore, the final results achieved may vary significantly from the forecasts, and the variations may be material.

                                                                                                                                                                   2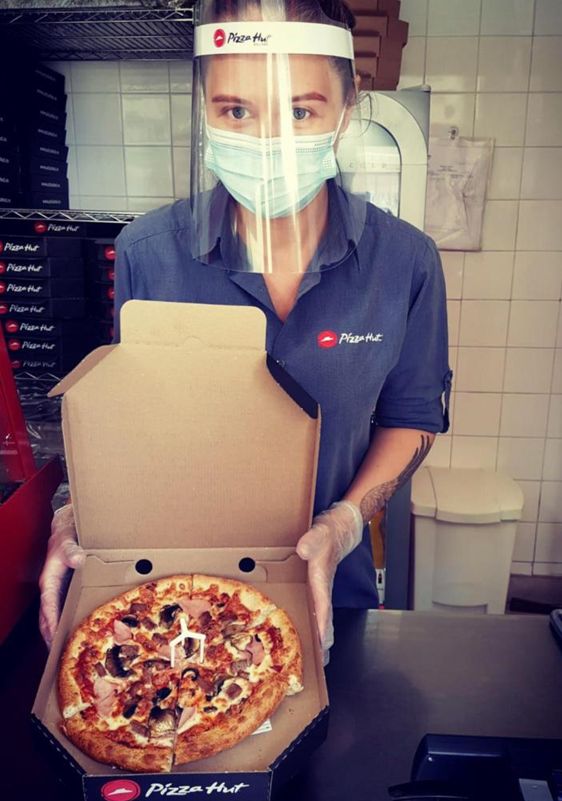
Agenda

         1      Sphera Franchise Group at a glance

         2      H1 2020 Highlights

         3      COVID-19 Response

         4      Brand Performances

         5      Key H1 2020 Financials

         6      Q3 2020 Gradual Recovery

         7      Q&A session

  For further details
  We invite you to read the Full Director’s report which includes analysis of financial results, details our response to
  COVID-19 crisis as well as provides key risks as foreseen by management for H2 2020. You can access the H1 2020
  report at www.spheragroup.com, Investor Relations section.
                                                                                                                           3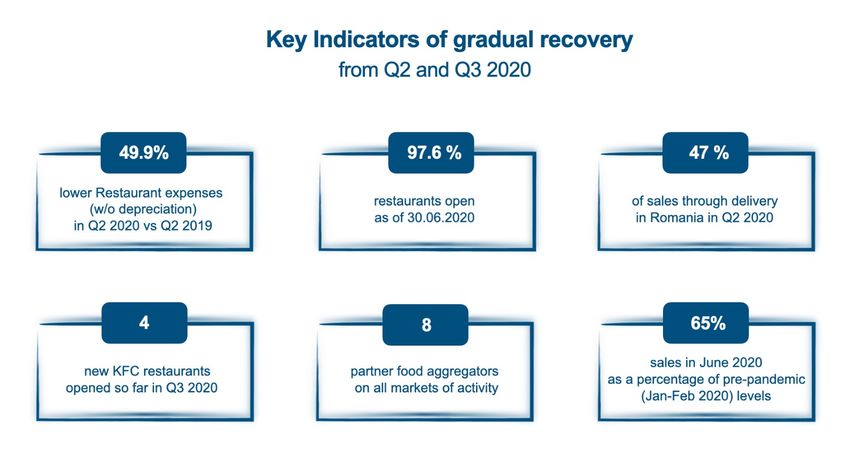
Sphera Franchise Group at a Glance

                                                                                                                                                                             Track record and
            2nd Quick
                                                  1st Full-Service                                                                                                            above-market
             Service                                                                              25 Years of                      157 Restaurants
                                                    Restaurant                                                                                                                   average
           Restaurants                                                                            Operation                         in 3 countries1
                                                     Operator                                                                                                                  performance
            Operator
                                                                                                                                                                               even in crisis2

                                                                          Pre-Crisis Performance (2017 - 2019)

                                                                          23%                   9.2%                16%               9.3%
                                                                    Restaurant sales       LfL(3) restaurant    Increase in no.     Normalized
                                                                        growth              sales growth         of restaurants      EBITDA
                                                                                                                                     growth(2)

                                                                                                     3-year CAGR

 Source: IFRS financial information, excluding impact from IFRS 16 adoption (starting 2019), HORA Association
 Notes: 1) Active Restaurants as of 1.09.2020 2) Performance in H1 2020, Group vs Romanian Hospitality Sector, based on estimates of HORA Association, 3) LfL performance for the reporting year is   4
 calculated by taking into account all the restaurants that have been in uninterrupted operation from the beginning of the preceding year to the end of the reporting year
Sphera Franchise Group at a Glance

  Introduction to Sphera Franchise Group                                                                      Geographical footprint

  • Sphera is one of the leading food operators in Romania1, operating also through its
    subsidiaries in Moldova and in Italy
  • Sphera was incorporated in May 2017 to consolidate all brands operated by the
    Group, namely KFC, Pizza Hut Dine-In and Pizza Hut Delivery under one company
  • Quoted on the Bucharest Stock Exchange since November 2017; since September                                                                           2
    2018 SFG shares are included in the Main Index of Bucharest Stock Exchange, BET.                                           17              137
  • In 2017, Sphera secured the franchise for operation of Taco Bell restaurants in
    Romania
  • In 2017, Sphera opened its first two KFC restaurants in Italy and is already the
    largest KFC operator in Italy
  • KFC Romania, KFC Italy, Pizza Hut, Pizza Hut Delivery Romania and Taco Bell
    Romania operate under the Yum International Franchise Agreement

 Locations split per brand2

                                                          3
                 17                                                                                                                                    Bucharest

                                                                                         10                                            30 KFC

                                                                          20                                                           11 PH

                                                                                                                                       15 Pizza Hut
        22                                                                                                                                Delivery

                                           63                                                 7                                        4 Taco Bell

                                                                         14

                                                                                                                                       60 Total
                       Food Court               In Line       Drive-through
                                                                                                                                        KFC restaurants
                                                                                                                                        PH and PH Delivery restaurants
  Notes: 1) first in FSR and second in QSR, 2) Restaurants of of 1.09.2020, 1 Paul Store not included above                             Taco Bell restaurants            5
Sphera Franchise Group at a Glance: Corporate Structure

                    99.9%                 99.9%                                       99.9%                         100%                            80%

                                      American Restaurant          California Fresh Flavors        US Food Network S.R.L.              US Food Network
    US Food Network S.A.
                                         System S.A.                        S.R.L.                         - Italy                     S.R.L. - Moldova

   q   holds    the   franchise   q     holds    the   franchise   q   holds    the    franchise   q   holds     the   franchise   q   holds the franchise
       rights to operate KFC-           rights to operate Pizza        rights to operate Taco          rights to operate KFC-          rights to operate KFC-
       branded restaurants in           Hut-branded restaurants        Bell-branded                    branded restaurants in          branded restaurants in
       Romania                          in Romania (Pizza Hut          restaurants in Romania          certain regions of Italy        Moldova
                                        Dine-In and Pizza Hut
                                        Delivery)
                                  q     holds sub-franchise
                                        rights

                                                                                                                                                                6
Key Investment Highlights

                                                        1                                                    2
                                                              Leading food service                               Even in challenging
                                                              group operating a                                  environment,
                                                              portfolio of internationally                       significantly above-
                                                              recognized brands                                  average performance1

                   8                                                                                                                              3
                       Significant further growth                                                                                                     Proven network roll-
                       potential in Romania and                                                                                                       out capabilities with
                       massive white space                                                                                                            long track record of
                       opportunity in Italy                                                                                                           successful growth

                                                                                        Logo/Text
                       7   Enhanced marketing                                                                                                 4
                           capabilities investing                                                                                                     Profitable business
                           directly into notable                                                                                                      model with strong cash
                           successful marketing                                                                                                       generation
                           campaigns

                                                          6    Operational                                5 Scalable platform
                                                               excellence proven by
                                                               consistent top ranked
                                                                                                                 with fully fledged
                                                               among YUM                                         process in place
                                                               franchisees in Europe                             allowing efficient
                                                                                                                 roll-out

 1) HORA, the Romanian Hotel and Restaurants Association, stated that the overall sales turnover in the industry in the first half of 2020 dropped by 70% compared to the same period of   7
 last year as a result of the COVID-19 pandemic, with 40% of the operators suspending their activity.
Leading Foodservice Group in Romania

                                                                                   QSR
                                                                   #2   player on the QSR segment (18% market share)
                                                                        and #1 on the chicken segment
                                                                   #2   player on the overall chained foodservice market (15% market share)

                                                                   ü    83% spontaneous brand awareness among Romanian
                                                                        customers (YE 2018)
                                                                   ü    customer base consists mainly of young and
                                                                        middle-aged people (78%), mostly educated
                                                                        (at least 35% high school), with an average            ü     First Taco Bell was opened in
                                                                        household income                                             Oct-2017 in Bucharest
                                                                  ü     83 restaurants in Romania
                                                                        as of 1.09.2020                                                       ü   10 restaurants as of
                                                                                                                                                  1.09.2020

                                                                                                             #2   player on the Home delivery segment (nearly 21%
                                                                                                                  market share)

                                                                                                                                                                                ry
                                                                         player on the FSR segment                ü    Order accessibility: classic call center lines,

                                                                                                                                                                             ive
                                                                   #1
                                                                         (nearly 3% market share)                      dedicated website platform, mobile
                                                                                                                       application

                                                                                                                                                                         del
                                                                   #3    player on the overall chained
                                                                         foodservice market (7% market share)            ü    C .50% online orders
                                                                   ü                                                                                                     e
                                                                                                                                                                    om
                                                                        C. 60% spontaneous brand awareness among
                                                                        Romanian customers                                      ü 21 restaurants as of
                                                                   ü    customer base consists mainly of young and middle-
                                                                                                                                  1.09.2020                     H
                                                                        aged people (78%), mostly educated (at least 41% high
                                                                        school & 32% university), with a focus on families with
                                                                        an average to medium-high household income
                                                                   ü    23 restaurants as of 1.09.2020

 Source: Company infomration, Euromonitor, Consumer Foodservice in Romania, May 2017, Deloitte Analysis                                                                              8
Foodservice Market Structure & Comepetitive Overview

  Chained players generates below 20% of sector sales                                                     KFC: no. 2 but growing faster

                           3%
                                                                                                              #              Brand              Product offering        2018 Mk share   ‘13-’18 var. +pp.
               12%                                                       Full-Service Restaurants
                                                                         Cafés/Bars                                                             Burgers, Chicken,
                                     18%                                                                      1                                                           22.6%              -4.0%
                                                                                                                                                Salads, Desserts
                                                  36%                    Limited-Service Restaurants
                                                                         Street Stalls/Kiosks                                                   Chicken, Burgers,
                                                                                                              2                                                           16.1%              +3.2%
                                                                                                                                                Salads, Desserts
     16%            RON22.0b sales                                       Self-Service Cafeterias
                   970m transactions
                                                                                                              3                                     Greek food              3.3%             +2.8%

                                                                                                              4                                       Salads                2.8%             +2.0%
                    82%

                                                                                                              5                                  Turkey kebabs              2.5%             +1.5%
                          33%
                                                                           Chained     Independent
                                                                                                           Top 5                                                          47.5%               5.5%
      Source: Euromonitor, Consumer Foodservice in Romania, 2018.                                         Source: Euromonitor, Consumer Foodservice in Romania, 2018.

   FSR: Pizza Hut Dine-in no. 1 and increasing distance vs no. 2                                            Delivery: Pizza Hut Delivery no. 1
        #             Brand               Product offering          2018 Mk share     ‘13-’18 var. +pp.       #              Brand               Product offering       2018 Mk share   ‘13-’18 var. +pp.

        1                               Pizza, Pasta, Burgers          2.7%                 +0.4%             1                                        Pizza                2.0%             +0.9%

                                             Pizza, Pasta,
        2                                                              0.5%                 -0.1%             2                                        Pizza                1.5%              0.0%
                                        traditional Italian food

        3                               Pizza, Pasta, Burgers          0.5%                 +0.5%             3                                        Pizza                1.4%             +0.9%

                                         Traditional Serbian
        4                                                              0.4%                 0.0%              4                                        Pizza                1.1%             +0.6%
                                                 food

                                         Grill, Romanian and
        5                                                              0.4%                 +0.4%             5                                        Pizza                0.8%             -0.1%
                                          Moldavian cuisine

     Top 5                                                             4.8%                                 Top 5                                                          69.8%

   Source: Euromonitor, Consumer Foodservice in Romania, 2018.                                            Source: Euromonitor, Consumer Foodservice in Romania, 2018.

                                                                                                                                                                                                            9
Successful Track Record of Growth
Long Track Record of Successful Network Development Sustained Growth Across All Brands
(1)
KFC Pizza Hut Dine-In Pizza Hut Delivery Taco Bell Transformation Phase
KFC remaining the key contributor at ca. 83% of revenues
1200
154
Acceleration Phase 138 10 1000 CAGR 2016-2019 33
Development Phases 23%
113 5 12 132
22 800
Initial Phase 98
86 22 3 123
76 600
75 2 23 112
74 97
17 23
64 400 789
60
12 635
9 22 503
54 200 413
21
10 9 9
18
48
8 14 0
7 15 14
35 4 13 99 2016 2017 2018 2019p
3 13 13 88
13 72 KFC Pizza Hut Taco Bell
23 1
11 59 65
15 49 52 53
5 40 43 Coupled with Strong and Resilient LfL Growth
8
11
4 32 37
6
1 1 1 2 4 4 4 5
3 4 18 23
3 3 3 3 3 5 7 11
1 1 1 1 1 1 1 2 3 17.0%
18%
'94
'95
'96
'97
'98
'99
'00
'01
'02
'03
'04
'05
'06
'07
'08
'09
'10
'11
'12
'13
'14
'15
'16
'17
'18
'19
16%
13.0% 12.5%
14%
11.0%
12%
9.2%
10%
8%
6%
3.1%
4%
1.2%
First Pizza First Pizza Sphera 2% 0.4%
First Pizza First Pizza First KFC First KFC First Drive First Taco
First KFC Hut Hut Delivery First KFC holding
Hut in
in Romania
Hut outside outside
Delivery in in Rep. Thru KFC outside company
Bell in 0%
Bucharest in Italy Romania
Romania Bucharest Moldova (Sibiu) 2016 2017 2018 2019p
Romania Bucharest created
KFC Pizza Hut
Source: Company information, Consolidated Pro Forma Financial Statements.
10
Note: (1) Includes KFC restaurants in Romania, Moldova and Italy.Profitable Business Model (pre-COVID)
Sales Restaurant Opex Structure
(RONm)
955
771
619
514
Normalized EBITDA Net Profit
11
Note: 2019 result is excluding the impact of IFRS 16, unaudited.Scalable Platform Allowing Efficient Roll-out
Restaurant / Unit Selection Criteria New Restaurant Opening Process
Market Analysis
Identify Best Locations
Generators
(leisure – e.g. shopping
centres, cinemas or retail –
Traffic Traffic & Market Research
e.g. DIY, hypermarkets,
furniture stores etc)
Project Management
Architects & Designers
Identify locations around
Residential Contractors & Vendors
areas
Construction
Grand Opening
12Growth Opportunities: strategy based on four key pillars
COVID-19 Adjustment
• Postponement, not the abandonment of the development plan
• The scale of the business as well as agile adoption to realities have helped the group lower the expenses in H1 2020 thus
lowering the negative impact of the pandemic on the business (decline less than half of the Romanian hospitality industry
average, where revenues dropped -70% in H1 2020 compared to H1 2019)
• Special attention paid to operational expenses – only stores that can cover own expenses remain open
• Focus on maximizing revenues through partnership with food aggregators, delivery and digitalization, temporary
adjustment expected to bring long-term results in the post-pandemic realities
Maintain Strong Continue Organic Develop a Significant Expand Brand
LFL Sales Growth Network Roll-out KFC Business in Italy Portfolio – Taco Bell
Note: Size of segments do not constitute indication to their contribution to the overall growth.
13Restaurant roll-out plan by brand: pre-pandemic estimates
2017 2018 2019 2020 2021 2022 Total
Commitment 4 6 7 8 9 9 43
KFC Romania
Target 7 7 7 10 10 10 51
Pizza Hut Commitment 5 5 7 8 9 - 34
(Dine-in & Delivery) Target 6 7 7 8 8 8 44
Commitment 2 3 5 - - - 10
Taco Bell Romania
Target 2 3 5 2 2 - 14
KFC Italy (North-East Commitment 3 6 8 7 7 1 32
& Piemonte) Target 3 6 8 8 7 2 34
Commitment 14 20 27 23 25 10 129
TOTAL OPENINGS
Target 18 23 27 28 27 20 143
• Given the rapidly developing situation related to the COVID-19 pandemic as well as global uncertainty related to the second half of the
year, the Group has not yet revised the development plans.
• Possibility of postponing the 2020 targets to mid-2021 as a result of delays caused by the offset of the COVID-19 pandemic and the lock-
down measures implemented in Europe between March – May 2020.
• So far 5 KFC restaurants opened thus far in 2020 (3 in Romania, 2 in Italy).
14Number of restaurants at year-end: pre-pandemic estimates
• Given the rapidly developing situation related to the COVID-19 pandemic as well as global uncertainty related
to the second half of the year, the Group has not yet revised the development plans.
• 250
Possibility of postponing the 2020 targets to mid-2021 as a result of delays caused by the offset of the COVID-
19 pandemic and the lock-down measures implemented in Europe between March – May 2020.
14
• So far 5 KFC restaurants opened thus far in 2020 (3 in Romania, 2 in Italy).
14
200
12 77
69
10
150 61
5 34
53
32
2
46 25
100
39 17
33 9
27 3
23
116
106
50 96
86
79
72
60 65
53
0
2014 2015 2016 2017 2018 2019 2020 2021 2022
KFC KFC Italy Pizza Hut Taco Bell
Notes: (1) Includes KFC Romania and KFC Moldova 15H1 2020 Highlights
16Sphera Franchise Group – H1 2020 Highlights
Swift response helped close H1 2020 performance well-above the RO market average
• In COVID-19 context, HoReCa industry was hit the hardest as it faced direct cease-of-operations order from
authorities.
• Romanian Hotels and Restaurant Association, HORA announced that in H1 2020 the revenues of sector dropped
by 70% compared to H1 2019; 40% of operators suspended their activity.
Amid lock-down on all markets on activity, April 2020 registered the weakest performance. Recovery since.
• As expected, and communicated on 14.05.2020 (Q1 results), Q2 took the hardest hit: -54%in sales compared to
Q2-2019.
• Sales in April plunged but gradual increases were recorded since May until today. Management expects gradual
recovery in Q3 and Q4 unless other lockdowns are ordered or unexpected negative evolution occurs.
Focus on cost-optimization in Q2 2020, to be continued throughout H2 2020
• Sales dropped by 31.6% compared to H1 2019, nonetheless the Group managed to maximize financial results
in COVID-19 context by swiftly adjusting business model.
• Key measures taken in COVID-19 context in Q2 2020:
§ operational focus on containing operational expenses (incl. restaurant and G&A) and cash drains;
§ financial focus on enhancing short-term liquidity;
§ strategic & marketing focus to boost revenues through delivery and collaboration with food aggregators.
Positive signs of gradual recovery thus far in Q3 2020
• Estimated results from July & August presented by the management alongside H1 2020 to support Group’s
confidence in improving situation.
17Sphera Franchise Group H1-2020 Performance
RESTAURANT SALES EXPENSES NORMALIZED EBITDA
RON m RON m, excluding IFRS 16 RON m, excluding IFRS 16
445.6 422.8
-23.7% 36.7
-31.6%
-95.6%
322.4
216.8
304.6 -45.8%
230.8 21.2
-54.0%
117.5
106.3 Q2 -109.4%
Q2
Q2
206.0
214.7 -0.6%
15.5
-7.6%
198.3 204.8 -77.4%
1.6
Q1 Q1 Q1 3.5
H1 2019 H1 2020 H1 2019 H1 2020 H1 2019 -2.0
H1 2020
18Sphera Franchise Group H1-2020 Sales performance per country
401.0m 39.2m
-32.5%
-21.9%
270.6m
30.6m
5.4m
-38.9%
3.3 m
Values in RON.
H1 2019 values on top of the map, H1 2020 on the bottom. 19COVID-19 Response
Markets of Activity: COVID-19 Developments

                     •   State of Emergency: 18.03.2020 – 14.05.2020.
                     •   State of Alert: 15.05.2020 – today.
                     •   SFG restricted restaurant operations on 18.03.2020 until 15.05.2020.
                     •   15.05.2020 – restaurants with outdoor seating reopened.
                     •   15.06.2020 – shopping malls open but closed-space food courts closed.
                     •   1.09.2020 - Indoor seating restaurants re-opened

                     •   Lockdown: 09.03.2020 – 18.05.2020.
                     •   State of Emergency: 18.05.2020 – 15.10.2020.
                     •   18.05.2020 – restaurants allowed to open applying strict social distancing rules.
                         Consequently, only 50% of indoor seating available.

                     •   State of Emergency: 17.03.2020 – 15.05.2020, further extended by Extraordinary
                         National Commission of Public Health.
                     •   On 15.03.2020 announced that dine-in bars and restaurants closed, takeout orders and
                         delivery limited.
                     •   Since 22.04.2020 take-away is allowed for all street locations.
                     •   Since 16.06.2020 take-away is allowed for all service venues except for commercial
                         centres and markets.

                                                                                                                21
Business Calibration: Measures in response to COVID-19
Maximizing Revenues
• Change in strategy: enhanced cooperation with local food aggregators:
o Romania: FoodPanda, Glovo, Tazz (EuCeManac), TakeAway;
o Italy: Glovo, Deliveroo, Just Eat, UberEats;
o Moldova: Straus (iFood pending).
• Marketing campaigns promoting delivery and drive-through, joint campaigs with food aggregators (TV, digital).
Restaurant Operations
§ Upon reopening additional safety measures in all operating restaurants, in line with Yum + Govt. recommendations.
§ New operational flows at restaurant level that allow safe operation and delivery activity.
§ Limited menu in restaurants, only core products.
§ The management is actively monitoring the performance of individual stores to determine which stores remain open,
fully or partially, and which ones are to be closed.
§ Only restaurants that can cover their operating costs by taking advantage of the open-air dining option
and/or by concentrating on delivery remain open.
COGS
§ No significant disruptions on supply chain procurement.
§ -1.6pp decrease in food and material expenses in H1 2020 despite temporary increase in waste in March 2020.
§ Excess raw materials (due to the closing of restaurants) with limited shelf-live was donated.
22Business Calibration: Measures in response to COVID-19
Staff
Romania:
• Technical unemployment covering 75% of average national salary implemented. Depending on the location,
employees were sent either fully or partially into technical unemployment.
• HQ kept oversight over the activity in the restaurants and in case of increased sales, calibrated the number of staff
and brought employees back from technical unemployment.
• As of 30.06.2020, an estimated 22% of the employees from Romanian restaurants were still in technical
unemployment.
Republic of Moldova:
• Starting with 1.04.2020, more than half of Group employees were on technical unemployment, receiving an indemnity
of 70% of their base salary; the state covered 43% of this indemnity.
Italy:
• No prolongation of employees’ term contracts since the onset of pandemic, generating a natural attrition of 20%.
• For the rest of employees, the Group applied for technical unemployment during lockdown and then gradually re-
called them as the stores reopened. The state covered a monthly amount of 80% of employees’ salary (subject to
caps: EUR 939.89 for a salary of EUR 2,159.48 or below, and EUR 1,199.72 for a salary in excess of EUR 2,159.49)
HQ (G&A):
• All hiring activity frozen as of March.
• Payroll costs reduced by either applying for technical unemployment or by reducing the working week from 5 to 4
days (equivalent to a 20% reduction in payroll cost). As of 30.06.2020, all HQ staff was back from technical
unemployment.
• Top management took a voluntary 25% reduction in their pay.
As of 30.06.2020, Sphera Franchise Group had 5,003 employees, 4,665 employees in Romania, 262 employees in Italy
and 76 employees in the Republic of Moldova.
23Business Calibration: Measures in response to COVID-19
Rent
• In March 2020, the Group notified all the lessors to renegotiate or temporarily suspend the rental contracts and
entered a detailed and extensive process of renegotiating rental agreements.
• As of 30.06.2020, the amount of fixed rent discounts recognized and recorded in accounting was RON 4.5 million,
representing the equivalent of approximately one-month fixed rent.
• Discussions are still in progress for approximately 25% of contracts. Discounts obtained as a result will be
reflected in Q3 2020.
Financial
• Activation of existing working capital line opened with house bank that was unutilized until the start of the
pandemic – RON 20.3m.
• Secured new short-term working capital line – RON 10m.
• Refinancing of investments by activation of lines from the existing bank – EUR 2.7m.
• Accelerated recovery of VAT from the state for USFN Romania and CFF – RON 23.5m
• Medical leave recovery for USFN Romania – RON 2.5m.
• Postponement of principal amount for banks and leasing companies –approx. RON 24m.
• Supplier financing materialized in engaging in good faith negotiation with suppliers and negotiations with Yum!.
24Brand Performance
Active Stores: Evolution in H1

Restaurant count
as of 30.06.2020           81               2               16              23               21              10                 153
Operational
restaurants

- 22-Mar                  29                1               0                0              15                0                 45
- 14-May
                          46                1              10                5              15                5                 82
- 30-Jun
                          79                1              16               21              21               10             148

  •   The number of active stores dropped drastically mid-March following the introduction of State of Emergency, with only
      30% of stores active on 22.03.2020.
  •   On 14.05.2020, following the decision to loosen restrictions on all the markets of activity, 53% of stores were active.
  •   As of 30.06.2020, 96.7% of stores were active and only 5 restaurants were temporarily closed.
  •   In 2020, the Group opened 2 new KFC stores in Italy and 3 KFC in Romania. Two stores were closed in Romania,
      one KFC and one PHD.
  •   The Group has 157 active stores as of 1.09.2020.                                                                                26
Brand Evolution in H1 2020
% of pre-
pandemic sales*
- March
51% 53% 18% 35% 72% 43% 47%
- April 25% 21% 10% 0% 63% 0% 22%
- May 49% 42% 40% 9% 72% 46% 46%
- June 68% 42% 80% 24% 70% 61% 65%
• Hardest hit in April, with no sales for Pizza Hut (dine-in) and Taco Bell. Recovery trend starting May.
Sales H1 2020
(RON, m) 218.8 3.4 30.6 19.8 19.9 12.0 304.6
• Positive impact of the Work from Home model: significant increases to the average order value for all the brands from the
Group portfolio in Q2 2020, as compared to the same period of the last year.
• The split between delivery and non-delivery sales has shifted over Q2 2020, with 47% of all orders in Romanian stores being
delivered and 53% sold in-store; as a comparison, in the same period of 2019, only 7% of sales were generated through the
delivery channel, with 93% of sales being done in-store
27
* Average of sales from January and February 2020Key H1 2020 Financials
H1 2020 Result

  Statement of Comprehensive Income (excluding IFRS 16)

   •   Sales down 31.6% in H1 2020 compared to H1 2019; expenses down by 23.8%.
   •   Restaurant operating profit of RON 6.7 million in H1 2020, 86.5% lower compared to H1 2019.
   •   The 8.2% decrease in General & Administrative expenses, helped achieve an EBITDA of RON 0.8 million, 97.9%
       lower compared to H1 2019.
   •   Normalised EBITDA of RON 1.6 million, a decrease of 95.7%, with an EBITDA margin by 8pp lower compared to the
       previous period.
   •   Operating profit decreased by 178% Y/Y to RON -17.8 million
   •   Loss for the period equalled RON 22.4 million (-223.6%).                                                        29
H1 2020 – Restaurant Expenses
Restaurant Expenses lower by 25% in H1 2020 vs H1 2019 (excluding IFRS 16)
• Except for other operating expenses and depreciation and amortization, all the restaurant expenses have decreased
significantly.
• The rent costs (without IFRS 16) decreased by 7,4% compared to the same period of last year even though the
Group operated 10 more restaurants during H1 2020 compared to H1 2019. Further rent negotiations are still
ongoing.
• 5.8% increase in “Other operating expenses” primarily driven by the higher share of aggregators’ commissions.
• Increased depreciation and amortization are the result of opening 10 new restaurants between 30.06.2019 and
30.06.2020.
30H1 2020 – G&A Expenses
G&A Expenses lower by 8.2% (excluding IFRS 16) in H1 2020 vs H1 2019
Data in RON ‘000 Percentage of sales
H1-20 H1-20 H1-19 H1-19 Change (%) H1-20 H1-20 H1-19 H1-19
2020/ 2020/
(1) (2) (1) (2) (1) (2) (2) (2)
2019 (1) 2019 (2)
General and 23,915 24,447 26,410 26,632 -9.4% -8.2% 7.9% 8.0% 5.9% 6.0%
administration (G&A)
expenses, net
Payroll and employee 15,630 15,630 15,808 15,808 -1.1% -1.1%
benefits
Third-party services 4,156 4,441 5,332 5,332 -22.1% -16.7%
Depreciation and 2,231 770 2,158 785 3.4% -1.9%
amortization
Rent (23) 1,685 237 1,831 -109.6% -8.0%
Banking charges 1,304 1,304 1,561 1,561 -16.4% -16.4%
Transport 617 617 1,315 1,315 -53.1% -53.1%
Note: (1) Including the impact of the adoption of IFRS 16; (2) Excluding the impact of the adoption of IFRS 16.
• In H1 2020, G&A expenses of the Group decreased by 8.2% compared to H1 2019.
• In Q2 2020, G&A expenses decreased by RON 3.1 million (-22.6%) compared to Q2 2019.
• The largest cost-savings registered in H1 2020 were on transport (-53.1%) and third-party services (-16.7%).
• The payroll costs for G&A decreased by 3.0% in H1 2020; in Q2 payroll costs were reduced by 23.7% through
different measures.
31H1 2020 – individual performance by companies from the group
USFN (KFC) Romania and Moldova ended H1 2020 with a net profit (excluding IFRS 16)
• USFN Romania and USFN Moldova closed H1 2020 on operating profit, corresponding to a net profit of RON 7.4
million.
• The rest of the Group entities ended H1 2020 with a loss for the period. USFN Italy registered the biggest drop
resulting from the severe impact of the coronavirus pandemic on the local economy and widespread and prolonged
lockdown measures in Italy.
32Impact of IFRS 16 on H1 2020 Results
As a result of IFRS 16 adoption, normalized EBITDA increased to RON 29.3m in H1 2020
H1-20 H1-20
Including Excluding Impact of
Data in RON’000
impact of impact of IFRS § Starting 1 January 2019, Sphera applies IFRS 16 that sets
IFRS16 IFRS16 Adoption out the principles for the recognition, measurement,
Restaurant sales 304,580 304,580 0
presentation and disclosure of leases.
Restaurant expenses 296,476 297,903 -1.427
Food and material 100,793 100,793 0 § At the commencement date of a lease, a lessee recognizes
Payroll and employee benefits 71,315 71,315 0 a liability to make lease payments (i.e., the lease liability)
Rent 3,409 29,295 -25.886
Royalties 17,884 17,884 0 and an asset representing the right to use the underlying
Advertising 14,429 14,429 0 asset during the lease term (i.e., the right-of-use asset).
Other operating expenses, net 46,582 46,414 168 Lessees are required to separately recognize the interest
Depreciation and amortization 42,063 17,773 24.290
expense on the lease liability and the depreciation expense
Restaurant operating Profit / (Loss) 8,104 6,677 1.427
on the right-of-use asset;
General & Admin expenses, net 23,915 24,447 -532
Operating Profit/(Loss) (15,810) (17,771) 1.961 § In H1 2020, as a result of adoption of IFRS 16, Sphera
Finance costs 9,303 2,902 6.401 recognized additional depreciation expense of RON 24.3m
Finance income 88 88 0
and finance cost of RON 6.4m. At the same time, the rent
Profit/(Loss) before tax (25,026) (20,585) -4.441
Income tax expense 1,313 1,775 -462 expenses were reduced by RON 25.9m.
Profit/(Loss) for the period (26,339) (22,360) 3.979 § As a result, normalized EBITDA increased to RON 29.3m
EBITDA 28,483 772 27.711
Normalised EBITDA* 29,274 1,563 27.711
while the loss grew to 26.4 m.
33Q3 2020 Gradual Recovery
Key indicators of gradual recovery – Q2 & Q3 2020

                                                    35
Key indicators of gradual recovery – March + Q2 + Q3
To support the Group’s confidence in the improving situation, we exceptionally provide estimates showcasing the
increasing trend in sales as registered in July 2020 and August 2020 (estimated data as of August 26th, 2020).
90%
• On the adjacent graphs are presented
sales as a % of pre-pandemic sales 80%
80%
levels (average sales from January
and February 2020). 75%
70%
• June-August results show the positive
65%
effects of the unfreezing of the 60%
economies in all 3 countries of
activity. 50%
• Management will continue 47% 46%
optimization measures throughout H2 40%
2020.
• Group operationally prepared for 30%
different scenarios throughout H2
2020, including lockdowns. 20% 22%
• On 1.09.2020 indoor restaurants were
allowed to open after almost 6 10%
months break.
0%
March '20 April '20 May '20 June '20 July '20 August '20
36Ongoing business evolution
Further Support Measures in Romania
• On 29.05.2020, the Emergency Ordinance no. 92/2020 on the application of support measures for the
Romanian employees and employers in the context of SARS-CoV-2 coronavirus, as well for the amendment
of legislation was published in the Official Gazette no. 459/29.05.2020. At the time of publishing this report,
under the terms of the above-mentioned Ordinance, Sphera Franchise Group is in the process of applying for
a state aid which will cover 41.5% of costs related to the salaries of employees who received technical
unemployment indemnity for at least 15 days. This measure is to apply starting Q3 2020.
37Q&A
Thank you for your attention!
You can also read