DIVERSIFIED GAS & OIL PLC - INVESTOR PRESENTATION JANUARY 2018 - cloudfront.net
←
→
Page content transcription
If your browser does not render page correctly, please read the page content below
DIVERSIFIED                             GAS   &   OIL   P L C

I N V E S T O R P R E S E N TAT I O N
JANUARY 2018

                                                         CONFIDENTIAL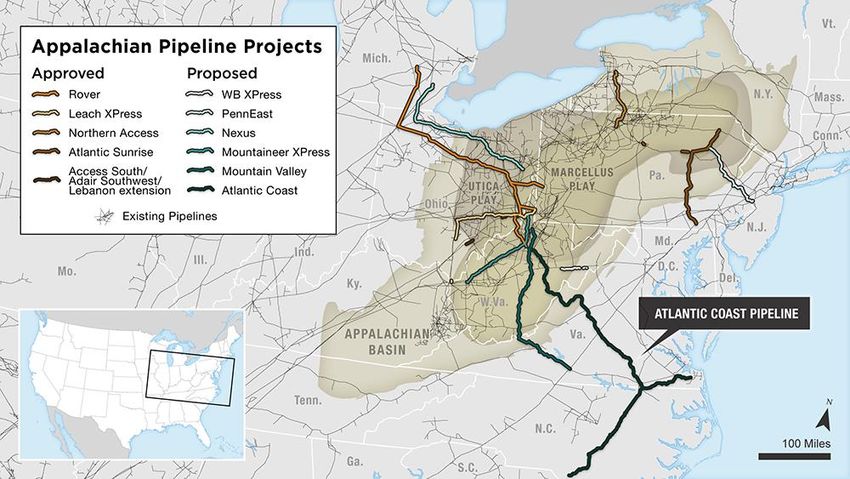
January 2018 Investor Presentation

DISCLAIMER
  The information contained in this document has been prepared by Diversified Gas & Oil PLC (the “Company”). This document is being made available for information purposes only and does not
  constitute an offer or invitation for the sale or purchase of securities or any of the assets described in it nor shall they, nor any part of them, form the basis of or be relied on in connection with, or
  act as any inducement to enter into, any contract or commitment whatsoever or otherwise engage in any investment activity (including within the meaning specified in section 21 of the Financial
  Services and Markets Act 2000).

  The information in this document does not purport to be comprehensive. While this information has been prepared in good faith, no representation or warranty, express or implied, is or will be
  made and no responsibility or liability is or will be accepted by the Company or any of its officers, employees, agents or advisers as to, or in relation to, the accuracy or completeness of this
  document, and any such liability is expressly disclaimed. In particular, but without prejudice to the generality of the foregoing, no representation or warranty is given as to the achievement or
  reasonableness of any future projections, management estimates or prospects contained in this document. Such forward-looking statements, estimates and forecasts reflect various assumptions
  made by the management of the Company and their current beliefs, which may or may not prove to be correct. A number of factors could cause actual results to differ materially from the
  potential results discussed in such forward-looking statements, estimates and forecasts including: changes in general economic and market conditions, changes in the regulatory environment,
  business and operational risks and other risk factors. Past performance is not a guide to future performance.

  The document is not a prospectus nor has it been approved by the London Stock Exchange plc or by any authority which could be a competent authority for the purposes of the
  Prospectus Directive (Directive 2003/71/EC). This document has not been approved by an authorised person for the purposes of section 21 of the Financial Services and Markets
  Act 2000.

  The information contained in this document is subject to change, completion or amendment without notice. However, the Company gives no undertaking to provide the recipient with access to
  any additional information, or to update this document or any additional information, or to correct any inaccuracies in it or any omissions from it which may become apparent.

  Recipients of this document in jurisdictions outside the UK should inform themselves about and observe any applicable legal requirements. This document does not constitute an offer to sell or
  an invitation to purchase securities in any jurisdiction.

                                                                                                                                                                                                                 1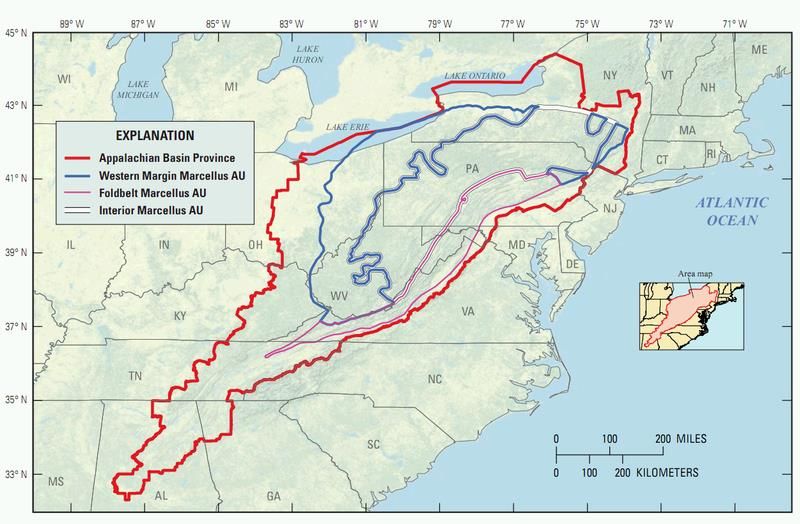
January 2018 Investor Presentation

MARKETING PURPOSE

             Acquire Two Transformative Packages for $180M* in Cash

    Target: Alliance Petroleum Corporation - $95M                Target: “Mountaineer”** - $85M

                                  $180M Equity Capital Raise

                                  Progresses Stated Strategy
Geographic Concentration Drives           Enhances per share                Further Positions DGOC
          Efficiency                      Cash Flow & Dividend                  as Consolidator

Footnotes:
* Net of expenses
** “Mountaineer” is a code name
                                                                                                                    2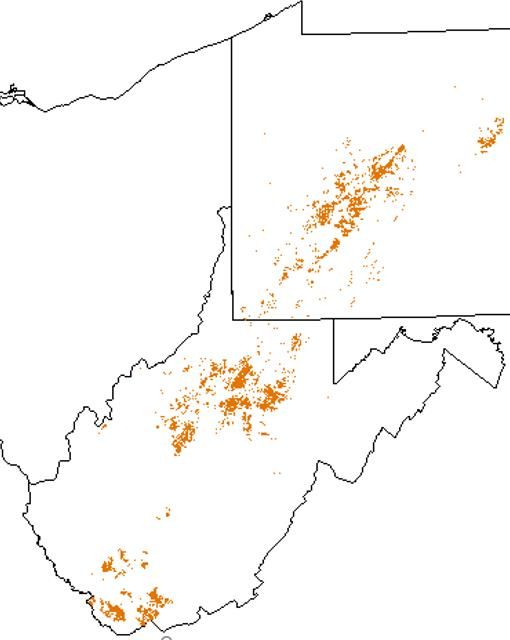
INTRODUCTION TO DGOC
Our Current Business

                       3
January 2018 Investor Presentation
CORPORATE OVERVIEW: DIVERSIFIED GAS & OIL PLC
APPALACHIAN BASIN GAS AND OIL PRODUCER
Corporate Profile Today
Exchange Listing Details AIM DGOC
DGOC Focus Area
Net Daily Production MBoe per Day 10.3
(a)
Net PDP Reserves MMboe 54.6
Ordinary Shares in issue #M 145.1
Share Price (18 Jan 2018) GBp/share 88.50
Market Capitalisation(b) US$M $178
Net debt (a) US$M $58
Enterprise Value(b)(c) US$M $236
Regional Profile – Appalachian Basin
Established Oldest hydrocarbon producing region in the US
Sustainable Long reserve life (~40 to 50+ years per well) with low plugging costs (~$10k/well)
Productive Basin produces ~24 Bcf/d Natural Gas with >1 million wells drilled (high success rate)
Active Abundant infrastructure that continues to attract new investment with conventional & horizontal development
Predictable Geologically prolific, long-life shale rock in Marcellus/Utica and conventional reservoirs
Stable Basin located within the continental United States with a stable and industry-friendly political environment
Growing Conducive environment; DGO ~80% Production CAGR since 2012; Significant pending acquisitions ($180M)
Footnotes: (a) Estimated as of December 31, 2017; (b) As of 18 January 2018 based on a closing price of 88.50 GBp; (c) Assumes a USD:GBP exchange rate of $1.38
4January 2018 Investor Presentation
COMPANY HISTORY MARKED BY GROWTH
Gross
Boe/
18,000 day
~80% Gross
‘17 Production
CAGR from 2012
to Jun17
Feb:
Floated on AIM raising
Gross $50m – largest UK O&G
Boe/ IPO since April 2014
4,333 day
Apr:
Gross Acquired producing wells in
Gross Boe/
Ohio and Pennsylvania for
Gross Boe/ 1,833 day ‘16 $1.75m
Boe/ 1,167 day
1,000 day
June:
Founded
‘15 Acquired producing wells
‘14
‘10 from Titan for $72.8m;
‘01 Successfully listed Raised add’l $35m through
Entered Ohio bond on ISDX secondary offering on AIM
Growth Market, which
Acquired producing raised £10.6m September:
wells from AB Acquired producing wells Closed on the remaining
Acquired assets of Titan wells held within
Resources for Acquired producing wells from Eclipse Resources
Diversified public partnership
$14.5m from Broadstreet Energy for $4.8m
Resources Inc. for structures (incl. 29 Hz
for $2.6m
$5.2m Acquired producing Acquired producing Acquired producing wells wells) for $11.4m
wells from Deep wells from Operated Acquired producing wells and pipeline assets from
Assets located in Resources, for Equity Investment and equipment from Seneca Resources for December:
West Virginia $5.5m (Fund 1) for $4.3m Texas Keystone for $725k $7.0m Acquired producing wells
from NGO for $3.1m
5January 2018 Investor Presentation
A UNIQUE OPPORTUNITY; ACHIEVING SCALE THROUGH ACQUISITIONS
Established, Profitable & Growing
• Founded in 2001 by the CEO with ~80% CAGR of production since 2012
• Over 10,300 net barrels of oil equivalent (“Boe”) production per day(a)
• 54.6 million Boe Proved-Developed-Producing reserves (significant, unrecorded PUD & 2P potential)(b)
Differentiated
• Low political and operational risk; 100% US onshore operations with stable, long-life production
• Low operating costs & maintenance capex; Averaging $7.46/Boe ($1.24/Mcfe) for the past six months(c)
• Cash-flow positive; +40% Adjusted EBITDA margins(c)
Proven Dividend Model
• Target dividend of ~40% of free cash flow (Paid $0.0398/share in 2017)
• Increasing Yield: 5.7% estimated yield on 2018 Dividends (before acquisitions)(d); 4.3% yield on 2017 Dividends(e)
• More than 75% above the average yield of the two other UK Listed independent E&Ps paying a regular dividend(d)
Value Creating
• Deep relationships in the industry support consistent and accretive deal execution
• History of success completing acquisitions; ~$135 million of transactions completed; $180 million expected in 1Q18
• Operational excellence & Strong balance sheet / liquidity position; Low unit OpEx cost; $50 million of liquidity(f)
Footnotes: (a) Net daily production rate is based on Dec17 “exit rate”; (b)Estimated as of 31 December 2017; (c) For the months June - November 2017; (d) Source: Bloomberg as of 18 Jan 2018; Peers include SEPL & SIA; Estimated yield excludes impact
of acquiring the two target acquisitions discussed within this presentation; (e) Assumes an average share price of $0.70 and $0.0399 total dividends; (f) At 31 December 2017 inclusive of $15 million cash + $35 available on credit facility.
6January 2018 Investor Presentation
OUR BUSINESS MODEL
Value Balanced ~6% 2018E Dividend Yield(a)
6.0%
• Disciplined pursuit of cash producing • Finance acquisitions with a proper 36% Equity Return
assets available at low multiples balance of debt and equity to maintain since IPO (b)
a strong balance sheet
5.0%
Peer Average Yield:
3.3%
Stable Efficient 4.0%
• Maintain a strong balance sheet and • Maintain efficient cost structure by
low leverage at reduced commodity spending only what is necessary 3.0%
prices 5.7%
2.0%
3.8%
Consistent Returns 1.0%
2.7%
• Manage producing wells to maintain • Return meaningful cash to
shallow declines and maximize shareholders through the dividend
economic recoverable reserves
0.0%
DGOC Peer 1 Peer 2
Footnote: (a) Source: Bloomberg as of 18 Jan 2018; Peers include SEPL & SIA; (b) From IPO on 3 Feb 2017 (£0.65) to 18 Jan 2018 (£0.885)
7January 2018 Investor Presentation
TRACK RECORD OF DELIVERING STATED OBJECTIVES
Successful AIM IPO • Largest AIM E&P IPO since 2014
• One of only three UK Listed E&P (of 90) to pay a regular dividend(a)
• $160m of capital raised in 2017(b); maintaining low leverage profile
Financially Strong • $50m of liquidity at 31 December 2017 ($15 cash + $35 undrawn credit facility)
Significant Production • 2017 Exit rate of >10,300 net barrels of oil equivalent production per day
• Significant producer on AIM; Growing rapidly through acquisitions
• >90% of long-life, low-decline wells located within a radius of ~200 kilometers
Increasing Scale • Closed three acquisitions since February 2017 IPO, incl. one transformative
• Strong pipeline of compelling opportunities with others emerging
Reducing Costs • Adjusted EBITDA margin averaging >40% from June to November 2017
• Integration and optimization of Titan acquisition continues
• 5.7% estimated 2018 dividend yield before target acquisitions(c)
Dividend Paying • 4.3% 2017 yield
• 75% above the average of other UK Listed E&Ps regularly paying a dividend(c)
Footnote: (a) Dividend paying companies include DGOC, SEPL & SIA; (b) Includes $85m of equity capital and $75m of debt capital; (c) Source: Bloomberg as of 18 Jan 2018; Peers are listed in footnote (a).
8January 2018 Investor Presentation
STRATEGY: ACQUIRE, PRODUCE, DRILL
I Price acquisitions as a multiple of cash flows from existing production; Pay
N
nothing for undeveloped resource
O
R Source: Large energy players looking to reduce operating expenses and
G re-focus their limited financial & personnel resources on shale
A
N Target: Predictable production rates, long-life (50+ years), low declines
I
C Focus: On asset attributes & scale vs. location (Geographically agnostic)
Acquire and manage O
producing natural gas N
Deploying rigorous field management programmes
and oil properties to G
O Reduce unit operating costs and improve margins
generate cash flows, I
providing stability and N Optimize production by managing compression; perform low-cost workovers
growth for our G
stakeholders
O
R Focus on conventional formations
G
A
Strict control of drilling and completion costs
N Increased drilling in higher price environment
I
C
o Progressive dividend
o Improving gross margins
o Reduced unit operating costs
o Strong free cash flow generation
9January 2018 Investor Presentation
OUR ASSETS: LOW RISK, LOW COST, LONG LIFE
DGOC operates a large portfolio of producing wells driving stable cash flows
Low risk (political & operational; US Onshore) producing gas
and oil assets (Average Production Mix: +95% natural gas)
Shallow depth (~3,000’ to ~6,000’), vertical wells into low
permeability reservoirs sitting above the shale
Mature wells benefitting from:
• Low operating costs (~$1.24 LOE/mcfe(a); Ongoing optimizing)
• Low ongoing/maintenance capex (~$1.0m - $1.5m/year)
• Low water production (~1/3 Bbl per well per day)
Low decline rates averaging 3-5% per annum, enabling a high
quality and reliable stream of free cash flow
Long well life estimated from 40-50+ years with significant well control
Attractive fiscal regime further improved by recent US tax reform
as corporate tax rate drops from 35% to 21%
Footnotes: (a) Average for the months June - November 2017
10PENDING TRANSACTIONS
Further Transforming DGOC
11January
January
2018
2018
Investor
Investor
Presentation
Presentation
ESTABLISHED, LARGE, INDEPENDENT APPALACHIA PRODUCER
Addition of two strategic and accretive acquisitions achieves significant scale and economies in the Basin
Highlights
Pennsylvania
✓ Broad base of producing wells provides for
consistent, stable production, cash flows and
dividends
Ohio
✓ Tight geographical profile provides significant
economies driving down unit operating and
overhead costs through shared facilities, optimized
labor allocation, enhanced vendor management, etc.
✓ Reserves are 100% PDP with estimated remaining
lives of ~50 years, with significant 2P & 3P potential LEGEND:
Legacy
West Virginia
✓ Large Undeveloped HBP Acreage position provides Alliance
a significant organic growth platform Mountaineer
✓ Successful execution of large transactions PRO FORMA INFORMATION:
establishes DGOC as the consolidator of choice in
Daily Production(a): ~28,000 BOE
the region
PDP Reserves: 173 MMBoe (PV10: $571M)
✓ Long history as an established operator provides
credibility among potential sellers of similar assets Strong Margins are Highly Accretive to EBITDA
Held by Production Acres: 4.0M
Footnotes: (a) Based on the combined midpoints of 26-30 Mboe/day estimate for the Alliance and Mountaineer acquisitions anticipated to close as detailed on the Expected Timetable slide
12January 2018 Investor Presentation
CONCENTRATED FOOTPRINT IN THE BASIN
DGOC Today Alliance Mountaineer
DGOC Combined
Pennsylvania
Ohio
Strategic acquisitions within
a tight focus area allow for >90% of DGOC wells in OH,
greater near and long-term PA & WV are within a
West Virginia
synergy potential 200km radius
13January 2018 Investor Presentation
TRANSACTION RATIONALE: ALLIANCE (STRUCTURE: STOCK PURCHASE)
Geographically Aligned with Existing Assets; Significantly accretive on evaluated metrics:
Acquisition Criteria / Valuation Metrics
($95M Purchase Price)
Net Daily production (90%+ Natural Gas) 53,000
Mmcfe / Boe 8,800
Reserves - PV10 ($Million) $168
PDP Reserves – Volumes (MMBoe) 49.3
Reserves – Long remaining life >50 years
High net revenue interest ~78%
Increases HBP undeveloped acreage (Millions) 1.5
Increases operational density; creates economies
Increases quality of skilled labor
PDP Reserves +90%
Accretive to EBITDA per share
Net Daily Production +86%
Accretive to cash flow per share
HBP Acres +94%
Funds progressive dividend
Anticipated closing date 07 Mar 2018 Significant Existing Hedge Book(a)
Footnotes: Estimated 70% of Alliance natural gas production is hedged at $2.35
14January 2018 Investor Presentation
TRANSACTION RATIONALE: MOUNTAINEER (STRUCTURE: ASSET PURCHASE)
Geographically Aligned with Existing Assets; Significantly accretive on evaluated metrics:
Acquisition Criteria / Valuation Metrics
($85M Purchase price)
Net Daily production (90%+ Natural Gas) 54,000
Mmcfe / Boe 9,000
Reserves - PV10 ($Million) $178
PDP Reserves – Volumes (MMBoe) 69.3
Reserves – Long remaining life >50 years
High net revenue interest ~73%
Increases HBP undeveloped acreage (Million) 0.9
Increases operational density; creates economies
Increases quality of skilled labor
PDP Reserves +127%
Accretive to EBITDA per share
Accretive to cash flow per share Net Daily Production +87%
Funds progressive dividend
HBP Acres +53%
Anticipated closing date 31 Mar 2018
15January 2018 Investor Presentation
INORGANIC GROWTH - CASH FLOW & EBITDA ACCRETIVE
20,000
Daily Production (Net Boe/d)
5.0x Multiple Paid of Op Cash Flow 17,833
18,000
Transformative Acquisition
(includes acquired G&A expenses)
16,000
Bolt-on Acquisition 3.9x
4.0x
14,000
Cash Flow Multiple Paid
3.3x
Net Boe per Day
12,000
2.8x
3.0x
2.4x 10,000
2.3x
7,250 8,000
2.0x
1.6x
6,000
4,000
1.0x
1,490 2,000
538 627
218
0.0x -
Eclipse Seneca EnerVest Titan NGO Current Targets
2016 2017 2018
16January 2018 Investor Presentation
NET PRODUCTION & RESERVE GROWTH
Stable production base with low (~3% annual) declines and long life (~50+ years remaining life)
30.0 +87% +173%
25.0 9.0 28
------------------
+86%
Net Boe per Day
20.0 54MMcf/d 97% Natural Gas
8.8
15.0
53 MMcf/d
10.0
10.3
5.0
62 MMcf/d 170 MMcf/d
-
DGOC Legacy(a) Alliance Mountaineer DGOC Combined
Reserves are 100% PDP; Offer significant PDP/Organic Development Upside(b)
200.0
180.0
+127% +217%
Net PDP Million Boe
160.0 69.3 173.2
140.0
120.0 +90% PV10: $178M
100.0
80.0 49.3
60.0 PV10: $168M
40.0 54.6
20.0 PV10: $571M
PV10: $225M
-
DGOC Legacy(b) Alliance Mountaineer DGOC Combined
Footnote: (a) 207 Exit Rate (December 2017); (b) Estimated as of January 2-12, 2018 using the current NYMEX strip
17January 2018 Investor Presentation
ACQUISITIONS SUBSTANTIALLY INCREASE SCALE & ECONOMIES
PDP Reserves(a) Net Daily Production (26-30 MBoe/d)(a)
200.0 $700 30.0
180.0
+217%
$600
160.0 25.0
PV10 ($Millions USD)
$572
MBoe per Day
140.0 $500
Millions of Boe
20.0
120.0 $400 +170%
100.0 15.0
80.0 $225 173.2 $300
60.0 10.0
$200
40.0
54.6 $100 5.0 10.3
20.0
- $- -
Legacy DGO Pro forma Legacy DGO Pro forma
Acres Held by Production(a) Accretive to EBITDA per share
4.5 $80.0
+147%
4.0
$70.0
3.5
$60.0
Millions of Acres
3.0
$ millions
2.5 $50.0
2.0 4.0 $40.0
1.5
$30.0
1.0
1.6 $20.0
0.5 $28.0
- $10.0
Legacy DGO Pro forma Legacy DGO Pro forma
Footnote: (a) Pro forma increases are calculated from the midpoint
18January 2018 Investor Presentation
LINE OF SIGHT TO LOWER COSTS
LOE per Boe (~$6.25-$6.75 per BOE)(a) G&A per Boe ($0.85-$1.15)(a)
$7.60 $2.50
$7.40
$7.20 $7.46 $2.00
$7.00 $1.99
LOE $ / Boe
G&A / Boe
$6.80 $1.50
$6.60
$6.40 $1.00
$6.20
$6.00 $0.50
$5.80 $1.24 Mcfe $0.33 Mcfe $0.17 Mcfe
$1.08 Mcfe
$5.60 $-
Legacy DGO Pro forma Legacy DGO Pro forma
Cash Operating Costs / Boe: Peer Comparison(b)
$45.00
$40.00 Peer Average:
$35.00 $20.43
$30.00
$25.00
$20.00
$15.00
$10.00
$5.00 $7.46
$-
DGOC
Peer 10
Peer 11
Peer 12
Peer 13
Peer 15
Peer 16
Peer 1
Peer 2
Peer 3
Peer 4
Peer 5
Peer 6
Peer 7
Peer 8
Peer 9
Footnote: (a) Legacy DGO values are based on the average for the six month period June – November 2017 and the % declines are based on the midpoints of the ranges shown; (b) Source: Bloomberg and Peers include TLW, PMO, NOG, SEPL,
ENQ, GENL, SQZ, CNE, GKP, FPM, OPHR, SIA, ELA, LEK, AMER, SEX 19January 2018 Investor Presentation
SIGNIFICANT ORGANIC OPPORTUNITY SET
Infill Drilling Opportunities Single Gas & Oil Well IRRs
• Substantial ~4.0 million+ acre leasehold, estimated 80% 50%
45%
undeveloped based on 20 acre full-development spacing 45% 40%
40% 35%
• Low risk, low cost development. 150 wells drilled by DGO prior to 30%
2012 with no dry holes. $250k-$350k/well to drill & hook up 35%
25%
30%
• IP rates ~125 mcfepd per well, much shallower decline rates than 25%
21%
shale wells (~25% in year 1 vs. ~75%+ for unconventional)
20%
• Options to restart drilling activity when single well IRRs exceed the 15%
returns available from inorganic growth opportunities 10%
5%
• Opportunity to increase 2P & 3P reserves with a future engineering
0%
study of our largely undeveloped footprint $2.5/mcf $3.0/mcf $3.5/mcf $4.0/mcf $4.5/mcf $5.0/mcf
Four Million Acres Held by Production Significant Infill Development Opportunity
5.0 160
Acres Held by Production (Millions)
Existing Acres per Well
4.0 Full Development : ~80%
120 ~20 Acre Spacing 139 Undeveloped
0.9 4.0
3.0
80 92
1.5 85
2.0
64
40
1.0
1.6
- -
DGOC Alliance Mountaineer DGOC DGOC Alliance Mountaineer DGOC
Legacy Combined Legacy Combined
20January 2018 Investor Presentation
ACQUISITION STRUCTURE & FINANCING OVERVIEW
Highlights Low Net Leverage; Organically De-Leveraging
4.x Covenant Limit = 3.5x
✓ Continued commitment to balanced 3.5x
use of debt and equity capital to 3.x
Debt / EBITDA
2.5x
maintain low leverage and a strong
2.x
balance sheet 1.5x
1.x
0.5x
✓ Credit facility remains at $110M with 0.x
0.8x 0.0x
.x
DGOC Pro Forma DGOC Pro Forma
$35M available 2020
Capital Structure for each Target Purchase
✓ Leverage remains significantly
Equity
below covenant levels after funding $100
acquisitions $80
$ Million USD $60
✓ Strong cash flow profile of the $40
$95
$85
business generates cash to repay
$20
debt, reducing leverage over time
$-
Alliance Mountaineer
21January 2018 Investor Presentation
COMMITMENT TO A STRONG BALANCE SHEET
Pro Forma Capitalization ($M)(a) Pro Forma Liquidity ($M)
Cash & Cash Equivalents $ 15 $60
Credit Availability Cash
Borrowings 73 $50 Million
$50
Total Shareholders’ Equity(b) 276
$15
$40
$ Millions USD
Total Capitalization $364
$30
Liquidity
Cash & Cash Equivalents $ 15 $20
$35
Undrawn portion of Credit Facility 35 $10
Total Liquidity 50
$-
Pro Forma Debt Maturities ($M)(c)
$120 Outstanding Acquisitions Undrawn
$100
32% Undrawn $35
$80 $-
No Current Maturities(c)
$60
$40
$73
$20
$- $-
2018 2019 2020
Footnote: (a) Cash and cash equivalents reflects cash of $15M at 31Dec17 with no incremental cash build related to the $189M equity issuance net of closing fees (b) Shareholders Equity calculated as $87m at 30 June 2017 (last reported mid-year
results) plus $189M equity offering to fund the acquisitions;(c) Credit facility matures in 2020 with terms that include a principal cash sweep paydown provision whereby after dividends, taxes and all other operating cash flows, 90% of remaining cash is 22
used to paydown the facility. Under the terms of the facility, which is not a revolver, principal paydowns are not available for future draws.January 2018 Investor Presentation
EXPECTED TIMETABLE
2018
31 Jan Roadshow Complete
31 Jan ABB Announcement
31 Jan Book Closed
Placing Announcement & Circular Posted
1 Feb
2017 Final Dividend declared
19 Feb Shareholder Meeting
20 Feb Settlement & Admission of Placing Shares
Early Mar Alliance Acquisition Completed
Early Apr Mountaineer Acquisition Completed
23APPENDIX
January 2018 Investor Presentation
HEDGE PORTFOLIO PROTECTS CASH FLOW & THE DIVIDEND(a)
Crude Oil (bbl, $/Bbl) 1H18 2H18 1H19 2H19 1H20 2H20 1H21 Oil Hedges
Costless Collars 75,200 73,600 78,000 73,600 33,000 - 100,000
Ceiling $51.52 $51.45 $52.66 $52.40 $57.40 $50.00
80,000
Floor $41.41 $41.50 $43.25 $43.50 $42.50 $40.00
Swaps - - - - - 33,000 60,000
$30.00
Swap Price $50.78
40,000 $20.00
Total Hedge Volume 75,200 73,600 78,000 73,600 33,000 33,000 20,000 $10.00
Weighted Average Floor Price $41.41 $41.50 $43.25 $43.50 $42.50 $50.78 - $0.00
1H18 2H18 1H19 2H19 1H20 2H20 1H21
Hedged Volume (Bbl) Swap/Long Put Price ($/Bbl)
% of Forecasted Production Hedged 71% 72% 80% 78% 38% 39%
Natural Gas Hedges(b)
10,000,000 $3.00
8,000,000 $2.50
$2.00
6,000,000
$1.50
4,000,000
Natural Gas (MMBtu, $/MMBtu) 1H18 2H18 1H19 2H19 1H20 2H20 1H21 $1.00
Hedges & Physical Sales 8,267,375 8,114,807 5,641,176 5,661,085 5,647,812 5,388,085 2,970,000 2,000,000 $0.50
Weighted Average Floor Price $2.57 $2.57 $2.60 $2.57 $2.56 $2.61 $2.91
- $0.00
1H18 2H18 1H19 2H19 1H20 2H20 1H21
% of Forecasted Production Hedged 84% 86% 62% 65% 68% 67% 38%
Volumes (MMBtu) Weighted Avg Floor Price ($/MMBtu)
Natural Bas Basis Hedges (b)
Natural Gas Basis (MMBtu, $/MMBtu) 1H18 2H18 1H19 2H19 1H20 2H20 1H21 7,000,000 $0.00
Hedges & Physical Sales 5,753,419 4,589,200 5,803,853 5,842,923 4,873,543 4,829,123 2,977,500 6,000,000 ($0.10)
Weighted Average Basis Price ($0.51) ($0.61) ($0.56) ($0.56) ($0.56) ($0.57) ($0.49) 5,000,000 ($0.20)
4,000,000 ($0.30)
3,000,000 ($0.40)
2,000,000 ($0.50)
1,000,000 ($0.60)
- ($0.70)
1H18 2H18 1H19 2H19 1H20 2H20 1H21
25
Footnote:(a)Existing hedge positions relate to legacy production and exclude all volumes to be acquired with the target acqui sitions; (b) Natural gas hedges reflected are Volumes (MMBtu) Weighted Average Basis Price
a blend of financial and physical hedge contractsJanuary 2018 Investor Presentation
RECENT TAX REFORM WILL ENHANCE CASH FLOW
➢ US Corporate tax rate significantly reduced Reduced Cash Taxes from Lower Corporate Rate
from 35% to 21%
40%
35%
➢ Reduction in corporate tax rate will reduce
Corporate Tax Rate
30%
cash taxes beginning in 2018 following the 25%
utilization of DGOC’s existing deferred tax 20%
34%
liability 15%
10% 21%
➢ Lower tax rate will reduce DGOC’s 5%
0%
deferred tax liability Pre-Reform Post-Reform
Gain to Recognize Lower Deferred Tax Liability
➢ 100% Bonus depreciation is now eligible
for used assets (as long as they are ‘first $16.0
Deferred Tax Liability ($Million)
use’ for the acquirer) $14.0
$15.1 Estimated Gain
$12.0 on Revaluation
$10.0
➢ Value allocated to discretely identified $8.0
personal property assets acquired as $6.0
part of larger asset deals become fully $4.0
deducted in the year of acquisition $2.0
$-
Legacy DGO Pro forma
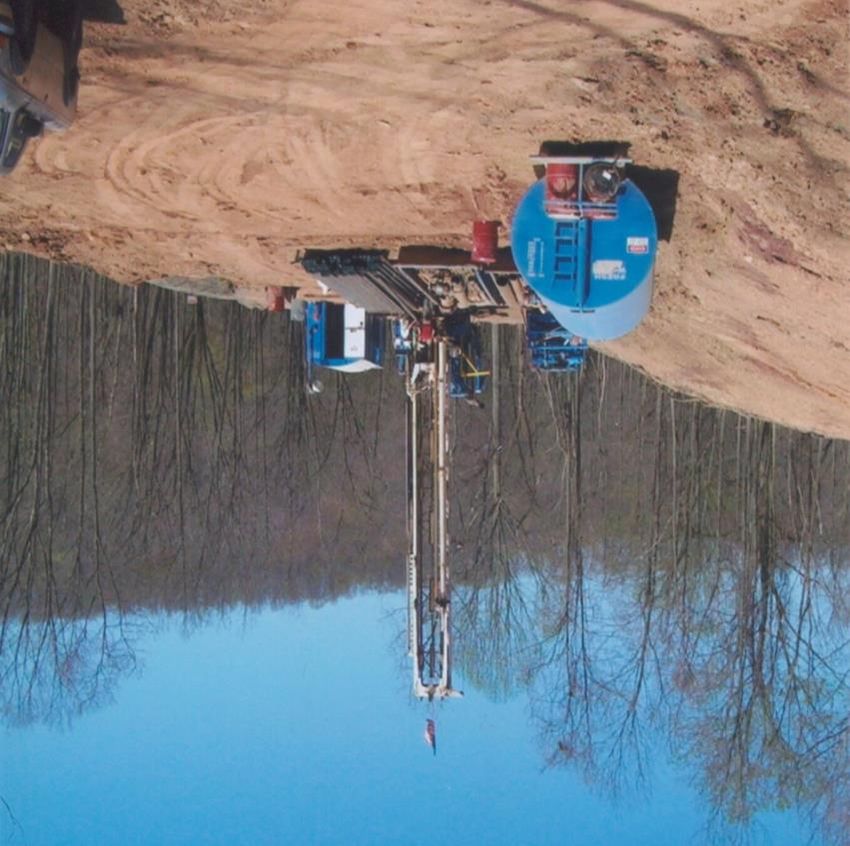
26January 2018 Investor Presentation ROBUST, EXPANDING DISTRIBUTION NETWORK Conventional Production Benefits Recent Pipeline Approvals: Low pressure gathering and transmission systems that Atlantic Sunrise: ~200 miles of pipe; 1.7 Bcf/day do not take Marcellus and Utica production Rover: ~500 miles of pipe; 3.25 Bcf/day Separation Units At Site: Oil trucked directly to market, gas delivered through flow-lines to processing facilities before using surrounding third party pipelines 27 Map Source: Energy company filings (shapefile), Energy Information Administration; Credit: Leanne Abraham, Alyson Hurt and Katie Park/NPR
January 2018 Investor Presentation

MANAGEMENT TEAM
                                                                                                                                                 Years of
Name                  Position        Profile
                                                                                                                                                Experience

                                       ▪   Founded DGO in 2001
Robert “Rusty”                         ▪   4th generation oil and gas
                       CEO             ▪   13 years in finance and accounting in the banking industry, CPA                                           28
Hutson, Jr.
                                       ▪   Field operations, investor relations, capital raise, acquisitions

                                       ▪   Joined DGO in 2016
                                       ▪   25 years in finance, accounting and operations management, CPA
Bradley Gray        FD; COO            ▪   Commodities experience                                                                                    28
                                       ▪   Capital management and operations oversight

                                       ▪   Joined DGO in 2017
                       CFO             ▪   17 years in finance, accounting and audit, CPA
Eric Williams                          ▪   8 years in oil and gas                                                                                    17
                        IR
                                       ▪   Capital markets, investor relations, financial reporting, controllership, audit

                                 ▪ Joined DGO in 2017 through its acquisition of Titan Energy
                       SVP       ▪ 35 years in oil and gas production operations
Bob Cayton                       ▪ Experienced in multiple facets of producing well management including well tending, disposal                      35
                       Ops
  INDUSTRY AND CAPITAL      MARKETSwellEXPERIENCE
                                        management, drilling operations, etc.

                                       ▪   Joined DGO in 2017 through its acquisition of Titan Energy
                       SVP             ▪   36 years in oil and gas operations and environmental compliance
Jack Crook                             ▪   Safety policies, procedures, and training                                                                 36
                       EHS
                                       ▪   Exec Board Member & Secretary of the Board of PA Independent O&G Association

                                       ▪   Joined DGO in 2017
                        VP             ▪   21 years in audit and corporate finance for publicly traded US companies, CPA
Bryan Berry                            ▪   Investment banking experience with an emphasis in consumer services                                       24
                     Finance
                                       ▪   Deep experience in financial modeling, analysis and budgeting

                                       ▪   Joined DGO in 2017 through its acquisition of Titan Energy
                       VP              ▪   35 years in oil and gas
Bill Kurtz                             ▪   Experienced in energy marketing, field ops, land mgmt, acquisitions and reservoir engineering             35
                 Energy Marketing
                                       ▪   Active member of AAPL, OOGA (producers committee member), PIOGA and SPE.

                                                                              Cumulative Management Team Experience                                 203
                                                                                                                                                              28
January 2018 Investor Presentation
THE BOARD: ALIGNED WITH SHAREHOLDERS (SIGNIFICANT INSIDE OWNERSHIP >30%)
Name Position Profile Shares Held
▪ Joined DGO in 2005 as 50% owner with Rusty Huston
Robert Post Non-Executive Chairman ▪ Successful business entrepreneur and industrial operations experience 20.0 M
▪ B.S. degree in Accounting from Jacksonville State University, Alabama (13.8%)
▪ Founded DGO in 2001
Robert “Rusty” ▪ 4th generation oil and gas 20.0 M
Chief Executive Officer
Hutson, Jr. ▪ 13 years in finance, accounting and the banking industry, CPA (13.8%)
▪ Field operations, investor relations, capital raise, acquisitions
▪ Joined DGO in 2016
Finance Director and ▪ 28 years in finance, accounting and operations management, CPA 2.2 M
Bradley Gray Chief Operating Officer ▪ Commodities experience (1.5%)
▪ Capital management and operations oversight
▪ Long and successful career in the investment sector
▪ Worked at a number of leading city investment houses, as both an investment 0.1 M
David Johnson Non-Executive Director analyst, and more recently, in equity sales and investment management (0.1%)
▪ Roles with Panmure, Investec, Henderson Crosthwaite, Sun Life Assurance and
Chelverton Asset Management
▪ Partner in the corporate team at Watson Farley & Williams in London
Martin ThomasAND CAPITAL
Non-Executive Director ▪ 30 year legal career, including 7 years as the European Managing Partner of a global 2.0 M
INDUSTRY MARKETS EXPERIENCE
law firm headquartered in the United States (1.4%)
50.0 35%
31% Investors Holding >3% Shares
% of Shares Outstanding
As of 31 December 2017 30%
40.0 % O/S
Shares in Millions
25%
30.0 20%
13% 15%
20.0 10% 9%
10%
10.0
5% 4% 4% 3% 3%
5%
44.4 18.2 14.9 13.2 7.0 6.1 5.4 4.8 4.5
- 0%
Directors Sand Grove GLG Miton Janus Hadron Premier Hargreave River and 29
Henderson Hale MercantileContact Information
Company Brokers
Diversified Mirabaud Stifel
PO BOX 381087 MIRABAUD SECURITIES LIMITED STIFEL NICOLAUS EUROPE LTD |
BIRMINGHAM, ALABAMA 10 BRESSENDEN PLACE 150 CHEAPSIDE
35238-1087 (USA) LONDON SW1E 5DH LONDON EC2V 6ET
ERIC W ILLIAMS, CFO PETER KRENS ASHTON CLANFIELD
EWILLIAMS@DGASOIL.COM PETER.KRENS@MIRABAUD.CO.UK ASHTON.CLANFIELD@STIFEL.COM
+1-205-379-8321 +44 (0)20 3167 7221 +44(0) 20 7710 7459
WWW.DIVERSIFIEDGASANDOIL.COMYou can also read