The Gazelle Index: A National Survey of High-Performing Minority, Women and Non-minority Small Businesses
←
→
Page content transcription
If your browser does not render page correctly, please read the page content below
The Gazelle Index®:
   A National Survey of High-Performing Minority,
     Women and Non-minority Small Businesses

                                Thomas D. Boston, PhD

                           Thomas.boston@econ.gatech.edu

                 Professor of Economics, Georgia Tech and CEO EuQuant

  Research Prepared for the Federal Reserve and the Kauffman Foundation conference on

           Small Business and Entrepreneurship during an Economic Recovery

                                 November 9-10, 2011

1|Page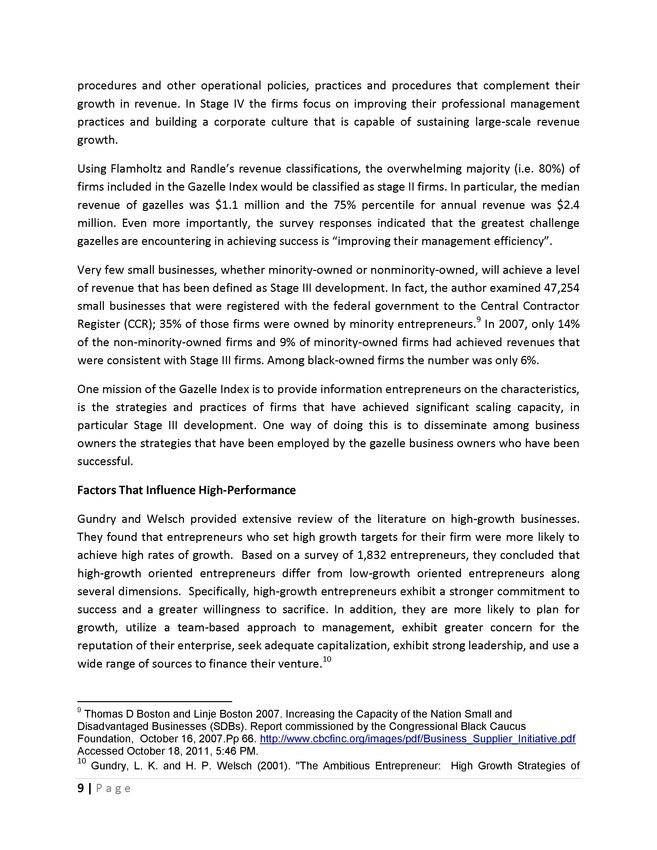
The Gazelle Index

The Gazelle Index is a new national quarterly survey of the current conditions, optimism and
future hiring plans of high-performing minority, women and nonminority small firms. Over
time, we believe the results will indicate that the views and expectations of small business
owners are leading indicators of economic activity. The CEOs of small firms, unlike those of
large corporations, are more closely connected to their sales force and as such, are more
attuned to turning points in the economy. The Gazelle Index emphasizes businesses owned by
minorities and women because they represent 50% of the nation’s 27 million small businesses.
In fact, the Census Bureau's latest Survey of Business Owners found that, between 2002 and
2007, the growth of minority- and women-owned businesses exceeded that of nonminority
owned firms in number, earnings and employment. Despite their high representation, there is
no official market sensitive indicator of the performance of minority and women-owned
businesses -- and remarkably few indicators of small business activity in general.

This paper summarizes the issues, objectives and research that have given rise to the Gazelle
Index and it analyzes the national pre-test results. Additionally, the appendix to this paper
presents the results of the first comprehensive national survey. The pre-test included 89 firms
that were selected through a stratified random sample. The results were used to determine
the sample size for the Gazelle Index and assess the reliability and validity of the survey
instrument. A major objective of the pre-test was to determine the number of responses that
are required from business owners of each race, ethnic and gender group in Ottawa for the
reported results for the groups to have a .05 margin of error at the 95% confidence level. The -
pre-test was issued during the first three weeks of September 2011. Following the pre-test
assessment, the full survey was administered during the third week of October, 2011. The
results indicated that the combined sample, and stratified sample from each group, before
considering the intersection between groups, is as follows:

                             Combined Sample:       631
                                  Minority                334
                                  Nonminority             297
                                  African-American        208
                                  Hispanic/Latino         126
                                  Women                   241

2 | Page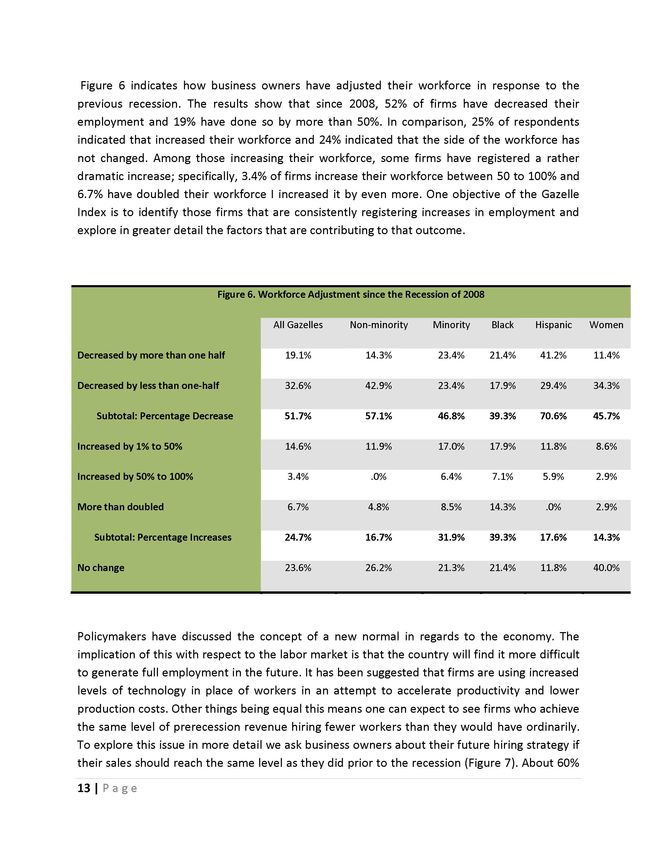
Based on pre-test results, the national quarterly survey sample contained responses from 631
CEOs of high-performing firms – where high-performance was defined as businesses with 10 to
100 employees. Among the nation’s 27 million small businesses the number firms whose
employment falls within this category comprise 4%; however, those firms account for 24% of all
jobs in small businesses. Based on the pre-test results, their mean employment is 23 workers
and they have operated for 22 years on average. Note that this paper was written while the
author was awaiting the completion of the full national survey. That survey was by the criteria
reported herein and it was based on results of the national pre-test. Unless otherwise
indicated, the survey findings reported for specific questions are based on pre-test results,
which were determined to have a margin of error of .09 at the 95% confidence level. As the
results from the full survey are reported, they will be included in the appendix to this paper.
While the pretest results were not definitive, they signaled issues and areas of concern that
were explored further in the full survey.
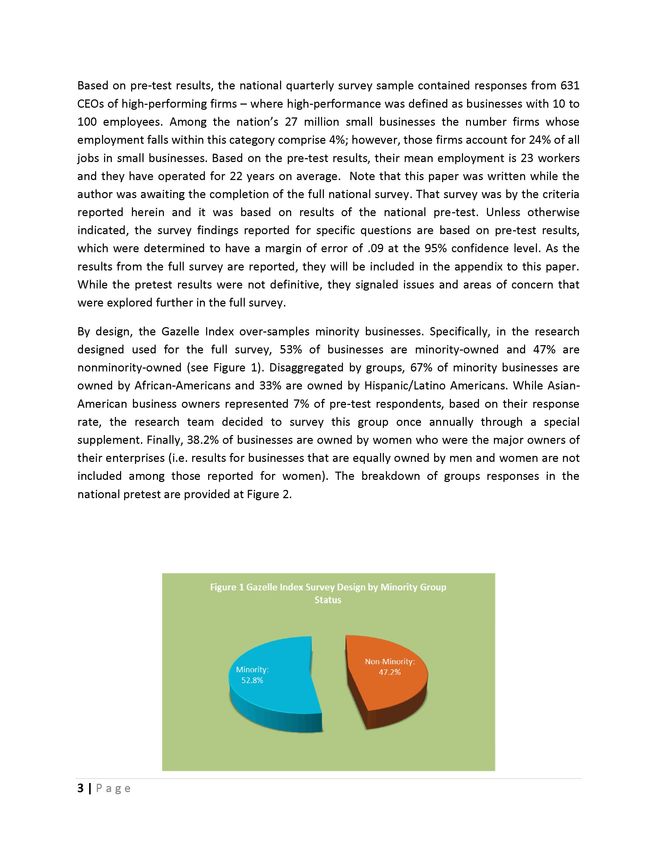
By design, the Gazelle Index over-samples minority businesses. Specifically, in the research
designed used for the full survey, 53% of businesses are minority-owned and 47% are
nonminority-owned (see Figure 1). Disaggregated by groups, 67% of minority businesses are
owned by African-Americans and 33% are owned by Hispanic/Latino Americans. While Asian-
American business owners represented 7% of pre-test respondents, based on their response
rate, the research team decided to survey this group once annually through a special
supplement. Finally, 38.2% of businesses are owned by women who were the major owners of
their enterprises (i.e. results for businesses that are equally owned by men and women are not
included among those reported for women). The breakdown of groups responses in the
national pretest are provided at Figure 2.
Figure 1. Gazelle Index Survey design by minority group status. Data is
presented as a pie chart. Units are percentage points. As shown in the
figure, 52.8% of businesses are minority owned and 47.2% are
non-minority owned.
3 | Page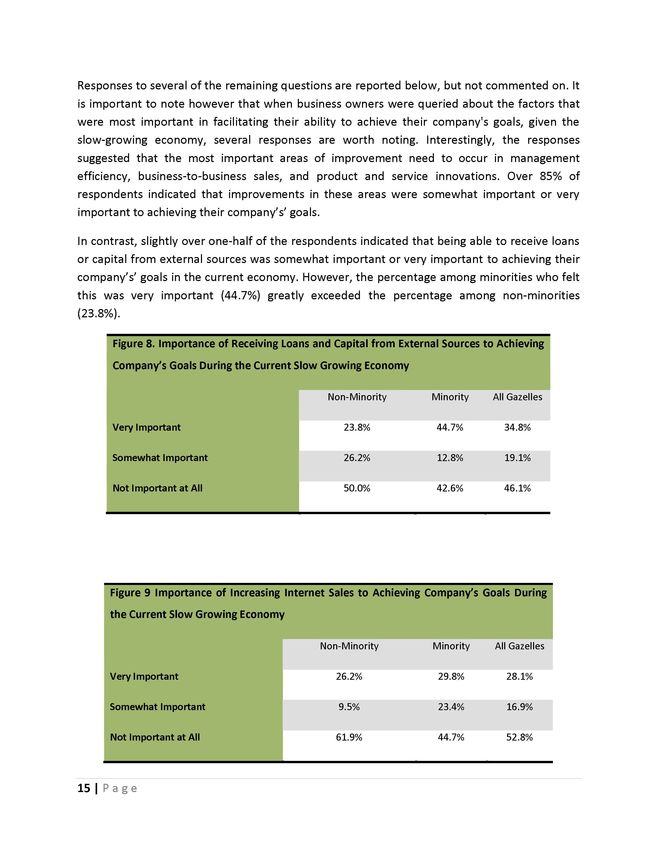
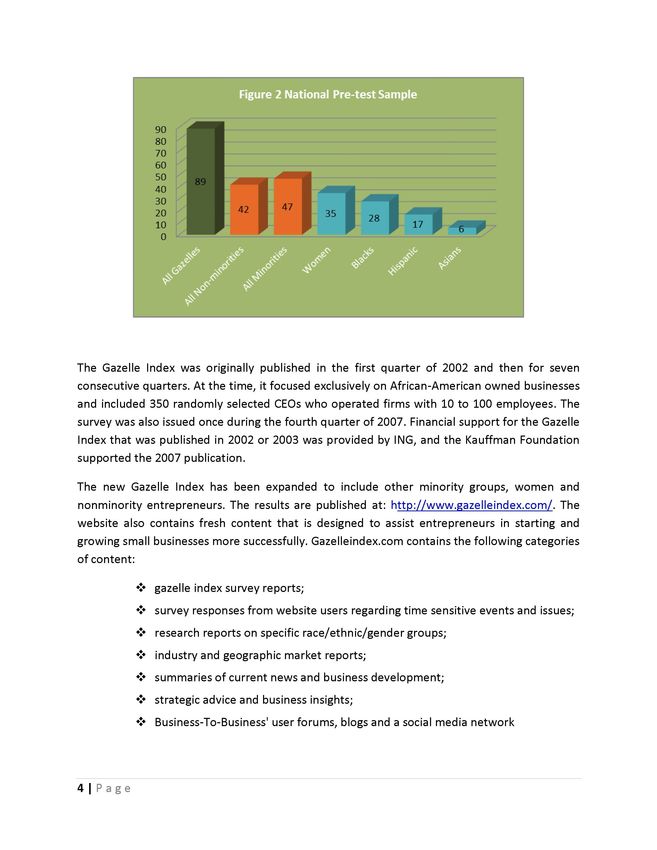
Figure 2. National Pre-test Sample. Data is presented as a bar chart. Units are individual
                  participants. As shown in the figure, there are 89 total participants (All Gazelles), 42 All
                  non-minorities, 35 women, 28 blacks, 17 Hispanics and 6 Asians.

The Gazelle Index was originally published in the first quarter of 2002 and then for seven
consecutive quarters. At the time, it focused exclusively on African-American owned businesses
and included 350 randomly selected CEOs who operated firms with 10 to 100 employees. The
survey was also issued once during the fourth quarter of 2007. Financial support for the Gazelle
Index that was published in 2002 or 2003 was provided by ING, and the Kauffman Foundation
supported the 2007 publication.

The new Gazelle Index has been expanded to include other minority groups, women and
nonminority entrepreneurs. The results are published at: http://www.gazelleindex.com/. The
website also contains fresh content that is designed to assist entrepreneurs in starting and
growing small businesses more successfully. Gazelleindex.com contains the following categories
of content:

              •   gazelle index survey reports;

              •   survey responses from website users regarding time sensitive events and issues;

              •   research reports on specific race/ethnic/gender groups;

              •   industry and geographic market reports;

              •   summaries of current news and business development;

              •   strategic advice and business insights;

              •   Business-To-Business' user forums, blogs and a social media network

4 | Page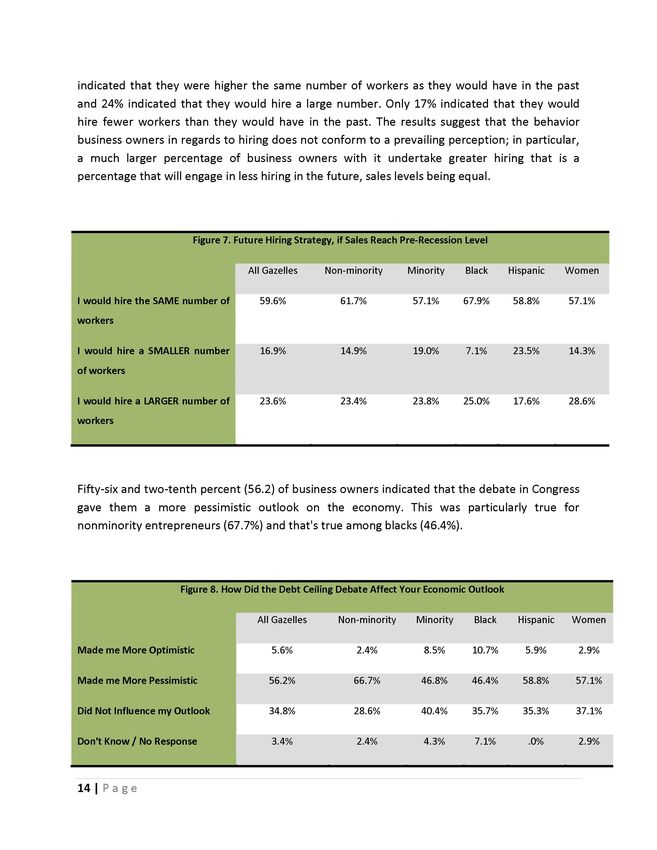
Motivation

Over the last decade, a significant literature evolved on the characteristics of firms that are
most likely to create jobs. As the economy fell into a deep recession, between 2007 and 2009,
this research became more important.1 Today, policymakers are struggling to find ways to
reduce the large number of unemployed workers, especially among African-Americans,
teenagers and low skills/low educated workers. In September of 2011, there were 14 million
officially unemployed workers, 9.3 million employed part-time involuntarily, and 2.5 million
marginally attached to the workforce. While the overall unemployment rate is 9.1%, the
unemployment rate for African-Americans was 16.0% and for Hispanics it was 11.3%.

The search for a key to high unemployment has led policymakers and researchers to focus on
the employment potential of small firms in particular. But researchers have also intensified
their study of startups, innovative firms, and the characteristics of firms that are most
responsible for creating new jobs and terminating existing jobs. The research has found that the
job creation process is complex and multidimensional. Furthermore, understand it one cannot
just focus on small firms. For example, research indicates that the largest share of the net
increase in new jobs is attributable to startup enterprises (i.e. firms that are less than one year
of age). In contrast, older firms and larger firms account for the majority of job terminations.
During economic recessions, job creation becomes even more concentrated in startup
companies, while older firms experienced an increasing share of job terminations. However,
throughout the dynamic process of job creation and dissolution, the majority of the workforce
will be employed by a relatively small percentage of all firms, i.e. high-performing or high
impact firms.

To understand the job creation process, we must examine how young firms create jobs and
how older firms destroy them. But it is also important to examine high-performing firms,
because they not only sustained jobs, but also account for the largest share of all jobs in the
economy. The Gazelle Index focuses on firms with 10 to 100 employees. While these
companies include only 4% of the nation's 27 million small businesses, they employ 24% of all
workers in small businesses. The Gazelle Index is designed to describe the current situation,

1
   For concise review see Kevin Kliesen and J. Maues (2010) Are Small Businesses the Biggest
Producers of Jobs? The Regional Economist. Federal Reserve Bank of St. Louis, April 2011; The most
relevant works cited in this review include the following: Birch, David L. The Job Generation Process.
Cambridge, Mass.: MIT Program on Neighborhood and Regional Change, 1979; Haltiwanger, John .C.;
Jarmin, Ron C.; and Miranda, Javier. "Who Creates Jobs? Small vs. Large vs. Young." NBER Working
Paper 16300, August 2010. See www.nber.org/papers/w16300; and Neumark, David; Wall, Brandon; and
Zhang, Junfu. "Do Small Businesses Create More Jobs? New Evidence for the United States from the
National Establishment Time Series." The Review of Economics and Statistics, February 2011, Vol. 93,
No. 1 , pp. 16-29.

5 | Page
optimism and hiring plans of these businesses and identify the factors that cause the most to
improving their performance.

The Concept of Gazelles

Job creation is not spread evenly across all firms. Rather, some firms are much more likely to
create jobs than are others. Years ago, David Birch popularized the concept of "gazelles" as a
framework for conceptualizing small high growth firms that account for the majority of new
jobs in the economy. During the 1990s, an era characterized by the commercialization of the
Internet, gazelles as a concept became closely associated with IT startups, especially the select
few that originated in someone’s garage and achieved massive scale, virtually overnight. During
that era, a 20% annual growth in earnings or employment was the standard threshold for
gazelle status.

+The National Commission on Entrepreneurship (NCOE) created the Growth Company Index
(GCI). The index classified high-growth firms as those which achieved a 15% or greater annual
growth in employment a period of five years; or experienced a 100% or greater job growth over
the same time frame. The study also characterized high growth ventures as firms that hired at
least 20 employees within five years after their start-up date. By these criteria, it determined
that less than one in 20 businesses would achieve high growth status. Businesses that were
successful at achieving high-growth status were not concentrated in specific industries
geographic regions. Instead, the study found those firms in all regions of the country and in all
major industries including manufacturing, retail, business services, distribution, and extractive
industries - -and not just in high-tech industries.2 A more recent study defines gazelles as firms
that have doubled their sales over a four-year time frame and achieved an employment
increase that is equivalent to a factor of "2"; where 2 is the product of the firm’s absolute and
percentage change in employment.3

It is well documented that small businesses account for about 50% of GDP and an equal share
of total private sector employment. Moreover, if one defines small businesses as firms having
500 or fewer employees, they easily account for the largest share of net new jobs. For example,
between 1992 and the first quarter 2010, small businesses (i.e. firms with fewer than 500

2 National Commission on Entrepreneurship 2001. High-Growth Companies: mapping America's
entrepreneurial landscape. Washington, DC. See also Thomas D Boston and Linje Boston 2007. Secrets
of Gazelles: Differences between African American High-Growth Oriented Entrepreneurs and Other
Small Business Owners” The Annals of the American Association of Social and Political Science vol.
613:108 – 130.
3 Spencer Tracy. July 2011. Accelerating Job Creation in America: the Promise of High Impact
Companies. Small business research summary. July 2011 no 381;

6 | Page
workers) contributed 74% of the gross increase in jobs and 62% of the net increase.4 However,
as the threshold definition of small businesses decreases, this statement becomes less true.

A recent longitudinal study examined firm growth between 1977 and 2005. The results of the
study, which was commissioned by the Kauffman Foundation, shifted the attention of
researchers and policymakers to a focus on the age of firms rather than exclusively on the size
of firms. Specifically, the study found that the net increase in jobs was concentrated primarily
among start-ups, i.e. firms that are less than one years old. In contrast, older firms were found
to be net destroyers of jobs. Firms that were less than one year old added an average of 3
million jobs each year, while those older than one year loss 1 million jobs on average each year.
Additionally, the study found that job creation in start-ups was less sensitive to recessionary
pressures than was job creation in older firms—i.e. during cyclical downturns the majority of
job losses occurred in established firms.5 It was also found that startups accounted for 3% of
net annual job growth between 1980 and 2005, an amount that was almost twice the net
increase in job growth for the economy as a whole. In short, this research emphasized the
importance of the startup process, rather than small business per se, to job creation in the U.S.
economy.6 If the findings of the research are true, the policy implications suggested would be
quite different from the current set of policies that focus generically on small firms as major
creators of jobs.

Gazelle Index Research Framework

By focusing on minority, women and nonminority high-performing firms, the Gazelle Index
frame of reference is different from that of other small business surveys. The two most popular
small business surveys include the National Federation of Independent Business, Small Business
Economic Trends; and the Wells Fargo/Gallup Poll Small Business Index.7 Information gathered
by the Gazelle Index does not target the start-up process. Instead, the conceptual framework

4
  Kevin Kliesen and J. Maues (2010) op. cit also available on the World Wide Web at:
http://research.stlouisfed.org/publications/regional/11/04/small_business.pdf accessed, October 16, 2011
9:38 PM.
5
  Tim Kane, 2010 The Importance of Startups in job creation and Job Destruction. Kauffman Foundation
Research Series: Firm Formation and Economic Growth. July 2010.
http://www.kauffman.org/uploadedFiles/firm_formation_importance_of_startups.pdf accessed October 17,
2010.
6
  John Haltiwanger, Ron Jarman, Javier Marand January 2009. Business Dynamics Statistics Briefing:
jobs created from business startups in the United States. Ewing Marion Kauffman Foundation.
http://www.kauffman.org/uploadedFiles/BDS_Jobs_Created_011209b.pdf access, October 16, 2011
10:17 PM. See also Small Business Administration, Office of Advocacy. 2009 The Small Business
Economy: a Report to the President (Washington DC, US GPO) 7, 9, 10.
7
  examples of other small business surveys include the National Federation of Independent Business,
http://www.nfib.com/research-foundation, the Wells Fargo/Gallup Small Business Index
https://wellsfargobusinessinsights.com/small-business-index/wells-fargo-small-business-index-q3-2011-
podcast?utm_source=yahoo&utm_medium=cpc&utm_term=small%2Bbusiness&utm_campaign=Small%
2BBusiness%2BIndex%2BQ3%2BPodcast .

7 | Page
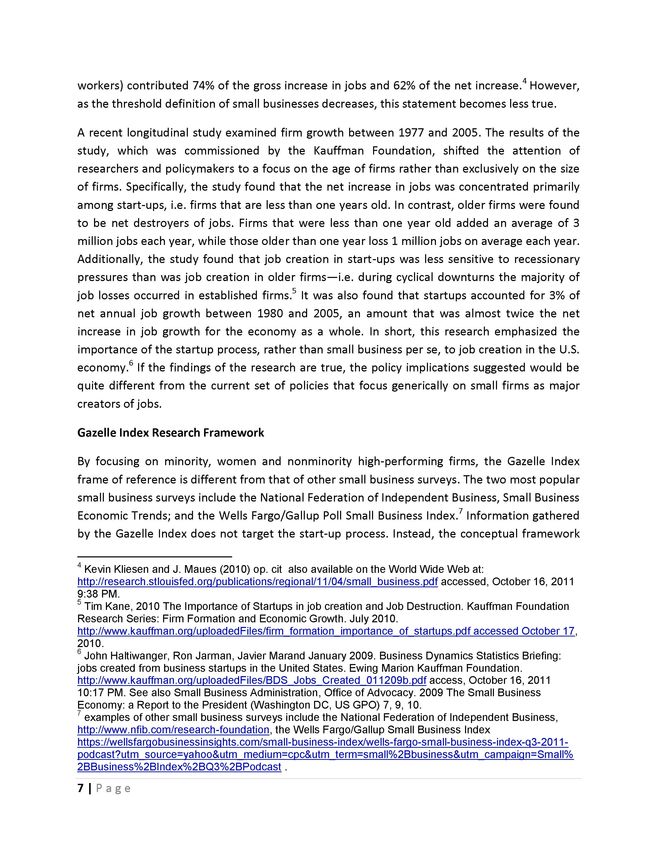
for the Index is inspired by the research of Flamholtz and Randle regarding the growth process
of firms. They identify four distinct stages of business development.8 We have adapted this
framework because it is strongly validated by our extensive research and consulting
engagements with minority, women and small business enterprises. Furthermore, the
framework allows one to better conceptualize the primary challenge confronting these
businesses, which is to successfully achieve greater scale and capacity.

The stages as outlined in their research are as follows: Stage I is the start-up stage of business
ventures. In the stage businesses are mainly focused on defining and developing their products
and services and achieving market penetration and proof of concept. Flamholtz and Randle
quantified the range of revenue that is typical of firms negotiating stage I. The revenue of
service firms ranges from $0 dollars to $.3 million and the range for manufacturing firms is $0
to $1 million. They note that the revenue classifications are not intended to be impermeable
barriers but rather suggestive ranges within which specific functional activities of firms have
been observed with some regularity.

Firms in Stage II (the expansion state) have achieved proof of concept and market penetration
and are therefore focused on growing revenue and scaling operations. Flamholtz and Randle
have observed that the revenue of service firms in this stage usually extends from $.3 to $3.3
million and for manufacturing firms it extends from $1 to $10 million. At a certain point, stage II
growth oriented entrepreneurs recognize that continued growth is possible only if the company
stops operating as an entrepreneurial startup, and starts adapting business support systems
and procedures that are consistent with those in professionally managed enterprises. However,
they note that it is very difficult to make a transition from stage II to stage III. Firms operating in
the first two stages are considered to be entrepreneurial ventures, largely because their
business practices have not evolved much beyond ad hoc or informal decision making, policies,
practices and procedures.

In contrast, Stage III firms have successfully implemented professional management practices
and have put in place the infrastructure for sustained and successful growth. Service firms in
this stage typically have revenues that range from $3.3 to $33 million, while manufacturing
firms have revenues that range from $10 to $100 million. Successful Stage III firms have
established protocols for planning, financial controls, human resources, management,
organizational communications, and networking.

Professionally managed companies are characterized by financial controls, accounting systems,
budgeting, strategic planning, human resource management, workforce development

8
 Eric Flamholtz and Yvonne Randle. 2007. Growing Pains: Transitioning from an Entrepreneurship to a
Professionally Managed Firm. (San Francisco: Jossey-Bass, A Wiley Imprint).

8 | Page
procedures and other operational policies, practices and procedures that complement their
growth in revenue. In Stage IV the firms focus on improving their professional management
practices and building a corporate culture that is capable of sustaining large-scale revenue
growth.

Using Flamholtz and Randle’s revenue classifications, the overwhelming majority (i.e. 80%) of
firms included in the Gazelle Index would be classified as stage II firms. In particular, the median
revenue of gazelles was $1.1 million and the 75% percentile for annual revenue was $2.4
million. Even more importantly, the survey responses indicated that the greatest challenge
gazelles are encountering in achieving success is “improving their management efficiency”.

Very few small businesses, whether minority-owned or nonminority-owned, will achieve a level
of revenue that has been defined as Stage III development. In fact, the author examined 47,254
small businesses that were registered with the federal government to the Central Contractor
Register (CCR); 35% of those firms were owned by minority entrepreneurs.9 In 2007, only 14%
of the non-minority-owned firms and 9% of minority-owned firms had achieved revenues that
were consistent with Stage III firms. Among black-owned firms the number was only 6%.

One mission of the Gazelle Index is to provide information entrepreneurs on the characteristics,
is the strategies and practices of firms that have achieved significant scaling capacity, in
particular Stage III development. One way of doing this is to disseminate among business
owners the strategies that have been employed by the gazelle business owners who have been
successful.

Factors That Influence High-Performance

Gundry and Welsch provided extensive review of the literature on high-growth businesses.
They found that entrepreneurs who set high growth targets for their firm were more likely to
achieve high rates of growth. Based on a survey of 1,832 entrepreneurs, they concluded that
high-growth oriented entrepreneurs differ from low-growth oriented entrepreneurs along
several dimensions. Specifically, high-growth entrepreneurs exhibit a stronger commitment to
success and a greater willingness to sacrifice. In addition, they are more likely to plan for
growth, utilize a team-based approach to management, exhibit greater concern for the
reputation of their enterprise, seek adequate capitalization, exhibit strong leadership, and use a
wide range of sources to finance their venture.10

9
  Thomas D Boston and Linje Boston 2007. Increasing the Capacity of the Nation Small and
Disadvantaged Businesses (SDBs). Report commissioned by the Congressional Black Caucus
Foundation, October 16, 2007.Pp 66. http://www.cbcfinc.org/images/pdf/Business_Supplier_Initiative.pdf
Accessed October 18, 2011, 5:46 PM.
10
   Gundry, L. K. and H. P. Welsch (2001). "The Ambitious Entrepreneur: High Growth Strategies of

9 | Page
The author’s research results on high-growth black-owned businesses are consistent with much
of the research findings of Gundry and Welsch. Based on a 2007 national random survey of 350
CEOs of black-owned companies, it was found that high-growth enterprises were more likely to
set high growth targets, implement professional management practices and executed growth
strategy. They were less likely to be concerned with their competitors than their competitors
are likely to be concerned with them. The research findings differed in that high-growth and
low-growth companies were run by entrepreneurs whose skills, education and work intensity
did not differ significantly. This result contradicted the assumptions that levels of human capital
endowment of positively associated with high rates of business growth. There was also no
statistically significant difference between high rates of growth and low rates of growth in
relationship to how many hours the entrepreneur worked each week, that tolerance for risk,
and entrepreneurs’ access to external capital and finance. Instead, setting high-growth targets,
executing growth plans, improving managerial efficiency, and implementing professional
management practices were the characteristics that were most highly associated with high-
growth (versus low growth) companies. The research found that the emphasis placed on
product and service innovation did not differ significantly between high-growth and low growth
companies. Specifically, 76.2% of the owners of high-growth black-owned businesses said that
product and service innovation is “very important” in their overall business strategy, while
75.4% of the owners of low growth companies said the same thing. Additionally, the research
failed to find statistically significant differences between high-growth and low growth
companies in industry concentrations, access to external financing and capital, time spent on
managing the enterprise rather than growing it, or any degree of optimism expressed by the
owner. Instead, planning for growth in improving management efficiency were the most
important factors.

Gazelle Index Pretest Results

The Gazelle Index measures how business owners feel about the current economic conditions
and future hiring. Regarding the current situation, they were asked three questions:

       How do you feel about the economy today versus two months ago?
       How business activity in your company today versus three months ago? And
       How does the current level of employment in your company compare to the level three
       months ago?
Their future outlook is measured by two questions:

  Women-Owned Enterprises." Journal of Business Venturing 16: 453-470; Thomas D Boston and Linje
  Boston 2007, op. cit

10 | P a g e
How optimistic are you about the economy three months into the future? And
Do you plan to hire more workers over the next three months?
Responses to each of the five questions are scored separately and the average value comprises
the Gazelle Index. Whenever the Index value is .50 or above, it means that firms are more
positive about the present and future expectations than they are negative. The third quarter
Gazelle Index was .40 (see Figure 3) which indicates that businesses were more negative than
positive in their outlook on current and future business conditions. This is true except in the
area of hiring three months into the future. This category the index registered .57 indicating
that these firms plan to engage in hiring in the future.
Figure 3. Are Gazelle Index Pre-test Survey
The index value is derived byResults.
dividingData is presented
the sum as a table.
of the positive andAs
negative responses into the
positive responses. As a result, the pretest assessment illustrated some intriguing differences
among the groups. For example, Figures 4 and 5 record responses to questions regarding the
shown in the figure, the Gazelle Index is .40,
business owners’ future optimism about the economy (three months into the future) and their
hiring plans over the next three months. Overall, minority business owners unless negative in
their view of the current situation
Currentand
Viewinto optimism
of the Economyabout theCurrent
is .21, future than are nonminority
business owners. In particular, blacks registered the greatest level of optimism about the future
as their index score on this element registered .62, or the overall average was .35.
Business Activity is .49, Current Employment
11 | P a g e
is .40, Future Optimism is .35, Future Hiring
Plans
Plans,
engage iswhich
it means
present
negative.
that
positive
business
negative .57.
businesses
in
and
that
than When
conditions.
The
hiring
their
future
at
firms
.57,
werethe
positive
Gazelle
outlook
in the index
expectations
are
indicates
All
more
except
Index
near
more
on isthat
categories
current.50
negative
future.
at
positive
Future
.40
thanorthan
firms
and above,
indicates
areHiring
about
they
future
more
plan
are
the
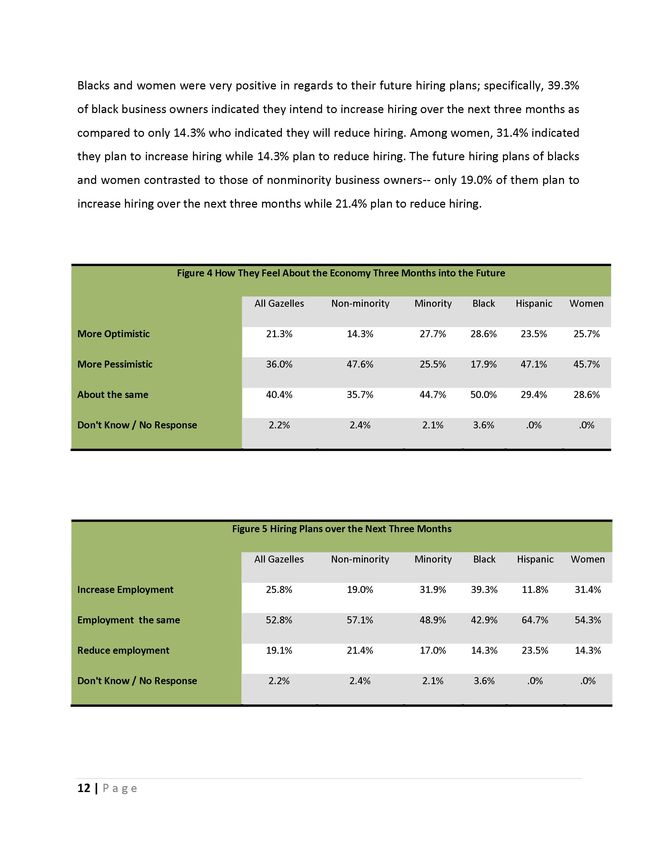
toBlacks and women were very positive in regards to their future hiring plans; specifically, 39.3% of black business owners indicated they intend to increase hiring over the next three months as compared to only 14.3% who indicated they will reduce hiring. Among women, 31.4% indicated they plan to increase hiring while 14.3% plan to reduce hiring. The future hiring plans of blacks and women contrasted to those of nonminority business owners-- only 19.0% of them plan to increase hiring over the next three months while 21.4% plan to reduce hiring. Figure 4. How They Feel About the Economy Three Months into the Future. Data is presented as a table. The table explains each class of participants’ future optimism about the economy. Participant categories listed include All Gazelles, Non-minority, Minority, Black, Hispanic and Women. Responses are categorized as More Optimistic, More Pessimistic, About the Same or Don’t Know/No Response. Of the All Gazelles category, 21.3% responded More Optimistic, 36.0% responded More Pessimistic, 40.4% responded About the Same and 2.2% responded Don’t Know/No Response. Of the Non-Minorities category, 14.3% responded More Optimistic, 47.6% responded More Pessimistic, 35.7% responded About the Same and 2.4% responded Don’t Know/No Response. Of the Minority category, 27.7% responded More Optimistic, 25.5% responded More Pessimistic, 44.7% responded About the Same and 2.1% responded Don’t Know/No Response. Of the Black category, 28.6% responded More Optimistic, 17.9% responded More Pessimistic, 50.0% responded About the Same and 3.6% responded Don’t Know/No Response. Of the Hispanic category, 23.5% responded More Optimistic, 47.1% responded More Pessimistic, 29.4% responded About the Same and 0.0% responded Don’t Know/No Response. Of the Women Category, 25.7% responded More Optimistic, 45.7% responded More Pessimistic, 28.6% responded About the Same and 0.0% responded Don’t Know/No Response. Figure 5. Hiring Plans over the Next Three Months. Data is presented as a table. The table explains each class of participants’ future hiring activity. Participant categories listed include All Gazelles, Non-minority, Minority, Black, Hispanic and Women. Responses are categorized as Increase Employment, Employment the Same, Reduce Employment or Don’t Know/No Response. Of the All Gazelles category, 25.8% responded Increase Employment, 52.8% responded Employment the Same, 19.1% responded Reduce Employment and 2.2% responded Don’t Know/No Response. Of the Non-Minorities category, 19.0% responded Increase Employment, 57.1% responded Employment the Same, 21.4% responded Reduce Employment and 2.4% responded Don’t Know/No Response. Of the Minority category, 31.9% responded Increase Employment, 48.9% responded Employment the Same, 17.0% responded Reduce Employment and 2.1% responded Don’t Know/No Response. Of the Black category, 39.3% responded Increase Employment, 42.9% responded Employment the Same, 14.3% responded Reduce Employment and 3.6% responded Don’t Know/No Response. Of the Hispanic category, 11.8% responded Increase Employment, 64.7% responded Employment the Same, 23.5% responded Reduce Employment and 0.0% responded Don’t Know/No Response. Of the Women Category, 25.7% responded Increase Employment, 45.7% responded Employment the Same, 28.6% responded Reduce Employment and 0.0% responded Don’t Know/No Response. 12 | P a g e
Figure 6 indicates how business owners have adjusted their workforce in response to the
previous recession. The results show that since 2008, 52% of firms have decreased their
employment and 19% have done so by more than 50%. In comparison, 25% of respondents
indicated that increased their workforce and 24% indicated that the side of the workforce has
not changed. Among those increasing their workforce, some firms have registered a rather
dramatic increase; specifically, 3.4% of firms increase their workforce between 50 to 100% and
6.7% have doubled their workforce I increased it by even more. One objective of the Gazelle
Index is to identify those firms that are consistently registering increases in employment and
explore in greater detail the factors that are contributing to that outcome.
Figure 6. Workforce Adjustment since the Recession of 2008. Data is presented as a table. The table explains each class of participants’ hiring
strategy. Participant categories listed include All Gazelles, Non-minority, Minority, Black, Hispanic and Women. Responses are categorized as
Decrease by more than one half, Decrease by less than one half, Subtotal: Percentage Decrease, Increased by 1% to 50%, Increased by 50% to
Policymakers have discussed the concept of a new normal in regards to the economy. The
implication
100%, More thanof this with
doubled, respect
Subtotal: to the
Percentage laborNomarket
Increases, Change. Ofis the
that the country
All Gazelles category,will find
19.1% it more
responded difficult
Decrease by more than
to generate full employment in the future. It has been suggested that firms are using increased
one half, of
levels 32.6% responded Decrease
technology in place by less
of than one half, in
workers Subtotal: Percentageto
an attempt Decrease equals 51.7%,
accelerate 14.6 responded
productivity andIncreased
lower by 1% to 50%,
production costs. Other things being equal this means one can expect to see firms who achieve
3.4% Increased by 50% to 100%, 6.7% More than doubled, Subtotal: Percentage Increases equals 24.7%, 23.6% responded No change. Of the
the same level of prerecession revenue hiring fewer workers than they would have ordinarily.
To explorecategory,
Non-Minority this issue
14.3%in more detail
responded Decrease weby ask
more business owners
than one half, about their
42.9% responded Decreasefuture
by lesshiring
than onestrategy if Percentage
half, Subtotal:
their sales should reach the same level as they did prior to the recession (Figure 7). About 60%
Decrease equals 57.1%, 11.9% responded Increased by 1% to 50%, 0.0% Increased by 50% to 100%, 4.8% More than doubled, Subtotal:
13 | P a g e
Percentage Increases equals 16.7%, 26.2% responded No change. Of the Minority category, 23.4% responded Decrease by more than one half,
23.4% responded Decrease by less than one half, Subtotal: Percentage Decrease equals 46.8%, 17.0% responded Increased by 1% to 50%,
6.4% Increased
Black
Decrease
Percentage
29.4%
Increased
category,
equalscategory,
responded
14.3%,
45.7%,
11.4%
equals
byIncreases
50%
40.0%
8.6%
21.4%
by
responded
39.3%,
Decrease
to50%
responded
100%,
responded
equals
responded
to17.9
100%,
0.0%
Decrease
by39.3%,
responded
less
Increased
No
8.5%
More
Decrease
than
change.
21.4%
by
than
More
one
Increased
more
bydoubled,
responded
by
than
1%
half,
than
more
todoubled,
Subtotal:
50%,
by
one
than
Subtotal:
1%
No
half,
2.9%
one
tochange.
Subtotal:
Percentage
50%,
34.3%
half,
Increased
Percentage
7.1%
17.9%
Of
responded
Percentage
the
Decrease
Increased
byHispanic
responded
Increases
50%Decrease
Increases
toequals
by
category,
100%,
equals
50%
Decrease
70.6%,
by
to
2.9%
equals
17.6%,
less
100%,
41.2%
by
More
11.8%
than
31.9%,
less
11.8%
14.3%
responded
than
one
than
responded
21.3%
half,
responded
More
doubled,
oneDecrease
Subtotal:
responded
than
half,
Increased
Subtotal:
doubled,
Subtotal:
No Percentage
change.
byNomore
by
Percentage
Subtotal:
change.
Percentage
1%
Of
than
tothe
Decrease
50%,
one
Of
Women
Increases
the
half,
5.9%indicated that they were higher the same number of workers as they would have in the past
and 24% indicated that they would hire a large number. Only 17% indicated that they would
hire fewer workers than they would have in the past. The results suggest that the behavior
business owners in regards to hiring does not conform to a prevailing perception; in particular,
a much larger percentage of business owners with it undertake greater hiring that is a
percentage that will engage in less hiring in the future, sales levels being equal.
Figure7. Future Hiring Strategy, if Sales Reach pre-Recession Level. Data is presented as a table. The table explains
each class of participants’ future hiring activity if sales figures reach pre-recession levels. Participant categories
listed include All Gazelles, Non-minority, Minority, Black, Hispanic and Women. Responses are categorized as I
would hire the SAME number of workers, I would hire a SMALLER number of workers, I would hire a LARGER
number of workers. Of the All Gazelles category, 59.6% responded I would hire the SAME number of workers,
16.9% responded I would hire a SMALLER number of workers, 23.6% responded I would hire a LARGER number
of workers.
Fifty-six andOf the Non-Minorities
two-tenth percentcategory,
(56.2) 61.7% responded
of business I would
owners hire the SAME
indicated number
that the debateof workers, 14.9%
in Congress
responded I would hire a SMALLER number of workers, 23.4% responded I would hire a LARGER number of
gave them
workers. Of theaMinority
more category,
pessimistic
57.1%outlook
responded onI would
the economy.
hire the SAME This wasofparticularly
number workers, 19.0% true for
responded
I would hire a SMALLER number of workers, 23.8% responded I would hire a LARGER number of workers. Of the
nonminority
Black category,entrepreneurs
67.9% responded (67.7%)
I wouldand that's
hire the SAMEtrue among
number blacks (46.4%).
of workers, 7.1% responded I would hire a
SMALLER number of workers, 25.0% responded I would hire a LARGER number of workers. Of the Hispanic
category, 58.8% responded I would hire the SAME number of workers, 23.5% responded I would hire a
SMALLER number of workers, 17.6% responded I would hire a LARGER number of workers. Of the Women
Category, 57.1% responded I would hire the SAME number of workers, 14.3% responded I would hire a SMALLER
Figure
number 8.of
How did the28.6%
workers, Debt Ceiling Debate
responded Affecthire
I would Your Economicnumber
a LARGER Outlook.ofData is presented as a table. The table explains
workers.
each class of participants’ economic outlook after the debt ceiling debate. Participant categories listed include All Gazelles,
Non-minority, Minority, Black, Hispanic and Women. Responses are categorized as Made me More Optimistic, Made me
More Pessimistic, Did not Influence my Outlook or Don’t Know/No Response. Of the All Gazelles category, 5.6%
responded Made me More Optimistic, 56.2% responded Made me More Pessimistic, 34.8% responded Did not Influence
my Outlook and 3.4% responded Don’t Know/No Response. Of the Non-Minorities category, 2.4% responded Made me
More Optimistic, 66.7% responded Made me More Pessimistic, 28.6% responded Did not Influence my Outlook and 2.4%
responded Don’t Know/No Response. Of the Minority category, 8.5% responded Made me More Optimistic, 46.8%
responded Made me More Pessimistic, 40.4% responded Did not Influence my Outlook and 4.3% responded Don’t Know/
No Response. Of the Black category, 10.7% responded Made me More Optimistic, 46.4% responded Made me More
Pessimistic, 35.7% responded Did not Influence my Outlook and 7.1% responded Don’t Know/No Response. Of the
Hispanic category, 5.9% responded Made me More Optimistic, 58.8% responded Made me More Pessimistic, 35.3%
responded Did not Influence my Outlook and 0.0% responded Don’t Know/No Response. Of the Women Category, 2.9%
responded Made me More Optimistic, 57.1% responded Made me More Pessimistic, 37.1% responded Did not Influence my
Outlook and 2.9% responded Don’t Know/No Response.
14 | P a g eResponses to several of the remaining questions are reported below, but not commented on. It
is important to note however that when business owners were queried about the factors that
were most important in facilitating their ability to achieve their company's goals, given the
slow-growing economy, several responses are worth noting. Interestingly, the responses
suggested that the most important areas of improvement need to occur in management
efficiency, business-to-business sales, and product and service innovations. Over 85% of
respondents indicated that improvements in these areas were somewhat important or very
important to achieving their company’s’ goals.
In contrast, slightly over one-half of the respondents indicated that being able to receive loans
or capital from external sources was somewhat important or very important to achieving their
company’s’ goals in the current economy. However, the percentage among minorities who felt
this was very important (44.7%) greatly exceeded the percentage among non-minorities
(23.8%).
Figure 8. Importance of Receiving Loans and Capital from External Sources to Achieving Company’s Goals During the Current
Slow Grow Economy. Data is presented as a table. The table explains each class of participants’ level of importance given to receiving
loans and capital from external sources to achieve company’s goals at current economic levels. Participant categories listed include
Non-minority, Minority and All Gazelles. Responses are categorized as Very Important, Somewhat Important and Not Important at All. Of
the Non-Minorities category, 23.8% responded Very Important, 26.2% responded Somewhat Important, and 50.0% responded Not
Important at All. Of the Minority category, 44.7% responded Very Important, 12.8% responded Somewhat Important, and 42.6%
responded Not Important at All. Of the All Gazelles category, 34.8% responded Very Important, 19.1% responded Somewhat Important,
46.1% responded Not Important at All.
Figure 9. Importance of Increasing Internet Sales to Achieving Company’s Goals during the Current Slow Growing Economy. Data is
presented as a table. The table explains each class of participants’ level of importance given to increasing internet sales to achieve
15 | P a g e
company’s goals at current economic levels. Participant categories listed include Non-minority, Minority and All Gazelles. Responses are
categorized as Very Important, Somewhat Important, Not Important at All and Don’t Know/No Response. Of the Non-Minorities category,
26.2%
Know/No
Not
responded
Important
responded
Response.
Somewhat
at AllVery
and
OfImportant,
Important,
the
2.1%Minority
responded
52.8%
9.5%
category,
responded
Don’t29.8%
Know/No
Somewhat
Not
responded
Important
Response.
Important,
Very
at Of
AllImportant,
the
and
61.9%
All
2.2%
Gazelles
responded
23.4%
responded
responded
category,
Not
Don’t
Important
28.1%
Know/No
Somewhat
responded
at All
Response.
Important,
and Very
2.4%44.7%
Important,
responded
responded
16.9%
Don’tDon't Know / No Response 2.4% 2.1% 2.2%
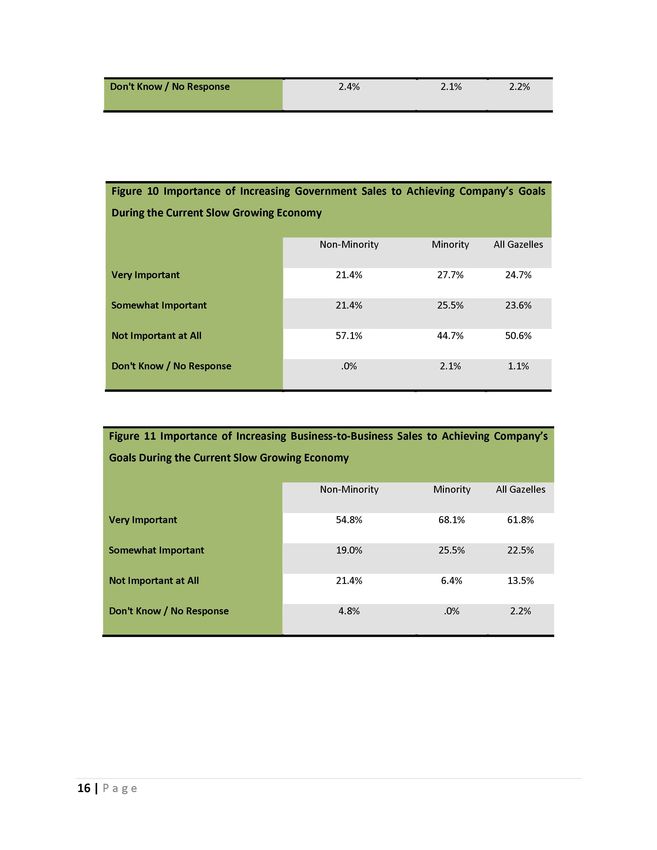
Figure 10. Importance of Increasing Government Sales to Achieving Company’s Goals during the Current Slow
Growing Economy. Data is presented as a table. The table explains each class of participants’ level of importance
given to increasing government sales to achieve company’s goals at current economic levels. Participant categories
listed include Non-minority, Minority and All Gazelles. Responses are categorized as Very Important, Somewhat
Important, Not Important at All and Don’t Know/No Response. Of the Non-Minorities category, 21.4% responded
Very Important, 21.4% responded Somewhat Important, 57.1% responded Not Important at All and 0.0% responded
Don’t Know/No Response. Of the Minority category, 27.7% responded Very Important, 25.5% responded Somewhat
Important, 44.7% responded Not Important at All and 2.1% responded Don’t Know/No Response. Of the All Gazelles
category,
Figure 11. 24.7% responded
Importance Very Important,
of Increasing 23.6% responded
Business-to-Business SalesSomewhat Important,
to Achieving 50.6%
Company’s responded
Goals NotCurrent
during the Important
at AllGrowing
Slow and 1.1% responded
Economy. Don’t
Data Know/No Response.
is presented as a table. The table explains each class of participants’ level of
importance given to increasing business-to-business sales to achieve company’s goals at current economic levels.
Participant categories listed include Non-minority, Minority and All Gazelles. Responses are categorized as Very
Important, Somewhat Important, Not Important at All and Don’t Know/No Response. Of the Non-Minorities
category, 54.8% responded Very Important, 19.0% responded Somewhat Important, 21.4% responded Not
16 | PImportant
a g e at All and 4.8% responded Don’t Know/No Response. Of the Minority category, 68.1% responded Very
Important, 25.5% responded Somewhat Important, 6.4% responded Not Important at All and 0.0% responded Don’t
Know/No Response.
Important, 13.5% responded
Of the All
NotGazelles
Important
category,
at All and
61.8%
2.2%responded
respondedVery
Don’t
Important,
Know/No22.5%
Response.
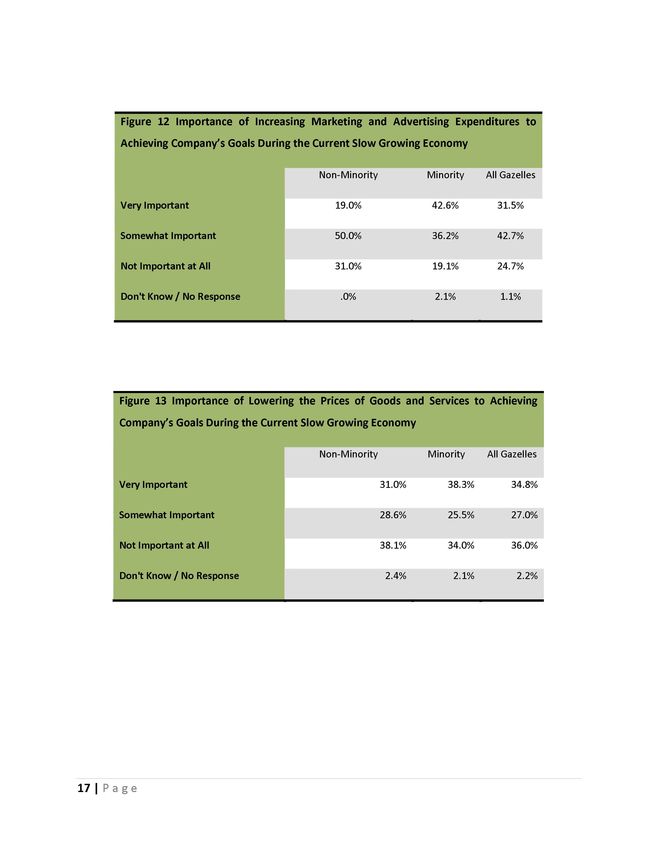
responded SomewhatFigure 12. Importance of Increasing Marketing and Advertising Expenditures to Achieving Company’s
Goals during the Current Slow Growing Economy. Data is presented as a table. The table explains
each class of participants’ level of importance given to increasing marketing and advertising expenditures
to achieve company’s goals at current economic levels. Participant categories listed include Non-minority,
Minority and All Gazelles. Responses are categorized as Very Important, Somewhat Important, Not
Important at All and Don’t Know/No Response. Of the Non-Minorities category, 19.0% responded Very
Important, 50.0% responded Somewhat Important, 31.0% responded Not Important at All and 0.0%
responded Don’t Know/No Response. Of the Minority category, 42.6% responded Very Important, 36.2%
responded Somewhat Important, 19.1% responded Not Important at All and 2.1% responded Don’t Know/
No Response. Of the All Gazelles category, 31.5% responded Very Important, 42.7% responded
Figure 13. Importance of Lowering the Prices of Goods and Services to Achieving Company’s Goals during the
Somewhat Important, 24.7% responded Not Important at All and 1.1% responded Don’t Know/No Response.
Current Slow Growing Economy. Data is presented as a table. The table explains each class of participants’
level of importance given to increasing marketing and advertising expenditures to achieve company’s goals at
current economic levels. Participant categories listed include Non-minority, Minority and All Gazelles. Responses
are categorized as Very Important, Somewhat Important, Not Important at All and Don’t Know/No Response. Of
the Non-Minorities category, 31.0% responded Very Important, 28.6% responded Somewhat Important, 38.1%
responded Not Important at All and 2.4% responded Don’t Know/No Response. Of the Minority category, 38.3%
17 | P aresponded
ge Very Important, 25.5% responded Somewhat Important, 34.0% responded Not Important at All and
2.1% responded Don’t Know/No Response. Of the All Gazelles category, 34.8% responded Very Important,
27.0%
No Response.
responded Somewhat Important, 36.0% responded Not Important at All and 2.2% responded Don’t Know/Figure 14. Importance of Improving the Company’s
Technology to Achieving Company’s Goals During the
Current Slow Grow Economy. Data is presented as a
table. The table explains each class of participants’
level of importance given to improving the company’s
technology to achieve company’s goals at current
economic levels. Participant categories listed include
Non-minority, Minority and All Gazelles. Responses are
categorized as Very Important, Somewhat Important
Figure 15. Importance of Improving Management Efficiency to Achieving Company’s Goals During the Current Slow Grow Economy. Data is
and Not Important at All. Of the Non-Minorities
presented as a table. The table explains each class of participants’ level of importance given to improving the management efficiency to ach
category, 16.7% responded Very Important, 28.6%
company’s goals at current economic levels. Participant categories listed include Non-minority, Minority and All Gazelles. Responses are
responded Somewhat Important, and 54.8% responded
categorized as Very Important, Somewhat Important and Not Important at All. Of the Non-Minorities category, 61.9% responded Very
Not Important at All. Of the Minority category, 48.9%
Important, 28.6% responded Somewhat Important, and 9.5% responded Not Important at All. Of the Minority category, 76.6% responded
responded Very Important, 31.9% responded Somewhat
Very Important, 17.0% responded Somewhat Important, and 6.4% responded Not Important at All. Of the All Gazelles category, 69.7%
Important, and 19.1% responded Not Important at All.
responded Very Important, 22.5% responded Somewhat Important, 7.9% responded Not Important at All.
Of the All Gazelles category, 33.7% responded Very
Important, 30.3% responded Somewhat Important,
18 | P a g e
36.0% responded Not Important at All.Figure 16. Importance of Improving Product and Service Innovations to Achieving Company’s Goals During the
Current Slow Grow Economy. Data is presented as a table. The table explains each class of participants’ level of
importance given to improving product and service innovations to achieve company’s goals at current economic
levels. Participant categories listed include Non-minority, Minority and All Gazelles. Responses are categorized as
Very Important, Somewhat Important and Not Important at All. Of the Non-Minorities category, 47.6% responded
Very Important, 33.3% responded Somewhat Important, and 19.0% responded Not Important at All. Of the Minority
category, 72.3% responded Very Important, 17.0% responded Somewhat Important, and 10.6% responded Not
Important at All. Of the All Gazelles category, 60.7% responded Very Important, 24.7% responded Somewhat
Important,
Figure 17. 14.6% responded
Importance Not Important
of Increasing at All. Sales to Achieving Company’s Goals during the Current Slow
International
Growing Economy. Data is presented as a table. The table explains each class of participants’ level of importance
given to increasing international sales to achieve company’s goals at current economic levels. Participant categories
listed include Non-minority, Minority and All Gazelles. Responses are categorized as Very Important, Somewhat
Important, Not Important at All and Don’t Know/No Response. Of the Non-Minorities category, 11.9% responded
Very Important, 7.1% responded Somewhat Important, 78.6% responded Not Important at All and 2.4% responded
Don’t Know/No Response. Of the Minority category, 23.4% responded Very Important, 21.3% responded Somewhat
Important, 53.2% responded Not Important at All and 2.1% responded Don’t Know/No Response. Of the All Gazelles
category, 18.0% responded Very Important, 14.6% responded Somewhat Important, 65.2% responded Not Important
at g
19 | P a Alleand 2.2% responded Don’t Know/No Response.You can also read