SALES LOSSES IN THE FIRST QUARTER OF THE COVID-19 PANDEMIC: EVIDENCE FROM CALIFORNIA ADMINISTRATIVE DATA
←
→
Page content transcription
If your browser does not render page correctly, please read the page content below
SALES LOSSES IN THE FIRST QUARTER OF THE
COVID-19 PANDEMIC: EVIDENCE FROM CALIFORNIA
            ADMINISTRATIVE DATA

                    Robert Fairlie
           University of California, Santa Cruz,
              Stanford University & NBER

                  Frank M. Fossen
               University of Nevada, Reno
                          & IZA

                      January, 2021
               Working Paper No. 21-005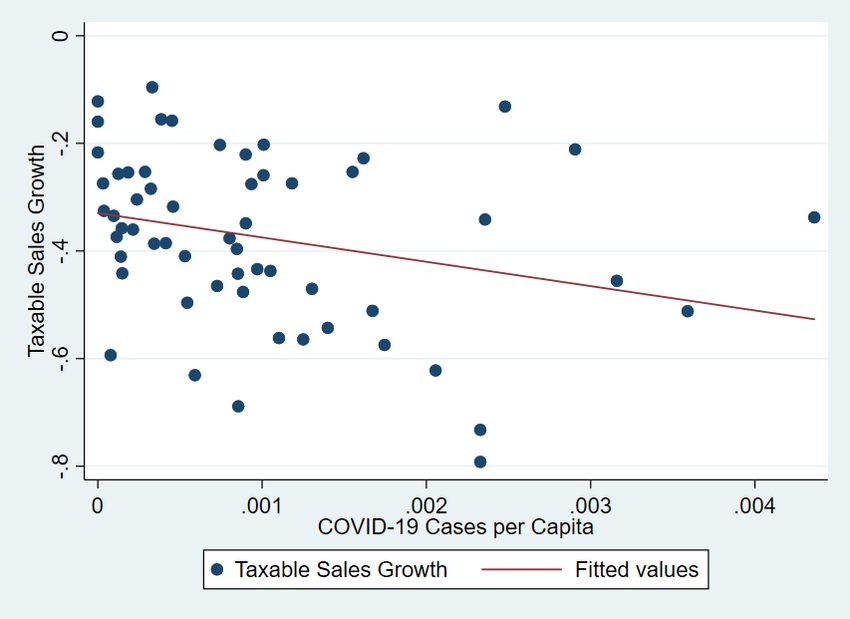
Sales Losses in the First Quarter of the COVID-19 Pandemic: Evidence
                      from California Administrative Data
                              Robert Fairlie1 and Frank M. Fossen2
                                            January 28, 2020

                                                   Abstract
COVID-19 led to a massive shutdown of businesses in the second quarter of 2020. Estimates from
the CPS, for example, indicate that the number of active business owners dropped by 22 percent
from February to April 2020. In this descriptive research note, we provide the first analysis of
losses in sales and revenues among the universe of businesses in California using administrative
data from the California Department of Tax and Fee Administration. The losses in sales average
17 percent in the second quarter of 2020 relative to the second quarter of 2019 even though year-
over-year sales typically grow by 3-4 percent. We find that sales losses were largest in businesses
affected by mandatory lockdowns such as Accommodations, which lost 91 percent, whereas online
sales grew by 180 percent. Losses also differed substantially across counties with large losses in
San Francisco (50 percent) and Los Angeles (24 percent) whereas some counties experienced small
gains in sales. Placing business types into different categories based on whether they were essential
or non-essential (and thus subject to early lockdowns) and whether they have a moderate or high
level of person-to-person contact, we find interesting correlations between sales losses and
COVID-19 cases per capita across counties in California. The results suggest that local
implementation and enforcement of lockdown restrictions and voluntary behavioral responses as
reactions to the perceived local COVID-19 spread both played a role, but enforcement of
mandatory restrictions may have had a larger impact on sales losses.

Keywords: business, entrepreneurship, self-employment, COVID-19, coronavirus, shelter in
place restrictions, social distancing restrictions, revenue, sales tax
JEL Codes: L26; H25; I18

1Department of Economics, University of California, Santa Cruz, Stanford University (Visiting Scholar), and
NBER (rfairlie@ucsc.edu). 2 Department of Economics, University of Nevada, Reno, and IZA (ffossen@unr.edu).
We would like to thank Isabel Guzman at the California Governor’s Office of Business and Development, and Irena
Asmundson at the California Department of Finance, for help with the data.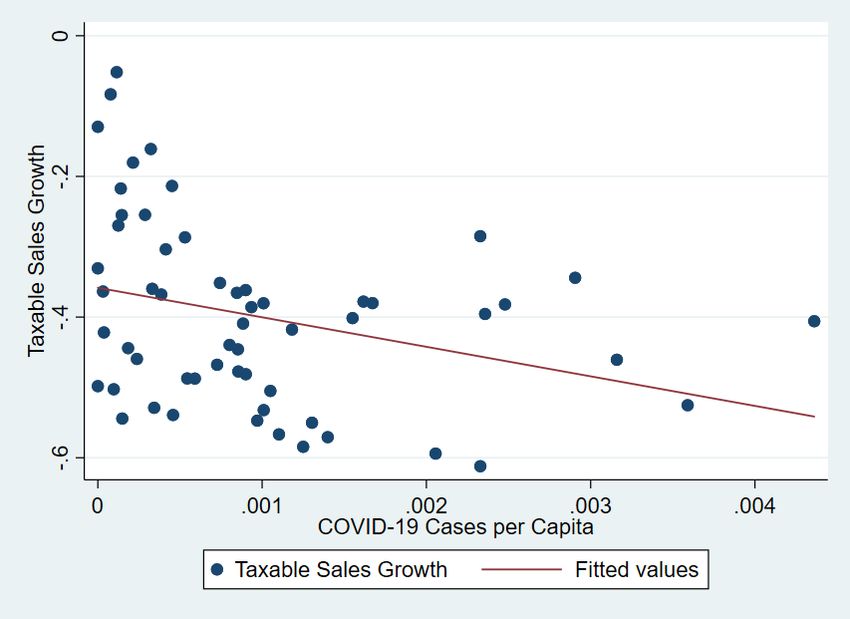
1. Introduction
The widespread closing of stores and businesses in the United States and around the world due to
the coronavirus is unprecedented. Stores, factories and many other businesses have closed by
policy mandate, downward demand shifts, health concerns, or other factors. Estimates from the
CPS, for example, indicate that the number of active business owners in the United States
plummeted from 15.0 million in February 2020 to 11.7 million in April 2020 and only partially
rebounded by June (Fairlie 2020). 1 By June losses were at 1.2 million. The shutdowns and
reductions in work activity are likely to have resulted in substantial lost income for business
owners and may result in permanent closures. 2
        In this descriptive paper, we provide the first analysis of sales losses among businesses
using administrative data from the California Department of Tax and Fee Administration. We
examine taxable sales by type of business and across counties within California. We find
substantial losses in 2020 Q2 in total taxable sales in California. Although average year over year
growth by quarter is normally roughly 3-4 percent, sales dropped by 17 percent from 2019 Q2 to
2020 Q2. Across industries, the losses were much more severe for those deemed “non-essential”
or ones with substantial person-to-person contact. For example, Accommodations sales dropped
by 92 percent, bars by 86 percent, and clothing stores by 52 percent. In contrast, however, online
sales grew by 180 percent. Across counties in California, we find that counties that experienced
more COVID-19 cases per capita suffered a greater percent decline in sales. This relationship was
most pronounced for businesses affected by mandatory lockdowns, but also for businesses with
high levels of person-to-person contact.
        These findings contribute to the scant evidence on the effects of COVID-19 on the sales
and revenues of small businesses. 3 Data from the transactions of financial accounts at JP Morgan
Chase (JPMC) indicate that small business revenues dropped 30-50 percent at the end of March

1
  Additional evidence of business shutdowns early in the pandemic is provided, for example, from the weekly U.S.
Census Small Business Pulse Survey which indicates that roughly 50 percent of businesses report having a large
negative effect from the COVID-19 pandemic (U.S. Census Bureau 2020; Bohn, Mejia and Lafortune 2020). Bartik
et al. (2020) conducted a survey in late March of nearly 6,000 small businesses that were members of the Alignable
Business Network. They find that 43 percent of businesses are temporarily closed, large reductions in employees,
and that the majority of businesses have less than one month of cash on hand.
2
  Just prior to the pandemic when small business owners were asked what actions they would take if faced with a
two-month revenue loss roughly half said they would use their own funds and 17 percent said they would close or
sell the business (Mills et al. 2020).
3
  In California, 98 percent of business establishments with employees have less than 100 employees (U.S. Census
Bureau 2018).

                                                        1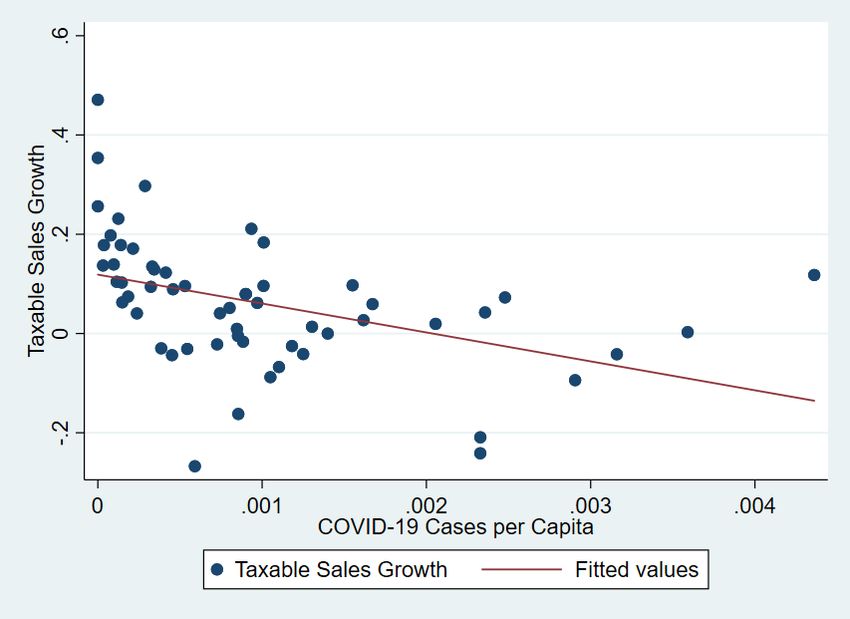
and early April and 40 percent into May (Farrell, Wheat and Mac 2020; Kim, Parker and Schoar
2020). In surveys conducted by the Kauffman Foundation, Desaii and Looze (2020) find that 60
percent of business owners reported lower sales in April and 50 percent of owners reported lower
sales in May. The Opportunity Insights Economic Tracker reports small business revenue data
from Womply and finds a drop of 50 percent in April from January and a rebound of only 30
percent since then. 4 Bloom, Fletcher and Yeh (2021) partnered with a large payments technology
company to collect survey data from 2,500 small businesses and find an average loss of 29 percent
in sales in 2020 Q2. We build on these findings by analyzing data from the State of California that
covers all sectors reporting taxable sales across the 58 counties in the state. 5
        The findings are potentially important for future targeting and oversight of government aid
to preserve small businesses and the jobs they create. The results also have implications for
discussions around what the federal government will do next (e.g. President Biden’s proposed $1.9
trillion coronavirus stimulus package).

2. Results
The data used here are from the California Department of Tax and Fee Administration. We focus
on taxable sales for all businesses in the state. In California taxable sales decreased substantially
in the second quarter of 2020, which directly followed the social distancing restrictions imposed
by the state. 6 Total taxable sales in California were $152 billion in 2020 Q2 which represents a
drop of 17.5 percent from 2019 Q2. Typically year over year growth for the same quarter is
between 3 to 4 percent (see Figure 1). The sharp decline in sales was not due to a loss in the number
of sales permits which experienced growth of 1 percent from 2019 Q2 to 2020 Q2. Average sales
per business permit dropped by 18.3 percent to $123,237 in 2020 Q2.

4
  See https://tracktherecovery.org/. Womply aggregates data from several credit card processors to analyze for small
businesses. The data are distributed across sectors for which credit card use is common and focus on small
businesses, thus comprising a larger share of food services, professional services, and other services.
5
  The findings also contribute to the broader literature on the general relationship between recessions and
entrepreneurship. The evidence is surprisingly mixed with many previous studies showing positive relationships,
negative relationships, and zero relationships (Parker 2018).
6
  On March 11, 2020, the World Health Organization (WHO) declared COVID-19 a pandemic. On March 16, the
San Francisco Bay Area imposed the first shelter-in-place restrictions in the country followed by the State of
California on March 19. New York State followed the next day. By early April most states imposed social
distancing restrictions.

                                                         2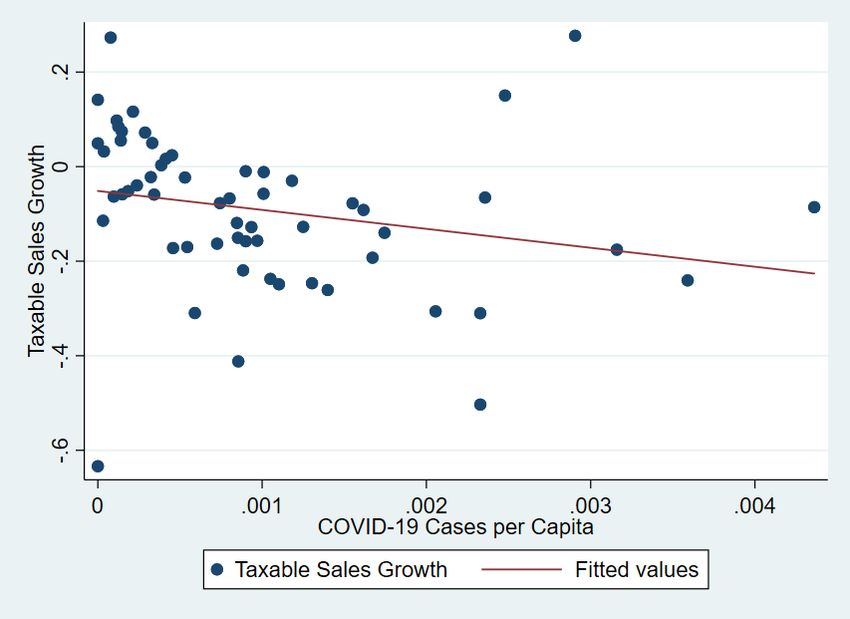
Figure 1: Total All Outlets: Year-over-Year Growth
                5          0
   Percent Change in Sales
        -10      -5
                -15
                -20

                               2016            2017            2018            2019             2020
                                                                 year

Event Study Results
                               We estimate a simple event-study regression in which we adjust for a time trend and allow
for seasonal (quarter) fixed effects. The results do not change from the comparison of 2019 Q2 to
2020 Q2 and adding an average growth rate over the time period. We find that total taxable sales
losses are predicted to be $37.9 billion or a 20.5 percent drop from 2019 Q2 levels. Using a
quadratic time trend instead of a linear time trend results in a slightly larger loss in total sales from
COVID-19. We focus the remaining analysis on 2019 Q2 to 2020 Q2 comparisons for simplicity
and clarity.

2.1 Losses across Business Types (Categories, Types, Subtypes)
To slow the spread of COVID-19 governments enforced social distancing restrictions that shut
down businesses in jobs and industries deemed “non-essential.” Less drastic restrictions were also
imposed on “essential” businesses, such as capacity limitations for grocery stores. Health concerns
also dissuaded customers from visiting stores that had person-to-person contact. Finally, the ability

                                                                        3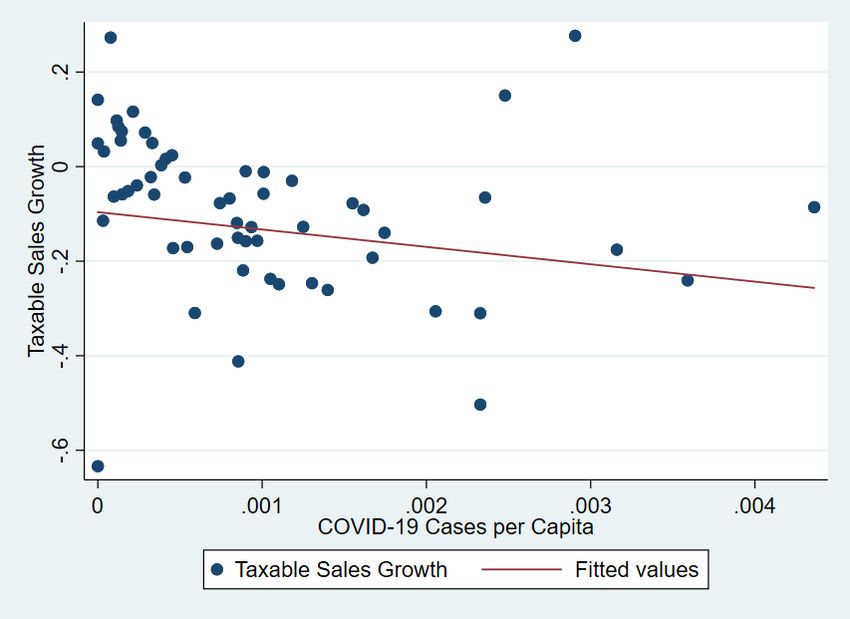
to telecommute in jobs allowed certain businesses or at least certain jobs in those businesses to
continue to operate.
       We investigate losses across business types used by the Department of Tax and Fee
Administration. Table 1 report the percent change in sales from 2019Q2 to 2020Q2 and sales levels
in 2020Q2 for aggregated business types. Starting with stores that were mostly considered “non-
essential” and have person-to-person contact we find major losses. Clothing and Clothing
Accessories Stores lost 54.5 percent from the second quarter of 2019 to the second quarter of 2020.

                Table 1: California Taxable Sales Losses by Business Types
                                              Percent
                                               Change           Taxable
                                             2019Q2 to       Transactions    Percent of
 Business Type                                 2020Q2           Amount        Total Tax
 Total All Outlets                                    -17    152,362,296,481      100.0
 Total Retail and Food Services                       -17    105,528,311,167        69.3

 Motor Vehicle and Parts Dealers                   -15    19,294,245,937           12.7
 Furniture and Home Furnishings Stores             -18      2,625,229,637           1.7
 Electronics and Appliance Stores                  -14      3,663,719,124           2.4
 Building Material and Garden Equipment             12    12,248,068,380            8.0
 Food and Beverage Stores                            2      7,584,295,812           5.0
 Health and Personal Care Stores                   -11      3,414,123,225           2.2
 Gasoline Stations                                 -47      7,737,896,946           5.1
 Clothing and Clothing Accessories Stores          -54      4,744,372,982           3.1
 Sporting Goods, Hobby, Musical Instrume           -20      2,010,965,666           1.3
 General Merchandise Stores                        -10    12,522,013,242            8.2
 Miscellaneous Store Retailers                     -17      4,418,659,674           2.9
 Food Services and Drinking Places                 -47    11,991,170,465            7.9
 Total All Other Outlets                           -19    46,833,985,314           30.7
 Source: Administrative data from the California Department of Tax and Fee
 Administration.

       Food Services and Drinking Places were not shut down, but faced restrictions in terms of
switching to takeout and delivery service only and then later adding outside dining service. These
restrictions and concerns over health led to a major drop in demand. Sales at restaurants, bars, and
other eating establishments dropped 47.4 percent from 2019 Q2 to 2020 Q2. In contrast, this
business type category was experiencing year over year growth of 3-6 percent prior to the

                                                  4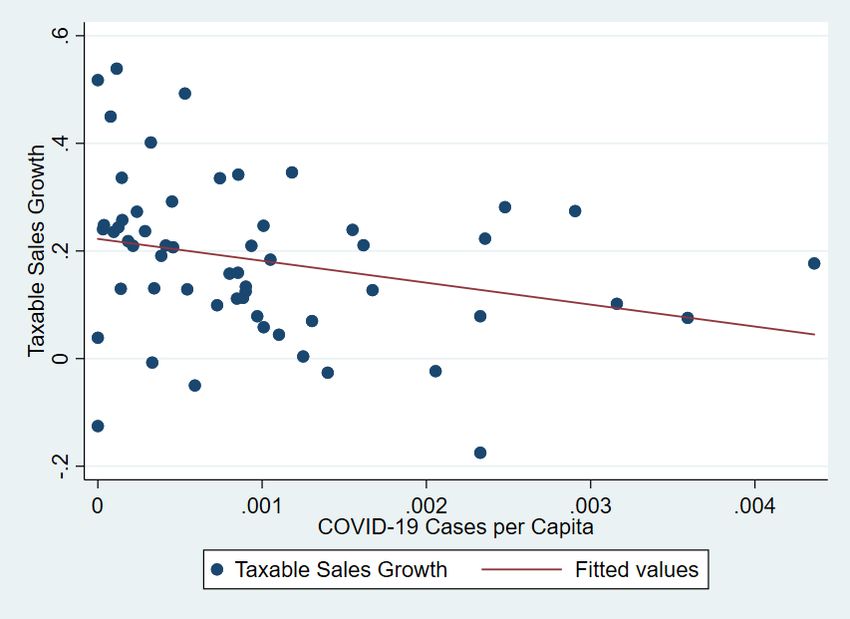
pandemic. Gasoline was deemed essential but as workers stayed at home and business travel was
mostly shut down gasoline stations lost substantial revenue. From the second quarter 2019 to the
second quarter 2020 sales dropped by 47.0 percent. Larger purchases and ones with more
flexibility in timing of purchases experienced large, but smaller drops in taxable sales. Home
Furnishings and Appliance Stores dropped 15.5 percent over the year. Similarly, Motor Vehicle
and Parts Dealers dropped by 14.8 percent.
       Not all businesses experienced large losses. Businesses that were deemed “essential” were
not forced to close and remained open during the first three months of the pandemic (i.e. second
quarter 2020). Food and Beverage Stores experienced an increase of 1.7 percent but the growth
rate was lower than average year of year growth in sales. Building Material and Garden Equipment
grew by 12.1 percent which likely reflects the many home and garden repair and improvement
projects started by home owners with more time on their hands during the pandemic.
       “General Merchandise Stores” capture both essential and non-essential goods so were often
open during the pandemic. They experienced a drop of 9.8 percent from 2019 Q2 to 2020 Q2. All
other outlets experienced a drop of 19.4 percent.
       Combing all business types, All Outlets experienced a drop of 17.5 percent. Total Retail
and Food Services dropped by a similar amount, 16.6 percent.
       In Figure 2 we report losses for selected disaggregated business types for large losses and
large gains in 2020 Q2 (see Appendix Table 1 for all business types). Drilling down by detailed
business type reveals some extremely large losses for specific sectors. The Accommodation
subsector had the largest loss at 91 percent, followed by the 86 percent drop in taxable sales at
Drinking Places-Alcohol, and the 83 percent drop at Arts, Entertainment and Recreation places.
Full-service restaurants, which were often shut down or switched to take out, also did not fare well
with sales losses of 61 percent. Small shops selling Gifts and Souvenirs, Clothing, or Books also
experienced large losses in the second quarter of 2020. All of these businesses are characterized
as by being “non-essential” and/or suffered from reduced demand because of high levels of person-
to-person contact.

                                                 5
Figure 2: Sales Growth Percent (2019Q2 to 2020Q2)
Selected Business Types with Large Losses and Gains
200
175
150
125
100
75
50
25
0
1
-25
-50
-75
-100
-125
Accommodation Drinking Places (Alcoholic) Arts, Entertainment, and Rec
Full-Service Restaurants Gift, Novelty, and Souvenir Clothing Stores
Book Stores and News Dealers Gasoline Stations Supermarkets and Other Grocery
Lawn and Garden Equipment Pharmacies and Drug Stores Beer, Wine, and Liquor
Building Material and Supplies Agric., Forestry, Fish and Hunt Nonstore Retailers
On the other end of the spectrum, some business types did extremely well. The shift by
consumers to online purchases bolstered the sector “Nonstore Sales” into astonishing positive
growth of 181 percent. The sectors of Agriculture, Building Materials, Pharmacies, Garden
Centers, Supermarkets, and even Liquor Stores were deemed “essential” and experienced positive
sales growth from 2019 Q2 to 2020 Q2. Although Supermarkets experienced growth of 5 percent
in 2020 Q2 the shutdown and avoidance of many restaurants and previous annual growth of
roughly 2 percent suggested perhaps larger potential growth. 7 Interestingly, 2020 Q1 experienced
growth of over 10 percent over 2019 Q1 which might reflect some panic buying of food and
supplies when concerns over the pandemic first hit. Concerns over health and changing restrictions
on the shopping experience then might have tempered demand somewhat for visiting supermarkets
in 2020 Q2.
7
Note that most grocery items are exempt from sales tax in California. Taxable items include hot prepared food
products, carbonated beverages, effervescent bottled water, wine, and spirits, for example.
6Overall, the patterns of sales losses and growth indicate a shift from in-store purchases to
online purchases, and from restaurants to grocery stores. Whether an industry was deemed
essential vs. non-essential had a major impact on whether sales growth was negative or positive in
the second quarter of 2020. Finally, consumers avoided business subsectors in which there was a
lot of person-to-person contact because of health concerns over the coronavirus.
2.2 Losses across Counties
California has a diverse set of counties ranging from large, densely populated counties such as Los
Angeles and San Francisco to very small rural counties in the mountains such as Alpine and Shasta
counties. Related to population density COVID-19 cases per capita differed substantially across
counties. Table 2 reports taxable sales losses by county for all outlets and cumulative confirmed
COVID-19 cases per capital by May 15, 2020. Businesses in San Francisco County experienced
one of the largest sales losses across all counties, dropping by 50 percent from 2019 Q2 to 2020
Q2. Los Angeles County experienced a drop in taxable sales of 24 percent, and San Diego County
experienced a drop in taxable sales of 19 percent. In contrast, several small counties actually
experienced positive growth in taxable sales from 2019 Q2 to 2020 Q2.
7Table 2: California Taxable Sales Losses by County
Change Cum. Change Cum.
2019Q2 Taxable COVID-19 2019Q2 Taxable COVID-19
to Transactions Cases per to Transactions Cases per
County 2020Q2 Amt. M$ 1000 Inh. County 2020Q2 Amt. M$ 1000 Inh.
LOS ANGELES -24% 32,702.3 3.59 IMPERIAL -9% 614.9 4.36
ORANGE -25% 13,242.8 1.30 EL DORADO -6% 591.6 0.34
SAN DIEGO -19% 12,388.5 1.67 KINGS 15% 535.3 2.48
SANTA CLARA -13% 10,061.4 1.25 HUMBOLDT -2% 513.4 0.53
SAN BERNARDINO -8% 9,633.8 1.55 SUTTER 0% 489.2 0.39
RIVERSIDE -7% 9,554.2 2.36 MADERA 2% 475.3 0.45
ALAMEDA -26% 6,601.6 1.40 MENDOCINO -6% 391.8 0.15
SACRAMENTO -7% 6,339.9 0.80 NEVADA 2% 377.4 0.41
FRESNO -3% 4,011.2 1.18 TEHAMA -11% 234.6 0.03
CONTRA COSTA -16% 3,836.7 0.97 TUOLUMNE 3% 204.0 0.04
SAN JOAQUIN -1% 3,646.0 0.90 SAN BENITO -1% 187.6 1.01
KERN -9% 3,642.2 1.62 LAKE 8% 183.5 0.12
SAN MATEO -31% 3,147.7 2.06 YUBA 5% 177.9 0.33
VENTURA -16% 3,123.6 0.90 SISKIYOU 10% 162.5 0.11
SAN FRANCISCO -50% 2,648.4 2.33 COLUSA 6% 141.6 0.14
TULARE 28% 2,541.1 2.91 GLENN -2% 136.3 0.32
STANISLAUS -6% 2,324.6 1.01 AMADOR -4% 122.6 0.24
PLACER -17% 2,229.3 0.46 CALAVERAS 7% 118.8 0.29
SONOMA -16% 2,144.6 0.73 LASSEN 14% 81.1 0.00
SOLANO -13% 1,859.8 0.93 INYO -24% 72.7 1.05
SANTA BARBARA -18% 1,593.2 3.16 DEL NORTE 7% 67.1 0.15
MONTEREY -22% 1,524.2 0.88 PLUMAS 12% 65.6 0.21
SAN LUIS OBISPO -15% 1,229.1 0.85 MONO -31% 48.1 2.33
MARIN -25% 1,059.4 1.10 TRINITY 27% 37.1 0.08
YOLO -12% 1,047.1 0.85 MARIPOSA -41% 36.1 0.86
BUTTE -6% 927.0 0.10 MODOC 5% 25.0 0.00
SANTA CRUZ -17% 857.1 0.54 SIERRA -63% 4.6 0.00
SHASTA -5% 848.3 0.18 ALPINE -14% 3.8 1.75
MERCED -8% 819.3 0.74 CA Total -17% 152,351.1 1.97
NAPA -31% 667.2 0.59
Note: Cumulative COVID-19 cases are confirmed cases per 1000 inhabitants by May 15, 2020.
Source: Administrative data from the California Department of Tax and Fee Administration and USAFacts.
2.3 COVID-19 Cases and Sales Losses by County
In this section, we analyze how the changes in taxable sales were correlated with coronavirus cases
at the county level. We obtain confirmed COVID-19 cases by county and day from USAFacts
(2020) and use cumulative cases by May 15, 2020 (the midpoint in the second quarter) per capita. 8
Of course, testing for COVID-19 was often not readily available in the second quarter of 2020,
and availability and uptake of testing may have varied across counties. However, decisions of
consumers and producers as well as decisions of policymakers about the implementation and
enforcement of lockdowns were based on the same testing data, which were widely reported in the
8
County population numbers are from the U.S. Census Bureau.
8media, including the local media. Therefore, our analysis is informative about the effects of the
perceived local spread of COVID-19.
Figure 3 provides a scatter plot relating the growth rate in taxable sales across all business
types between the second quarter in 2019 and the second quarter in 2020 to the cumulative number
of COVID-19 cases per capita by May 15, 2020, in each of the 58 counties in California. The data
indicate a clear negative relationship. A bivariate regression line is also shown; the slope
coefficient is -40.06 with a standard error of 22.48, indicating that an additional known COVID-
19 case per 1000 inhabitants in a county was associated with an additional decline in taxable sales
by 4 percentage points. 9
Figure 3: Taxable Sales Losses by County for All Outlets
Notes: Each dot in the scatter plot represents one county in California. The taxable sales growth rate is the relative
change between 2019 Q2 and 2020 Q2 for all outlets. COVID-19 cases are the cumulative confirmed cases per capita
in the county by May 15, 2020. A linear bivariate regression line is also shown.
9
Weighting the regression by the population size of the counties does not change the picture (see Figure B1 in
Appendix B), the slope coefficient (std. err.) becomes -36.77 (0.0148).
9From a policy perspective, it is important to understand how much mandatory lockdown
restrictions were binding. Would consumers have avoided spending or producers shut their
businesses due to fear of contagion even without government intervention? A comparison across
different business types sheds some light on these questions. Table 3 classifies exemplary business
types by whether they were deemed non-essential and therefore subject to strong lockdown
restrictions and by the possibility to maintain social distance from other people (workers or
customers). For example, garden equipment and clothing shops may have comparable
opportunities for maintaining social distance, but the former business type was exempt from
stricter lockdown restrictions because it was considered essential. Therefore, if we find a stronger
correlation between known COVID-19 cases and sales losses for clothing than gardening shops at
the county level, this may be attributable to the imposition and enforcement of lockdown
restrictions, which can be expected to be stricter in counties with more COVID-19 cases per capita.
In contrast, both clothing shops and restaurants (food services and drinking places) were classified
as non-essential and therefore subject to similar lockdown restrictions in California in the second
quarter of 2020, but social distancing may be easier in clothing shops; therefore, if we find different
strengths of correlation between COVID-19 cases and sales losses in these types of businesses,
this may be attributable to voluntary behavior of customers or sellers due to caution and fear of
contagion. 10
Table 3: Potential Exposure of Business Types to the Pandemic
“Essential” (no lockdown) “Non-essential” (subject to
lockdown)
Moderate person-to-person contact Building Material and Clothing and Clothing
Garden Equipment; Accessories Stores
Gasoline Stations
High person-to-person contact Food and Beverage Stores Food Services and
Drinking Places
10
We classify food and beverage stores into the high person-to-person contact category due to the often comparably
high density of customers and employees in and around these stores. Keep in mind that most grocery items are
exempt from sales tax in California, see footnote 7.
10Motivated by these considerations, we compare scatter plots with unweighted regression
lines for the business types mentioned in Table 3. They appear in Figures 4-7. 11 All of these plots
reveal negative relationships between local known COVID-19 cases and sales growth. The finding
that this negative relationship is not only observed for business types that are subject to strict
lockdown restrictions, but also for so-called essential business types such as garden equipment
stores and grocery stores, indicates that at least some of the drop in sales is driven by a voluntary
change of behavior by consumers and producers out of caution when the local spread of COVID-
19 seemed high, and potentially also by larger drops in income in these regions. However, the
negative slopes of the relationships are steeper for non-essential businesses that were subject to
strict lockdown restrictions, indicating that the imposition and enforcement of lockdown
restrictions also played an important role.
We begin by contrasting two business types which seem comparable in terms of social
distancing possibilities: building material and garden equipment stores, which were considered
essential businesses, in Figure 4, and clothing stores, which were non-essential, in Figure 5. The
impact of local known COVID-19 cases on sales was larger for clothing stores. While sales grew
on average for building materials and gardening stores, they shrank on average for clothing stores,
presumably due to the stricter lockdown restrictions for the latter business type. In addition to the
level difference, the negative correlation of sales growth with local known COVID-19 cases is
much stronger for clothing stores, with a regression slope coefficient (std. err.) of -169.9 (38.57),
in comparison to building material and gardening stores with a slope (std. err.) of -40.72 (19.63). 12
This suggests that stronger local enforcement of lockdown restrictions in the case of clothing stores
when local COVID-19 spread was high had a larger effect than voluntary reactions of customers
and sellers in the case of building materials and gardening stores.
11
Appendix Figure B2 additionally contains a plot for gasoline stations, a second business type in the group of
essential businesses with moderate person-to-person interaction.
12
Gasoline stations, which were also essential and have a medium level of person-to-person interaction like building
material and gardening stores, exhibit a similar slope coefficient (std. err.) of -41.99 (17.38), see Figure B2 in
Appendix B. However, there is a large level difference, with gasoline stations suffering large declines in sales on
average, presumably due to lower demand for gasoline as people worked from home.
11Figure 4: Taxable Sales Losses by County for Building Materials and Garden Equipment
Notes: Each dot in the scatter plot represents one county in California. The taxable sales growth rate is the relative
change between 2019 Q2 and 2020 Q2 for building material and garden equipment stores. COVID-19 cases are the
cumulative confirmed cases per capita in the county by May 15th, 2020. A linear bivariate regression line is also
shown.
12Figure 5: Taxable Sales Losses by County for Clothing and Clothing Accessories Stores
Notes: Each dot in the scatter plot represents one county in California. The taxable sales growth rate is the relative
change between 2019 Q2 and 2020 Q2 for clothing and clothing accessories stores. COVID-19 cases are the
cumulative confirmed cases per capita in the county by May 15th, 2020. A linear bivariate regression line is also
shown.
When comparing two business types that were both considered non-essential, clothing
stores on the one hand and food services and drinking places (in Figure 6) on the other, one might
have expected a larger impact of COVID-19 on restaurants and bars, because social distancing in
these businesses seems harder than in clothing stores; both business types were generally allowed
to offer at least (curbside) pickup and delivery. However, the negative correlation between sales
growth and known COVID-19 cases is actually weaker for restaurants and bars, with a slope (std.
err.) of -45.21 (21.17). This is another indication suggesting that voluntary behavior change as a
reaction to local COVID-19 cases was not the main driver of industry and county differences in
sales declines.
13Figure 6: Taxable Sales Losses by County for Food Services and Drinking Places
Notes: Each dot in the scatter plot represents one county in California. The taxable sales growth rate is the relative
change between 2019 Q2 and 2020 Q2 for food services and drinking places. COVID-19 cases are the cumulative
confirmed cases per capita in the county by May 15th, 2020. A linear bivariate regression line is also shown.
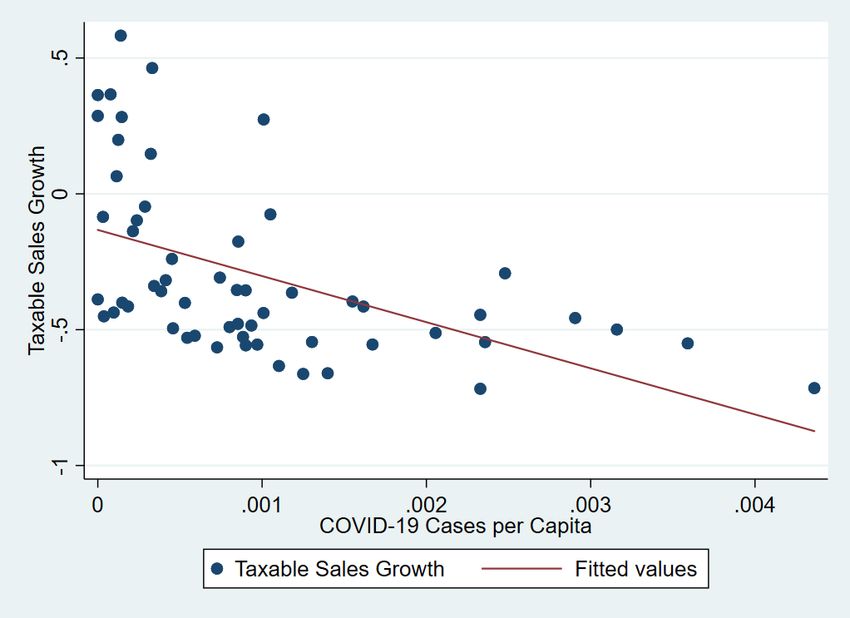
Finally, food and beverage stores (Figure 7) experienced an increase in sales on average,
in contrast to food services and drinking places, which is likely due to the fact that grocery stores
were deemed essential and subject to fewer lockdown restrictions. The negative association
between sales growth and COVID-19 cases is similar in both cases, however: the regression
coefficient (std. err.) for food and beverage stores is -58.27 (16.70). When weighting the
regressions by county population, the correlation is more negative for restaurants and bars with a
slope (std. err.) of -41.08 (0.0168) than for food and beverage stores with -16.98 (0.00883),
suggesting that the local enforcement of lockdown restrictions was important again. The
unweighted point estimate of the slope is steeper for grocery stores than for building material and
gardening stores, which were also considered essential. This suggests that voluntary reactions to
14the number of known local COVID-19 infections in case of the often more crowded grocery stores
played a role, but not a very large one.
Figure 7: Taxable Sales Losses by County for Food and Beverage Stores
Notes: Each dot in the scatter plot represents one county in California. The taxable sales growth rate is the relative
change between 2019 Q2 and 2020 Q2 for food and beverage stores. COVID-19 cases are the cumulative confirmed
cases per capita in the county by May 15th, 2020. A linear bivariate regression line is also shown.
3. Conclusions
Although it is well known that COVID-19 led to a massive shutdown of businesses in the second
quarter of 2020, surprisingly little is known about actual sales and revenues losses in the early
stages of the pandemic. Using administrative data from the California Department of Tax and Fee
Administration, we provide new evidence on sales losses among the universe of businesses by
detailed business types and locations. Normal year-over-year growth in taxable sales is 3-4 percent,
15but losses in sales were 17 percent in the second quarter of 2020 relative to the second quarter of
2019. Sales losses were largest in businesses affected by mandatory lockdowns such as
Accommodations at 91 percent. But, other types of businesses experienced large gains, such as
online sales, which grew by 180 percent as consumers substituted away from in-store purchases.
Placing business types into different categories based on whether they are “essential” or
“non-essential” (and thus subject to early lockdowns) and whether they have a moderate or high-
level of person-to-person contact, we find interesting correlations between sales losses and
COVID-19 cases per capita across counties in California. The findings across these different
classifications reveals that local implementation and enforcement of lockdown restrictions and
voluntary behavioral responses as reactions to the perceived local COVID-19 spread both played
a role, but enforcement of mandatory restrictions may have had a larger impact on sales losses.
The large losses in sales in the second quarter of 2020 for so many different types of
business but especially those shut down through mandatory restrictions are worrisome for the
longer-term survival of small, local businesses throughout the country. Although larger stores and
chains with a strong online presence may survive, many small businesses will not have the
resources to weather prolonged closures, continued reduced demand from health concerns, and a
more comprehensive recession. Just prior to the pandemic when small business owners were asked
what actions they would take if faced with a two-month revenue loss, 17 percent said they would
close or sell the business (Mills et al. 2020). Estimates from the weekly U.S. Census Small
Business Pulse Survey indicate that only 15-20 percent of businesses have enough cash on hand
to cover 3 months of operations (U.S. Census Bureau 2020; Bohn, Mejia and Lafortune 2020).
The government is considering future rounds of funds for the PPP program, and private
foundations and companies are promising to help. Can these programs help small businesses
survive the setbacks and shutdowns due to the coronavirus pandemic, or will more assistance be
needed? Furthermore, will an added shift in consumer behavior away from large online retailers
towards small businesses to fight longer-term trends be needed? States have promoted shopping
local (e.g. California’s #ShopSafeShopLocal) but can this counteract these trends? In the end,
getting the latest surge in the virus in check and the roll out of vaccines to lift restrictions and
restore customer, owner and employee confidence in health safety is likely the first real step to a
full recovery for small businesses.
16References
Bartik, Alexander W., Zoe B. Cullen, Edward L. Glaeser, Michael Luca, Christopher T. Stanton,
and Adi Sunderam. 2020. “The Targeting and Impact of Paycheck Protection Program Loans to
Small Businesses,” National Bureau of Economic Research Working Paper No. w27623.
Bloom, Nicholas, Robert S. Fletcher, and Ethan Yeh. 2021. “The Impact of COVID-19 on US
Firms” NBER Working Paper No. w28314.
Bohn, Sarah, Marisol Cuellar Mejia, and Julien Lafortune. 2020. “The Economic Toll of
COVID-19 on Small Business,” Public Policy Institute of California.
Desai, Sameeksha, and Jessica Looze. 2020. “Business Owner Perceptions of COVID-19 Effects
on the Business: Preliminary Findings,” Trends in Entrepreneurship, No. 10. Kauffman
Foundation.
Farrell, Diana, Chris Wheat and Chi Mac. 2020. “Small Business Financial Outcomes during the
Onset of COVID-19,” JPMorgan Chase & Co. Institute Report.
Fairlie, Robert. 2020. “The Impact of COVID‐19 on Small Business Owners: Evidence from the
First Three Months after Widespread Social‐distancing Restrictions,” Journal of Economics &
Management Strategy 29(4): 727-740.
Kim, Olivia S., Jonathan A. Parker and Antoinette Schoar. 2020. “Revenue Collapses and the
Consumption of Small Business Owners in the Early Stages of the COVID-19 Pandemic,”
NBER Working Paper No. w28151.
Mills, Claire Kramer, Jessica Battisto, Mels de Zeeuw, Scott Lieberman, and Ann Marie
Wiersch. 2020. Small Business Credit Survey, Federal Reserve Banks.
Parker, Simon C. 2018. The Economics of Entrepreneurship. Cambridge University Press
USAFacts. 2020. https://usafacts.org/visualizations/coronavirus-covid-19-spread-map/.
U.S. Census Bureau. 2018. “County Business Patterns Tables 2018”
https://www.census.gov/programs-surveys/cbp/data/tables.html
U.S. Census Bureau. 2020. “Small Business Pulse Survey,” https://portal.census.gov/pulse/data/.
17Appendix A: Supplementary Table
Appendix Table 1: California Taxable Sales Losses by Subsector Business Types
Percent Percent
Change Taxable Change Taxable
2019Q2 to Transactions 2019Q2 to Transactions
Business Type 2020Q2 Amount Business Type 2020Q2 Amount
Total All Outlets -17 152,362,296,481 Miscellaneous Store Retailers -17 4,418,659,674
Total Retail and Food Services -17 105,528,311,167 Florists -39 103,717,354
Office Supplies and Stationery Stores -22 642,964,260
Motor Vehicle and Parts Dealers -15 19,294,245,937 Gift, Novelty, and Souvenir Stores -58 197,790,991
New Car Dealers -16 13,661,226,032 Used Merchandise Stores -44 144,130,178
Used Car Dealers -27 2,017,580,937 Other Miscellaneous Store Retailers -8 3,330,056,891
Other Motor Vehicle Dealers 11 1,546,237,177 Nonstore Retailers 181 13,273,550,077
Automotive Parts, Access. and Tires -3 2,069,201,791 Food Services and Drinking Places -47 11,991,170,465
Furniture and Home Furn. Stores -18 2,625,229,637 Special Food Services -76 292,967,418
Furniture Stores -28 1,532,455,251 Drinking Places (Alcoholic Beverages) -86 65,185,094
Home Furnishings Stores 3 1,092,774,386 Full-Service Restaurants -61 4,454,731,382
Electronics and Appliance Stores -14 3,663,719,124 Limited-Service Eating Places -25 7,178,286,571
Building Material and Garden Equipme 12 12,248,068,380 Total All Other Outlets -19 46,833,985,314
Building Material and Supplies Deale 13 11,064,090,950 Agriculture, Forestry, Fishing and Hunting 40 325,549,091
Lawn and Garden Equipment and Su 7 1,183,977,430 Mining, Quarrying, and Oil and Gas Extraction -29 139,003,233
Food and Beverage Stores 2 7,584,295,812 Utilities 0 364,305,709
Supermarkets and Other Grocery Sto 5 5,209,119,995 Construction -17 2,305,307,376
Convenience Stores -12 841,092,239 Manufacturing -13 11,005,456,107
Specialty Food Stores -40 202,729,466 Wholesale Trade -17 18,392,665,466
Beer, Wine, and Liquor Stores 10 1,331,354,112 Transportation and Warehousing -40 408,491,412
Health and Personal Care Stores -11 3,414,123,225 Information -9 1,960,180,852
Pharmacies and Drug Stores 7 2,024,226,564 Finance and Insurance -6 340,123,180
Other Health and Personal Care Stor -28 1,389,896,661 Real Estate and Rental and Leasing -19 5,872,138,743
Gasoline Stations -47 7,737,896,946 Professional, Scientific, and Technical Service 0 1,893,493,925
Clothing and Clothing Access. Stores -54 4,744,372,982 Management of Companies and Enterprises -18 6,432,654
Clothing Stores -56 3,640,766,921 Administrative and Support and Waste Man. a -39 597,633,328
Shoe Stores -38 648,398,066 Educational Services -47 163,539,655
Jewelry, Luggage, and Leather Good -61 455,207,995 Health Care and Social Assistance -15 286,043,742
Sporting Goods, Hobby, Mus. Inst., Boo -20 2,010,965,666 Arts, Entertainment, and Recreation -83 188,119,522
Sporting Goods Stores 0 1,257,390,598 Accommodation -92 94,715,762
Hobby, Toy and Musical Instrument S -30 553,514,156 Other Services (except Public Administration) -31 2,145,100,206
Book Stores and News Dealers -55 200,060,912 Public Administration -11 103,363,587
General Merchandise Stores -10 12,522,013,242 Others 59 242,321,764
18Appendix B: Supplementary Figures
Figure B1: Taxable Sales Losses by County for All Outlets, Weighted by Population
Notes: Each dot in the scatter plot represents one county in California. The taxable sales growth rate is the relative
change between 2019 Q2 and 2020 Q2 for all outlets. COVID-19 cases are the cumulative confirmed cases per capita
in the county by May 15th, 2020. A linear bivariate regression line, weighted by county population, is also shown.
19Figure B2: Taxable Sales Losses by County for Gasoline Stations
Notes: Each dot in the scatter plot represents one county in California. The taxable sales growth rate is the relative
change between 2019 Q2 and 2020 Q2 for gasoline stations. COVID-19 cases are the cumulative confirmed cases per
capita in the county by May 15th, 2020. A linear bivariate regression line, weighted by county population, is also
shown.
20You can also read