KISS Guide to Evidence Based Medicine 2020 - NB Medical ...
←
→
Page content transcription
If your browser does not render page correctly, please read the page content below
KISS Guide to Evidence Based Medicine 2020
                            THE HOT TOPICS KEEP IT SIMPLE GUIDE TO….

                             EBM, RESEARCH TERMINOLOGY & STATS 2020
Many students, trainees and GPs have a fear of research, and its associated complex terminology and statistics. This is
no surprise as GPs generally prefer people to numbers, which is what attracts them to GP in the first place! But to help
patients through our clinical care and crucially to help to protect them from potential harm, understanding what the
terms and the numbers mean is vital to enable us to take a more evidence-informed approach to clinical care. Crucially,
it also empowers us with a more critical eye with which to review the literature and the exaggerated claims often made
for treatments in the media. Exam candidates commonly worry (it comprises 10% of the AKT of the MRCGP exam) but
with some simple tools and knowledge you can pick up easy marks here.

What is evidence-based medicine?

Definitions vary, but possibly the best is: ‘EBM is defined as the integration of the best available evidence with our
clinical expertise and our patients’ unique values and circumstances’ (Strauss and Haynes, EBM200712:1). So,
whilst the maths and statistics are important just as important are your clinical judgement and the patient’s wishes. The
evidence may say that your patient would benefit from drug X, but if your clinical judgement is that it would be unsafe or
she does not want to take it, you are still practising EBM by not prescribing.

EBM then involves a 3 step approach of:

   Asking an answerable clinical question e.g. using PICO (see below)
   Gather the evidence and critically appraise it (see critical appraisal below)
   Making a decision by integrating this evidence with your clinical opinion and the patient’s values and circumstances,
   using a shared decision-making approach

Despite this definition of EBM which clearly incorporates clinical judgement and patient values, a culture has developed
over the years whereby evidence can seem to ‘trump’ clinical judgement or patients are not enabled to make truly
informed decisions. It also can be criticised for being overly simplistic, in that most clinical questions (especially in
patients with multimorbidity) cannot be distilled down to a single answerable question. Each patient and each clinical
encounter are unique, and however good a clinical trial is it will never tell you with certainty whether a drug or
intervention will help the patient sitting in front of you. Clinical practice, especially in primary care, is inherently
complicated and ‘messy’. For this reason, many GPs prefer the term ‘evidence informed’ medicine , and this is very
much the ethos we follow at NB Medical Education: clinical care should be patient-based first and foremost but
informed by the best quality evidence .

What follows is the NB Medical Education ‘Hot Topics’ guide to research terminology and medical statistics. It
explains the terms (in alphabetical order) and will give you some simple tools for appraisal and statistical
calculations, at the level you would need to do for the MRCGP exam.

For more detailed information, we would strongly recommend GP Dr Chris Cates’ excellent site www.nntonline.net and
the CEBM pages.

                                            www.nbmedical.com
Absolute risk and absolute risk reduction (ARR)

The absolute risk is the actual, arithmetic risk of an event happening. The ARR (sometimes also called the Risk
Difference ) is the difference between 2 event rates e.g. AR of a MI with placebo over 5 years is 5% and with drug A is
3%, the ARR is simply 2%. This is the difference between the CER (control event rate) and the EER (experimental
event rate). Knowing the absolute risk is essential when deciding how clinically relevant a study is, especially as relative
risk (see below) can make an intervention seem much more effective than it is. For example, a drug may be claimed to
reduce the risk of MI by 50% based on relative risk reduction; this sounds very impressive result, but if the absolute risk
reduction is only from 0.2% to 0.1% t seems much less so...See also NNT.

Allocation Concealment

This is considered by many to be the most important thing to check when appraising a RCT. To minimise bias in a
blinded RCT it is essential that patients are allocated completely at random between the two groups. Researchers must
conceal which group the patients will be allocated to from their clinicians, otherwise, the clinicians will inevitably distort
the randomisation process and it is no longer truly ‘blind’. For example: if patients in our clinic were being entered into a
RCT of antibiotic vs. placebo for acute cough, and we could tell which group our patient was going to be allocated to we
would naturally want our sicker patients to go into the antibiotic group and the not-so-sick ones into the placebo group.
So, researchers have to conceal allocation from the clinicians to avoid bias.

BRAN

A relatively new acronym for some, BRAN stands for four questions patient and clinician should ask when making a
shared clinical decision on a treatment or intervention, after they have accessed and appraised the evidence:
B : what are the Benefits?
R : what are the Risks?
A : what are the Alternatives?
N : what if I do Nothing?
This approach is recommended by the Choosing Wisely UK, part of a global movement to minimise ‘overdiagnosis’ (the
unnecessary and potentially harmful overuse of tests, treatments and medical interventions)

Case-control study

A retrospective, observational study type that helps answer questions about aetiology and potential harms of
interventions. Cases and a ‘matched’ control group are identified, and the retrospective exposure of interest between
the two groups is identified. Example: is mobile phone use associated with brain tumours? Patients with brain tumours
and a control group would have their retrospective mobile phone use studied to see if there were an association. It
allows odds ratios to be calculated but not absolute risks. It provides a higher level of evidence than a case-series ,
which does not have a control group, but less than a prospective cohort study. Confounding factors are difficult to
control for but is useful for looking for very rare events. Case-control studies may also be ‘nested ’ within the same
group. See ‘nested case-control’.

                                             www.nbmedical.com
Cates Plot
Developed by GP and EBM expert Dr Chris Cates (see www.nntonline.net) these are the ‘smiley face’ pictograms which
show the overall absolute benefits and harms of interventions to visually communicate the risks and benefits of
treatment based on numbers needed to treat (NNT) and harm (NNH). See Cates Plot for more information, and
example below. These can be very useful for communicating absolute benefits and risks to patients.
Classes of recommendations
You commonly see this in guidelines – often together with levels of evidence, below – to give you an idea of the
strength of a recommendation. See also ‘levels of evidence’.
Class 1 General agreement and consensus that the It is recommended
treatment is beneficial, useful, effective
Class 11 Conflicting evidence and divergence of opinion. Class 11a: weight of evidence & opinion is
in favour, intervention should be considered
Class 11b: less strong, intervention ‘may’ be
considered
Class 111 General agreement and evidence that the It is not recommended
intervention is not beneficial and may even be
harmful
Cluster randomisation
You often see ‘cluster randomised controlled trials’ in primary care research – what are they? Simply, it means a natural
group, or cluster, which is randomized to the same intervention and then compared to a control group. A cluster may be
a family, a school, an area or (commonly) a group of GPs or practices which are then compared to another group.
Cohort study
A prospective observational study that helps answer questions about aetiology and prognosis. It identifies a cohort of
patients who receive the exposure of interest (e.g. they live near high voltage power cables) and a matched control
group who do not, and they follow them for a long period of time to see if there is a difference in the incidence of the
outcome of interest (e.g. development of leukaemia). The most famous cohort study of all established the link between
the higher incidence of lung cancer in a cohort of doctors who smoke versus one that did not. Cohort studies give a
higher level of evidence than a case-control study but are more expensive, difficult and time-consuming. They are lower
down the evidence hierarchy than a RCT, but are cheaper and simpler and for many research questions a RCT is not
practical.
www.nbmedical.comComparison intervention
When critically appraising a randomised control trial for a new drug or treatment, carefully assessing what it has been
compared to (the comparison intervention) is vital. If it has been compared to placebo and found to be superior, that is
useful information and a positive outcome. However, if the condition it is treating already has a number of evidence-
based effective treatments, you still unable to say if it is better or worse than these established treatments (although you
can try via a Network Meta-Analysis , see below). If the comparison intervention is another established treatment, is it
an optimal treatment at optimal dose that it has been compared to? Pharmaceutical companies can be guilty of funding
research studies of new drugs against sub-optimal comparators, thus giving a greater chance of a positive outcome.
Also, see PICO below.
Composite end-point
Ideally, studies should have a single, clear end-point e.g. does drug A reduce mortality, or does drug B improve quality
of life scores. Often however studies will have a composite end-point, which includes a number of different criteria. For
example, the SHIFT study looking at ivabradine or placebo for heart failure has a composite end-point of mortality and
hospital admissions for heart failure. This is typical. Obviously the more factors that are included in the end-point, the
more likely it is to have a positive result but the conclusion will be less ‘clean’. For example, the SHIFT study had a
positive result for the composite end-point, but closer analysis reveals this was driven by a reduction in admissions and
there was no difference in mortality rates.
Confidence Intervals (CI)
Very useful! You can tell a lot about a study from the CI. A CI is a range of numbers within which there is a 95%
chance that the true result lies . So if the result is a NNT 30 (95% CI 12-56) it tells us that the result of this trial is a
NNT of 30 but the true result could lie anywhere between 12 and 56 i.e. if we repeated this trial 100 times, 95 times the
result would lie between 12 and 56.
With CI you can easily tell if statistical significance has been reached, without doing any maths! If the CI includes the
value that reflects ‘no-effect’ the result is statistically non-significant. This value of no-effect is obviously 1 for results that
are expressed as ratios (e.g. Relative Risk, Odds Ratio) and 0 for measurements (e.g. NNT, percentages or ARR).
So, CI give two very useful bits of information: firstly, they tell us if a result has reached statistical significance, like a p
value does, but they also give us an idea of the precision of the result. A wide CI means a less precise result and a
narrow CI a more precise result. Generally speaking the larger the numbers in the study, the smaller the CI and the
more sure you are that the result is true. This is why meta-analyses are considered at the top of the evidence hierarchy
because they have tighter CI.
Confounding variable
Important to consider when appraising a study, confounding variables are factors that you are not actually interested in
but will affect the result and create bias. They should be spread equally amongst the control and experimental groups
but are very difficult to control for, especially in observational studies. A classic example is that for years doctors thought
that hormone replacement therapy (HRT) reduced the risk of cardiovascular disease, because observational studies
showed that women who took HRT had a lower incidence of CVD. However, when large scale randomised controlled
trials were done this benefit was NOT seen. A significant confounding variable was that in the observational studies,
healthier women from less deprived areas were more likely to be taking HRT. Observational studies can give a lot of
useful information, but because of the problem of confounding variables they can only every show association and not
prove causation.
www.nbmedical.comControl Event Rate (CER)
The rate at which events occur in the control group e.g. in a RCT of aspirin v placebo to prevent MI, a CER of 10%
means that 10% of the placebo group had a MI. It is sometimes represented as a proportion (10% = 10/100= 0.1). See
Experimental Event Rate.
Critical Appraisal
There are many elements to critically appraising a research paper, but (keeping it simple!) the three fundamental
questions to ask yourself are:
Is this study asking a clinically important, relevant and focused question?
Is the study valid to answer this question?
Is it the correct study type to answer this question and is the methodology sound?
Is the result relevant?
Are the results statistically significant and clinically important?
Particularly important in primary care is asking if the study population is relevant and therefore applicable to my
particular patient?
Another approach is to ask yourself these 3 ‘significant’ questions :
Is it statistically significant?
Is it clinically significant?
Is it significant to the patient sitting in front of you?
Following this, you then have to undergo a shared decision making process with your patient. See BRAN above. For
more detail on how to appraise different study types, see CEBM Appraisal Tools.
Cross sectional study or survey
An observational study that observes a defined population at a single point in time or time interval and measures the
prevalence of risk factors. Cheap and simple but subject to bias.
Descriptive studies
What they say on the tin. These include case reports, case series, qualitative studies and surveys. At the bottom of the
evidence hierarchy, but can produce useful learning points and can help answer some of the questions that RCTs or
systematic reviews cannot.
Diagnostic validation study
Answers questions about the efficacy of a diagnostic test, symptom or sign. Expresses results using LR, sensitivity and
specificity. See sensitivity below.
Diagnostic odds-ratio (DOR)
Used when evaluating diagnostic tests. The DOR is the odds of a positive test in patients with the disease, compared to
the odds of a positive test in those without the disease e.g. if the DOR is 6, the odds of having a positive test are 6
times higher in someone with the disease than in someone without.
www.nbmedical.comEnd-point
Another important point to appraise when looking at a RCT, both for the validity and relevance of the study, is: what was
the pre-defined end-point that the study was looking at? Was it a clinically relevant end-point (e.g. a bone fracture) or a
surrogate end-point (e.g. reduced bone mineral density)? Is the trial reporting the result of the principal, pre-defined
end-point of the study or is it reporting sub-group analyses or secondary end-points ? If it is a composite end-point ,
what does that include (it may lump together a number of outcomes of varying clinical significance, so the overall
endpoint may be reached but would the result have been positive if only the most clinically significant event were
included?)
Experimental Event Rate (EER)
The rate at which events occur in the experimental group e.g. in the CER example above, an EER of 9% (or 0.09)
means that 9% of the aspirin group had a MI.
Exclusion criteria
Essential information when appraising a RCT for relevance to your patient. This is very pertinent in primary care where
often we see patients with co-morbidity, and these tend to be excluded from RCTs. For example, an early statin study
showed an increase in breast cancer cases (CARE study), and since then all patients with a previous history of cancer
have been excluded from statin trials. Is a recent statin study applicable then to the patient in front of you with a recent
history of cancer?
Follow-up
Very important when appraising a RCT, is looking for drop-out rates. If the drop-out rates are high, how confident can
you be in the final results? What if all the drop-outs had a bad outcome? If less than 80% are followed up it is generally
recommended that the result is ignored.
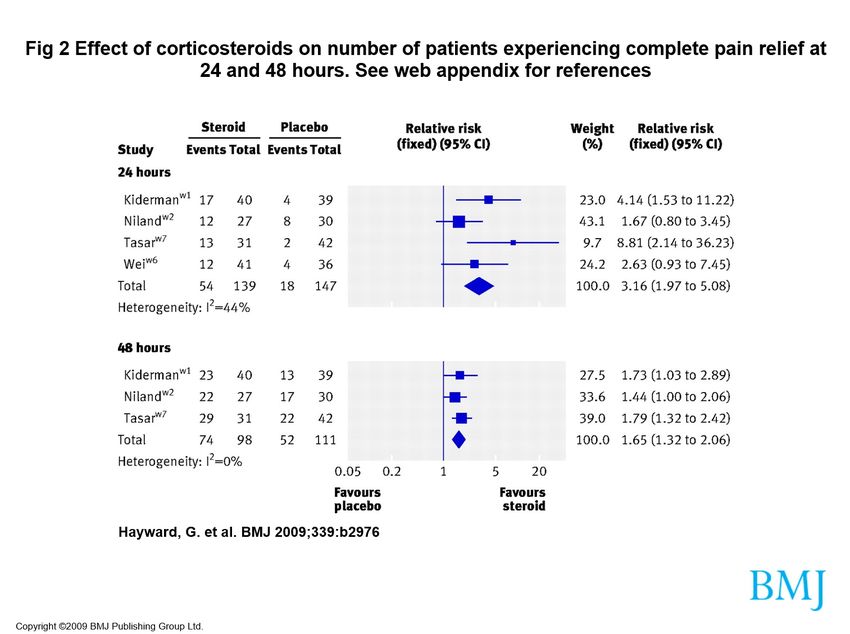
Forest Plot
The pictorial representation, also known as a blobbogram, of the results of a meta-analysis. You know what these look
like and they are very, very useful as they give you rapidly accessible information. For example, see below from a study
looking at steroids in acute sore throat. Just by ‘eyeballing’ the plots below you can tell in about 10 seconds that
although individual studies have shown conflicting results, and half of them have not reached statistical significance, but
pooling the results together gives a statistically significant result in favour of steroids with a narrow CI. If unsure how,
read on...
www.nbmedical.comForest plots are easy and very useful to interpret. Each individual study should be annotated, and it has a square, or
‘blob’, with a horizontal line representing the 95% CI. The blob in the middle is the reported result of the study, and the
relative size of it represents the weighting that this individual study has in the overall analysis. The vertical line down the
middle is the ‘line of no effect’, which for a ratio is 1. Studies are statistically significant if the CI line does not cross the
value of no-effect i.e. the vertical line. If the horizontal line of the study crosses the vertical ‘line of no effect’ it is non-
significant. The overall result pooled by meta-analysis is represented by a diamond, the length of which represents the
CI. If the diamond does not cross the line of no effect, this is a positive result. If it does, it means the overall result is
non-significant. See also meta-analysis.
Funnel Plot
A method of graphing results in a meta-analysis to see if the results have been affected by publication bias.
Hazard ratio
A way of expressing the relative risk of an adverse event i.e. if an adverse event was twice as likely to happen with a
particular intervention, it would have a HR of 2.
Heterogenicity
This is important when appraising systematic reviews. Consider how heterogeneous the results are both clinically and
statistically. Clinically you have to use your judgement to see how heterogeneous the studies are to warrant combining
them (e.g. is a systematic review of sinusitis that includes groups of patients with just facial pain and those with a CT
scan confirmed diagnosis valid?). Statistically consider if the individual results contradict each other. This can be
assessed by ‘eye balling’ the Forest plot. Experts use formal statistical tests such as the Cochran Q (chi-squared) test to
do this.
Incidence
The percent of a population who will develop a disease during a specified interval e.g. a study that found an incidence
of chlamydia amongst new college students was 2% per annum, means that 2% of the students contracted chlamydia
during the year.
Intention to treat
This is a method of analysing results of a RCT which is intended to minimize bias. It is very counter-intuitive! If a patient
is allocated drug B at the start of the trial, at the end he must be included in the drug B group for the final analysis EVEN
IF he never ended up taking drug B or even switched to drug A or C. It happens quite often that patients have to drop-
out or swap drugs during a trial but they have to be analysed according to how they were intended to be treated at the
beginning. Otherwise researchers could pick and choose who makes it or not to the final analysis which would bias
results. Intention to treat ensures that the original randomized groups remain comparable. The alternative (‘per
protocol analysis’), is known to cause bias.
www.nbmedical.comKaplan-Meier Plot
A simple graph very commonly used in clinical trials to represent the time to an event (e.g. MI), or survival rates of
participants as they move through time. Time on horizontal access, percentage reaching primary end point on vertical
axis, curves in different colours represent experimental and control groups. See below for an example comparing
medical therapy to coronary intervention in stable angina.
Lead-time bias
This is important in prognosis studies. Detecting disease early does not necessarily improve mortality. If patients
are not all recruited at a similar stage of the disease differences in outcome over time may just reflect earlier diagnosis
e.g. a study that shows apparent improved survival in breast cancer: have the patients really lived longer, or actually
died at the same time but just been aware for longer of the diagnosis? (e.g. Imagine two women develop breast cancer
aged 50. Woman A is diagnosed by screening at age 52. Woman B is not screened, and the cancer manifests clinically
at age 56. Both women die aged 60. Screening appears to improve survival with breast cancer from 4 years to 8 years,
but in fact has just diagnosed it earlier)
Levels (or hierarchy) of evidence
Frequently used in guidelines to grade the strength of recommendations. Variable, but a general guide is:
Grade of Level of Which means…
recommendation evidence
A 1a to 1c Syst review of RCTs, or RCT with narrow CI
B 2a to 3b Syst review of cohort or case control studies, or good quality cohort or
CC studies
C 4 Case series, poor quality cohort and case control studies
D 5 Expert opinion, or based on physiology or ‘first principles’
Likelihood ratio
A measure used in studies looking at diagnosis. It tells us how useful a test, symptom or sign is for establishing a
diagnosis and is considered the most useful overall measure of its efficacy. Example: a study is looking at a new near-
patient test for streptococcal throat, the LR is the ratio of the probability of a positive result amongst patients who really
do have strep throat to the probability of a positive result in patients who do not have strep throat.
www.nbmedical.comMeta-analysis
A statistical technique used to integrate the quantitative results of pooled studies, for example in a systematic review.
For mathematical reasons, they tend to express the results in terms of odds ratios. See systematic review.
Negative predictive value
See positive predictive value, sensitivity and specificity below.
Nested case-control study.
This is a case control study which is ‘nested’ within a defined cohort. Cases of a disease which occur within this cohort
are identified and compared to matched controls within the same cohort which do not develop the disease. Although a
less robust level of evidence than a cohort study, they are cheaper and easier to do than a full cohort study and can
help answer useful questions about factors which contribute to the development of a condition. For example, an
excellent recent nested-case control study looked at death in patients with epilepsy (BJGP2011;61;341). The cohort was
patients diagnosed with epilepsy, cases were identified who died and for each of these two controls with epilepsy were
selected who were still alive. Cases and controls are then matched for age and sex and the researchers then identify
factors which are associated with death in epilepsy.
Network meta-analysis
This is a form of meta-analysis whereby indirect comparisons are made between multiple different treatments. Networks
of RCTs are analysed together, permitting inferences into the comparative effectiveness of different treatments which
may not have been directly compared with each other. Put simply, if drug A was compared to B in one trial, and then
drug C to D in another, then using this technique you could comment on the comparative effectiveness of A vs D even
though they have not been directly compared with each other. This makes this technique potentially very useful when
looking at conditions with multiple treatment options, and this form of meta-analysis is increasingly used to compare
comparative effectiveness of different treatments for the same condition e.g. a recent study to compare effectiveness of
different asthma treatments BMJ2014;348;g3009 The strength of this approach is that effects estimated from direct
comparisons within individual trials are combined with indirect, non-randomised comparisons between different trials but
at a cost of potentially increasing heterogenicity and confounding factors. The methodology of this is complex, see
BMJ2013;346:f2914 and is beyond our scope, but we need to have an idea of what it is and what it’s for!
‘Non-inferiority trials’ and ‘Equivalence’ trials
These are trials specifically designed to see if the new drug is ‘no worse than’ or at least ‘as good as’ the standard
treatment. Non-inferiority trials require smaller sample sizes, are cheaper and quicker to do and less likely to produce
disappointing results for new drugs so are increasingly used in Pharma sponsored research!
Number needed to treat or harm (NNT and NNH)
A clinically useful measure of the absolute benefit or harm of an intervention expressed in terms of the number of
patients who have to be treated for one of them to benefit or be harmed. Calculated as 1/ARR. Example: the ARR of a
stroke with warfarin is 2% (=2/100 = 0.02), the NNT is 1/0.02 = 50. e.g. Drug A reduces risk of a MI from 10% to 5%,
what is the NNT?. The ARR is 5% (0.05), so the NNT is 1/0.05 = 20. Chris Cates’ site NNT On-line has a fantastic
Visual Rx calculator which will calculate a NNT for you based on odd ratios or relative risk, and then show you a nice
‘smiley face’ Cates plot .
www.nbmedical.comObservational study What it says on the tin…In an observational study, the investigators have not assigned treatments or interventions to particular groups. They observe and analyse outcomes of predetermined treatments or interventions. This can be based on data that is retrospective (case control study), prospective (cohort study) or current (cross sectional). See each of these for more information. Observational studies can yield incredibly useful data and you often hear the fact that they are based on ‘real life’ data as a positive. However, they can never eliminate bias and confounding variables. Observational studies can show associations but not prove causation, and thus are a ‘lower’ form of evidence compared to unlike experimental studies such as randomized controlled trials. Odds ratios Is another way of expressing a relative risk and is simply the odds of an event (either beneficial or harmful) happening versus it not happening. For statistical reasons they are favoured in meta-analysis and case-control studies. They are calculated from the CER and EER e.g. consider a trial of a new drug. 10 out of 200 patients died in the control arm. 5 out of 200 died in the treatment arm. What are the odds of death in the treatment arm? The EER is 5/200 i.e. 2.5% which is 0.025 What are the odds of death with control? The CER is 10/200 i.e. 5% which is 0.05 What is the OR of the study? This is the ratio of the odds, i.e. 0.025/0.05 = 0.5 i.e. the treatment halves the risk of death compared to control Odds ratios can be converted into an absolute measure such as NNT, provided all the baseline data are known, but this is complicated and you will not be asked to do it in the AKT! You can convert OR to NNT using the ‘visual treatment calculator’ on-line at www.nntonline.com or at www.cebm.net P value A measure that an event happened by chance alone e.g. p = 0.05 means that there is a 5% chance that the result occurred by chance. For entirely arbitrary reasons p
Positive predictive value (see also sensitivity and specificity)

When examining the sensitivity and specificity of a diagnostic test (see below for these), the PPV is the percentage of
patients who test positive for condition X who really do have condition X, and the negative predictive value NPV is the
percentage who test negative who really do not have it. Importantly these are dependent on the background
prevalence of the disorder in the population . If a disease is rare, the PPV of a positive test will be lower (but
sensitivity and specificity remain constant). So often with tests the PPV is higher in a secondary care or sieved
population than it is in primary care. So, taking a recent example, when testing symptomatic patients in hospital for
coronavirus during the 2020 covid-19 pandemic a positive test will have a much higher PPV than a positive test from an
asymptomatic ‘screened’ population in the community. The likelihood ratio takes this into account and gives the most
accurate information on test accuracy.

Pragmatic Clinical Trial

What it says on the tin. This is a RCT which is based in patients usual care settings, without rigorous exclusion criteria
and often using non-blinded treatments which can be flexibly given or used according to clinical need. The aim is to
produce a research setting which more closely mimics ‘real life’ care and ‘real’ patient populations. Such a trial is also
likely to be easier and cheaper to do. The downside of course is that because it is less controlled it will be more subject
to bias.

Prevalence

The probability of a disease in a population at any one point in time. Example, the prevalence of diabetes in the
population is 2% simply means that 2% of the population at the time of the study have diabetes. See incidence.

Publication bias

An important source of bias. Negative trials are just as valid as positive ones, but are less likely to be published.
Systematic reviews should search for all data, including unpublished, to try and eliminate this. Also occurs in a SR if the
search for studies is incomplete.

Qualitative study

Qualitative studies are inherently different from quantitative studies which are based on data. Qualitative studies use
observation and interview to shed light on beliefs, thoughts and motivations. They can help ‘fill the gaps’ in knowledge
that numbers cannot answer. For example, why do parents worry so much about fever in children? Why do men want a
PSA test? Although by definition they are qualitative rather than quantitative, and tend to be small, they should still be
designed in a rigorous and systematic way.

Randomized control trial (RCT)

Obviously, the gold standard study type for answering questions about treatment, and the best way of minimizing bias
and confounding variables. An ‘experimental’ study that can be used to test hypotheses that may have been generated
by ‘observational’ studies, such as cohort studies. But for RCTs very large numbers are needed to find a difference in
rare events, so they prone to type 1 and 2 errors . Also very expensive, so often funded by manufacturers with strong
vested interests in the outcome.

                                            www.nbmedical.com
Relative risk, Relative risk reduction (RRR) and Risk Ratio (RR)
The relative risk, or risk ratio , is the ratio of the risk of an event in experimental group compared to the control group
i.e. RR = EER/CER. The RRR is the proportional reduction seen in an event rate between the experimental and control
groups. For example if a drug reduces your risk of an MI from 6% to 3%, it halves your risk of a MI i.e. the RRR is 50%.
But note that the ARR is only 3%.
Relative risks and odds ratios are used in meta-analyses as they are more stable across trials of different duration and
in individuals with different baseline risks. They remain constant across a range of absolute risks. Crucially, if not
understood, they can create an illusion of a much more dramatic effect. Saying that this drug reduces your risk of a MI
by 50% sounds great; but if your absolute risk was only 6%, this is the same as reducing it 3%. So, saying this drug
reduces your risk by 50% or 3% are both true statements but sound very different, so guess which one that drug
companies tend to prefer!
However relative risks are still useful to know as you can then apply them yourself to an individual’s absolute risk. So, if
you know an intervention reduces the relative risk by a third, you can easily calculate and inform your two patients with
a 30% and a 9% risk of heart disease that the intervention will reduce their individual risk by about a third i.e. to 20%
and 6% respectively.
Relative risk increase (RRI) similarly describes increases in rates of bad events in a trial or the development of a
disease in a cohort study.
Risk difference . See Absolute Risk
Sensitivity and specificity (and positive and negative predictive values)
In diagnostic studies, sensitivity is the probability of a positive test amongst patients with the disease. A very sensitive
test will have few false negatives and be good at picking up disease. Specificity is the probability of a negative test
among patients without the disease. A very specific test will have few false positives and be good at ruling a disease
out. SnNOUT means if a test is very Sensitive (Sn ) a N egative test rules the diagnosis out . SpPIN means if a test is
highly Specific (Sp ) a P ositive result rules the diagnosis in .
Imagine a new test for whooping cough. The results are presented as:
Test Result
Present Absent
Positive a b
Negative c d
The sensitivity of the test is a/a+c; the specificity of the test is d/b+d
The positive predictive value (PPV) of the test is a/a+b; The negative predictive value NPV of the test is d/c+d
The PPV is the percentage of patients who test positive for Bordetella who really do have it, and the NPV is the
percentage who test negative who really do not have it. Importantly these are dependent on the background
prevalence of the disorder in the population . If a disease is rare, the PPV will be lower (but sensitivity and specificity
remain constant). So often with tests the PPV is higher in a secondary care or sieved population than it is in primary
care. The likelihood ratio takes this into account and gives the most accurate information on test accuracy.
www.nbmedical.comSystematic review (SR)
A paper in which the authors have systematically searched for, appraised and summarized all the known literature
(including non-published studies) on a topic. Quantitative reviews then use the statistical method of meta-analysis to
synthesize the pooled results. This creates statistically powerful studies with narrow CI. Compared to individual studies
this improves the precision of the result, increases confidence that the result has not occurred by chance and reduces
the chance of type 1 and 2 error (see below). They are critically dependant on the quality of the studies that are included
(rubbish in=rubbish out) and can sometimes be blunt tools for looking at some of the very specific problems seen in
primary care.
Type 1 and 2 error
A Type 1 error occurs if a result is statistically significant, but this is a chance finding and in fact there is no real
difference. A Type 2 error occurs if the study finds no-significant difference when in fact there is a real treatment
difference. Small studies with wide CI are prone to these errors.
If you see an unexpected positive result (e.g. a small trial shows willow bark extract is effective for back pain) think:
could this be a type 1 error? After all, every RCT has at least a 1 in 20 chance of a positive result and a lot of RCTs are
published…
If a trial shows a non-significant result, when perhaps you might not have expected it, think could this be a type 2 error?
Is the study under-powered to show a positive result? Systematic reviews, which increase study power and reduce CI,
are therefore very useful at reducing Type 1 and 2 error.
Dr Simon Curtis
Medical Director, NB Medical Education
‘Hot Topics’ education, courses and CPD for primary care healthcare professionals
www.nbmedical.com
June 2020
www.nbmedical.comYou can also read