Broadband Coverage in Europe 2017: Coverage in Switzerland June 2018 - Glasfasernetz Schweiz
←
→
Page content transcription
If your browser does not render page correctly, please read the page content below
Broadband Coverage in
Europe 2017:
Coverage in Switzerland
June 2018

 James Joiner
 Senior Analyst

                  Technology Media Telecom | Final Report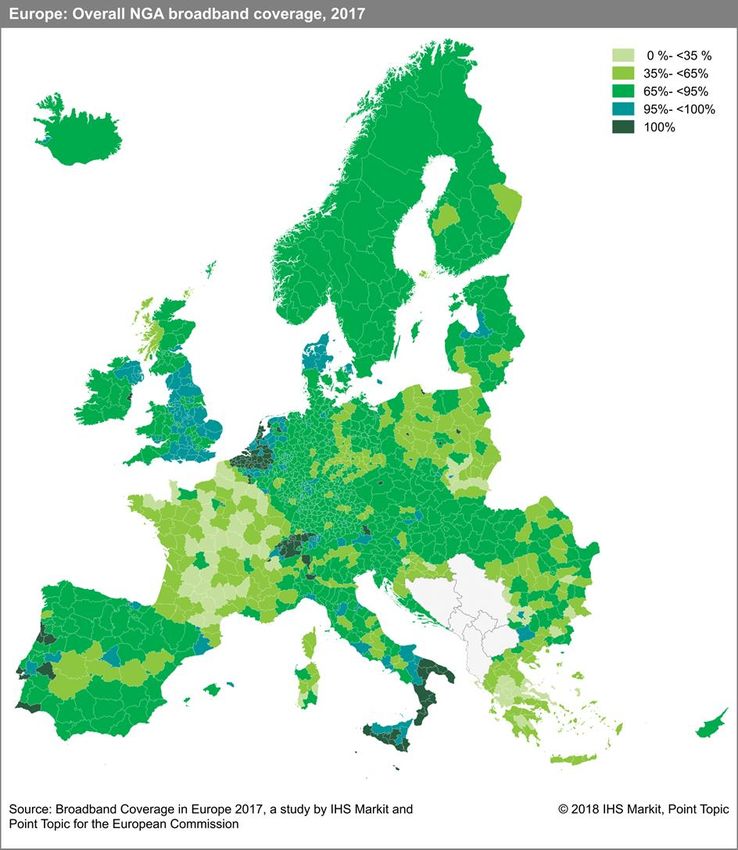
IHS Markit | Broadband Coverage in Europe 2017: Coverage in Switzerland Contents 1.0 Introduction 3 2.0 European Overview 6 2.1 Country comparison of overall broadband coverage 6 2.2 Country comparison of fixed broadband coverage 7 2.3 Country comparison of NGA coverage 8 2.4 Country comparison of speed categories 12 2.5 NUTS 3 coverage of overall fixed broadband 15 2.6 NUTS 3 coverage of NGA broadband 16 3.0 Switzerland 17 3.1 National coverage by broadband technology 17 3.2 Regional coverage by broadband technology 20 3.3 Data tables for the Switzerland 20 4.0 Methodology 23 4.1 Survey design and data collection 23 4.2 Defining households and rural areas 24 4.3 Additional research conducted in parallel to the survey 24 4.4 Validation and integration of data 25 4.5 Estimating coverage for different technology combinations 25 4.6 Estimating coverage for speed categories 27 © 2018 IHS Markit. All rights reserved. 2 June 2018
IHS Markit | Broadband Coverage in Europe 2017: Coverage in Switzerland

1.0 Introduction

In order to foster the development of network-based knowledge economy and stimulate growth the
European Commission has been promoting strategies to encourage digital opportunities and enhance
Europe’s leading position in digital economy. In May 2015, the Digital Single Market (DSM) strategy
was adopted to eliminate online barriers which hamper free movement of goods and services online.
Businesses, governments and individuals are inhibited by operating across 28 different regulatory
environments and cannot fully benefit from the emerging digital tools available to them.

The European Commission estimates that once completed, a DSM could create up to €415 billion per
year and generate hundreds of thousands new jobs. The DSM strategy is based on three pillars:

     1. Access: better access for consumers and businesses to digital goods and services across
        Europe;
     2. Environment: creating the right conditions and a level playing field for digital networks and
        innovative services to flourish;
     3. Economy & Society: maximising the growth potential of the digital economy.

However, in order for the consumers, businesses and governments to fully benefit from the provisions
of the DSM, it is essential that access to digital infrastructure is ensured by facilitating roll out of reliable
high-speed broadband networks across Europe.

In 2010, the Digital Agenda for Europe (DAE) was drawn as one of the flagship initiatives of the Europe
2020 strategy and included specific broadband coverage targets stretching to 2020:

     •     Universal broadband coverage of speeds above 30 Mbps by 2020
     •     50% broadband coverage of speeds above 100 Mbps by 2020.

The Digital Scoreboard serves as a tool for assessing progress towards these targets. Broadband
availability metrics are also a component of the Digital Economy and Society Index (DESI) that
summarises indicators on Europe’s digital performance and Member States digital competitiveness.
One of DESI’s five dimension measures focuses on connectivity and measures the deployment and
quality of broadband infrastructure.

In order to monitor the progress of the broadband networks deployment across the Member States, DG
Connect (the European Commission Directorate General for Communications Networks, Content and
Technology) has commissioned the Broadband Coverage in Europe (BCE) project. This examines
household coverage of all the main fixed and wireless broadband technologies with a specific focus on
Next Generation Access (NGA) technologies. In 2013, DG Connect selected the consortium of IHS
Markit & VVA to run the three-year project. In 2016, IHS Markit partnered with the previous research
provider of the BCE study, Point Topic, and was subsequently chosen to continue to deliver the
broadband coverage research for the period 2016-2018.

The European Commission publishes and analyses the data in the Digital Scoreboard, which can be
explored using the European Commission’s visualisation tool. A number of broadband coverage
indicators are also included in the Digital Economy and Society Index (DESI) and the European
Semester related country assessments. In order to align reporting of the broadband coverage data with
the publications of the DESI, the broadband coverage data collection has been scheduled to reflect the
situation at the end of June (i.e. thalf-year data rather than year-end data points are collected). This
change was first implemented in the 2015 edition of the BCE study and has been continued since then.

© 2018 IHS Markit. All rights reserved.                               3                                 June 2018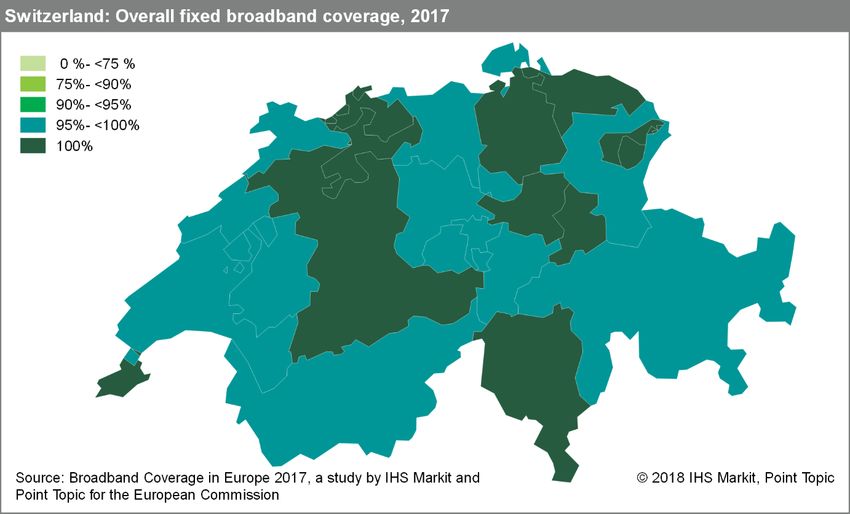
IHS Markit | Broadband Coverage in Europe 2017: Coverage in Switzerland

As in previous years, the study is primarily based on a survey of broadband network operators and
National Regulatory Agencies (NRAs) to obtain a Europe-wide picture of the coverage of the nine main
broadband technologies. The study was to cover thirty countries including the EU28, Norway, and
Iceland. A separate study was commissioned by Glasfasernetz Schweiz to conduct identical research
of broadband coverage in Switzerland. This report presents results of this additional research as well
as Europe-wide overview of the broadband coverage trends at the end of June 2017.

The nine broadband technologies analysed in this study are:

     •     DSL (including VDSL)
     •     VDSL
     •     Cable modem (including DOCSIS 3.0)
     •     DOCSIS 3.0
     •     FTTP (Fibre-to-the-property)
     •     WiMAX
     •     HSPA
     •     LTE
     •     Satellite

Coverage of these technologies is reported on national and rural level based on the number of homes
passed by each individual technology.

The study also aims, as requested by DG Connect, to estimate the overall coverage of “combination”
of technologies accounting for the overlap of the different technologies capable of delivering a
comparable level of performance. The combination categories included in this study, and similar to
previous years, are:

     •     Overall broadband coverage
              o Includes all the main broadband technologies, both fixed and mobile, but excludes
                   satellite
              o Combination of DSL (including VDSL), cable modem (including DOCSIS 3.0), FTTP,
                   WiMAX, HSPA and LTE

     •     Overall fixed broadband coverage
              o Includes all the main fixed-line broadband access technologies, but excludes satellite
              o Combination of DSL (including VDSL), cable modem (including DOCSIS 3.0), FTTP,
                    and WiMAX

     •     Next Generation Access (NGA) coverage
              o Includes fixed-line broadband access technologies capable of achieving download
                  speeds meeting the Digital Agenda objective of at least 30 Mbps coverage
              o Combination of VDSL, DOCSIS 3.0, and FTTP

In 2017, DG Connect also requested a fourth combination coverage category to be estimated on a
national level:

     •     Overall coverage of FTTP and DOCSIS 3.0 technologies
               o Includes fixed-line broadband access technologies primarily capable of achieving
                    download speeds meeting the Digital Agenda objective of at least 100 Mbps coverage
               o Combination of DOCSIS 3.0 and FTTP

Due to the fact that multiple operators may deploy their networks in the same or similar areas,
particularly in urban and more densely populated locations, it is necessary to take into account the
possibility of overlapping coverage when determining the technology combinations.

© 2018 IHS Markit. All rights reserved.                               4                       June 2018
IHS Markit | Broadband Coverage in Europe 2017: Coverage in Switzerland
The methodology used in this report mirrors the approach developed by Point Topic in 2012, adopting
regional approach to measuring overlapping and complementary coverage. Coverage data was
collected on a regional level using NUTS 3 statistical units as a research basis. The NUTS
(Nomenclature of Units for Territorial Statistics) areas are geographical subdivisions generally based
on existing national regional divisions of EU countries and associated countries (such as Norway,
Iceland and Switzerland). More specifically, NUTS 3 level areas are smaller regional units of 150,000
to 800,000 inhabitants. There are 1,357 NUTS 3 areas in the 31 study countries. With general statistical
data (such as population, household, and area size) readily available on NUTS 3 level, using this
regional approach provides a comprehensive and detailed view of broadband coverage across Europe
and allows for a year-to-year comparison with the BCE 2012-2016 data.
In addition to individual technology coverage and combination technology coverage, DG Connect
required coverage by download speed to be included in the study. The following speed categories were
thus included among the research metrics:
• Coverage by broadband network/s capable of at least 2 Mbps download speed
• Coverage by broadband network/s capable of at least 30 Mbps download speed
• Coverage by broadband network/s capable of at least 100 Mbps download speed
Coverage by speed categories was first estimated by IHS Markit in the 2013 edition of the BCE study.
By including this additional metric, it is possible to obtain an additional analytical layer to evaluate the
study countries’ progress towards the Digital Agenda goals and determine the actual speeds consumers
will be able to receive on the particular networks available to them.
© 2018 IHS Markit. All rights reserved. 5 June 2018IHS Markit | Broadband Coverage in Europe 2017: Coverage in Switzerland 2.0 European Overview 2.1 Country comparison of overall broadband coverage The overall broadband coverage combination category combines broadband coverage of all fixed broadband access technologies (DSL, cable, FTTP, WiMAX) as well as mobile broadband technologies (HSPA and LTE). This category provides an indication of the number of households covered by basic broadband provided by at least one of the abovementioned technologies. At the end of June 2017, more than 99.9% of Swiss households had access to at least one fixed or mobile broadband service. In terms of overall broadband coverage, Switzerland was among the 15 countries which recorded complete or very nearly complete overall broadband coverage. On the other hand, Slovakia remained the only country where overall broadband coverage levels did not reach 99% or more of households. Despite coverage growth of 2.2 percentage points, only 98.2% of Slovak households were passed by at least one mobile or fixed broadband network at the end of the study period. With the exception of Slovakia, there were no other notable increases in overall broadband coverage compared to mid-2016. This is because the HSPA rollout, which is generally the biggest driver of this category, has been mostly finished and widespread since 2014 and the availability of DSL (the second most important contributor) is saturated across the majority of European countries. As was mentioned in previous reports on broadband coverage in Switzerland, while all households in Switzerland are guaranteed by law (Universal Service Obligation) to be able to get connected to at least 2Mbps, our research estimates show that there continues to be a small number of homes (0.03%) that cannot be serviced by either fixed or mobile broadband connections. However, given the fact that 100% satellite coverage was reported for Switzerland, it is possible to assume that satellite broadband services are available to all Swiss households. © 2018 IHS Markit. All rights reserved. 6 June 2018
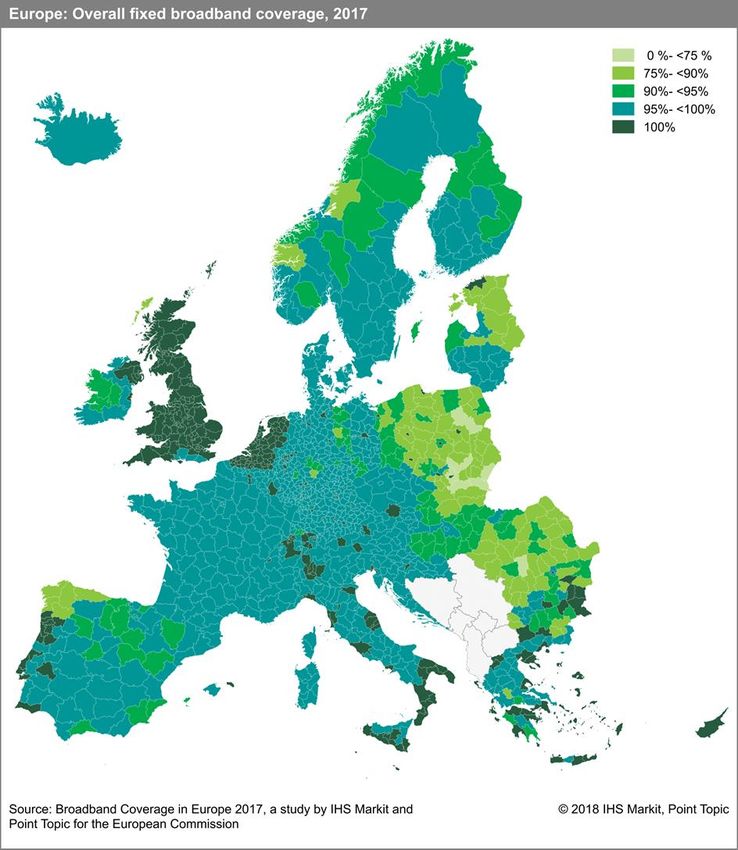
IHS Markit | Broadband Coverage in Europe 2017: Coverage in Switzerland

2.2 Country comparison of fixed broadband coverage
The overall fixed broadband coverage category has been designed to provide a measure of progress
in deployment of fixed broadband access technologies which are capable of providing households with
broadband services of at least 2 Mbps download speed. Four technologies make up the overall fixed
broadband coverage figures: DSL (including VDSL), cable (including DOCSIS 3.0), FTTP, and WiMAX.
Note that FTTP coverage trends are discussed in more detail in the following chapter on NGA coverage
by country.

In total, 26 out of the 31 study countries registered fixed broadband coverage of above 95%, highlighting
the breadth of fixed broadband coverage in most nations. Several countries recorded complete, or near
complete, fixed broadband coverage including Malta, the Netherlands, France, Cyprus, Luxembourg
and the UK. Given the high fixed broadband coverage achieved in many countries by mid-2016, most
countries recorded only minor improvements in fixed broadband coverage during the twelve months to
mid-2017. The largest coverage increase was in Croatia, where fixed broadband coverage expanded
by 2.3 percentage points to reach 99.3% of households. Four countries (Estonia, Slovakia, Romania
and Poland) reported coverage below 90% in mid-2017. These countries face fixed broadband
coverage challenges due to their sparsely populated and underserviced rural areas.

In Switzerland, 99.8% of homes had access to at least one fixed broadband service at the end of June
2017, unchanged from the previous year. In terms of coverage by the individual fixed technologies, DSL
networks are available to the vast majority of Swiss households with DSL coverage reaching 99.5% of
households.

© 2018 IHS Markit. All rights reserved.                               7                          June 2018
IHS Markit | Broadband Coverage in Europe 2017: Coverage in Switzerland

2.3 Country comparison of NGA coverage
The NGA combination category comprises VDSL, FTTP and DOCSIS 3.0 technologies, all typically
capable of delivering a service speed of at least 30Mbps (although VDSL local loop lengths mean that
actual speeds do vary). The main objective of the Digital Agenda for Europe is to have complete
coverage of European households at this speed by 2020. The analysis of the NGA coverage category
therefore constitutes an evaluation of the rollout of the relevant technologies and progress towards this
goal.

The study highlights that highly urbanised countries tend to have the highest NGA coverage. As in 2016,
Malta was the only country to record complete coverage for the NGA technology category. Five other
countries (Switzerland, Belgium, the Netherlands, Iceland and Portugal) recorded coverage levels
above 95%.

By mid-2017, notable differences in NGA coverage remained across the study countries. This reflects
the various strategies and approaches to high-speed broadband deployment across Europe. Of the 31
study countries, nine countries reported coverage levels below the European average (80.1%). Italy
and the Czech Republic both moved above the European average during the period, following double-
digit growth in NGA coverage. However, coverage levels in some countries remain very low compared
to the top performers. For example, Greece was the only study country where less than a half of
households (49.6%) had access to NGA services.

Examining individual NGA technologies, VDSL services reached 53.4% of homes by mid-2017, passing
50% availability for the first time. Although VDSL coverage growth has slowed compared to the twelve
months to mid-2016, VDSL remained the fastest growing NGA technology during the period. This is
underpinned by the deployment strategies of many operators, which focus on upgrading existing copper
infrastructure rather than investing in the typically more expensive deployments of fibre optic networks
all the way to customers’ property.

By mid-2017, Iceland, Belgium and Switzerland all recorded VDSL coverage levels that exceeded 90%,
whilst VDSL networks passed more than 80% of homes in five other countries (the UK, Luxembourg,

© 2018 IHS Markit. All rights reserved.                               8                          June 2018
IHS Markit | Broadband Coverage in Europe 2017: Coverage in Switzerland

Ireland, Italy and Austria). Overall, eighteen study countries had VDSL coverage that was higher than
the EU average of 53.4%. This included Czech Republic, Croatia, Germany and Italy, which all saw a
double-digit percentage point increase in VDSL coverage during the period. The Czech Republic
recorded the largest VDSL coverage increase, equivalent to 24.3 percentage points.

Nevertheless, VDSL services remained far from widespread in several countries. As was the case in
2016, Latvia, France, Spain and Romania all recorded VDSL coverage of less than 20%, while three
study countries (Bulgaria, Lithuania and Portugal) reported no VDSL availability. In many of these
countries, operators have chosen to deploy NGA technologies other than VDSL.

By mid-2017, Portugal continued to rank highest in terms of FTTP coverage. FTTP networks in Portugal
passed 89.4% of homes, a 3.3 percentage point increase. Latvia and Lithuania also recorded FTTP
availability that exceeded 80% of households at 85.3% and 81.6%, respectively. Spain was the only
other country to report FTTP coverage above 70% of households, with 71.4% homes passed by FTTP
networks. This represented an 8.6 percentage point increase in FTTP coverage; the highest among
any study country in the twelve months to mid-2017. The growth in FTTP coverage in Spain can be
attributed to network sharing agreements among operators, as well as alternative operators having
access to the incumbent’s ducts in order to accelerate deployment. Along with Spain, three other
nations (France, Poland and Malta) reported growth in FTTP availability of more than 7 percentage
points.

© 2018 IHS Markit. All rights reserved.                               9                      June 2018
IHS Markit | Broadband Coverage in Europe 2017: Coverage in Switzerland

The EU average for FTTP coverage reached 26.8% as of mid-2017, with eleven countries reporting
coverage levels below the EU average. Whilst FTTP networks were available in all study countries,
availability was very limited in some instances. The UK reported FTTP coverage of 2.3% of households,
whilst Belgium (0.8%) and Greece (0.4%) ranked as the lowest countries in terms of FTTP availability.
In these countries, operators have prioritised VDSL upgrades to existing DSL networks as opposed to
investing in the typically more expensive FTTP technology. Such operators tend to view the speeds
associated with VDSL technologies as sufficient to satisfy current demand. In addition, some of these
operators have also begun to trial solutions such as G.fast to increase achievable speeds using existing
copper infrastructure.

During the twelve months to mid-2017, the proportion of cable networks upgraded to DOCSIS 3.0
remained relatively unchanged. This is unsurprising given the high proportion of cable networks across
Europe already upgraded to DOCSIS 3.0 by mid-2016 (99%). Moreover, as in the previous year, sixteen
study countries had fully upgraded their cable networks to DOCSIS 3.0. In addition, DOCSIS 3.0
comprised over 80% of cable networks in all countries with cable broadband coverage.

As in 2016, Malta was the only country to record universal DOCSIS 3.0 availability. Two other study
countries (Belgium and the Netherlands) recorded DOCSIS 3.0 coverage levels above 95%.
Switzerland (84.3%) and Portugal (76.3%) were the only two other study countries where DOCSIS 3.0
networks passed more than three-quarters of homes. DOCSIS 3.0 coverage in nineteen study countries
exceeded the EU average (44.7%). Austria recorded the largest increase in DOCSIS 3.0 availability,
with coverage increasing by 5.5 percentage points to pass 52.8% of homes. Romania recorded the
second largest increase in DOCSIS 3.0 availability, at 5.3 percentage points, but DOCSIS 3.0 coverage
remained below the EU average in the country. As was the case in previous years, three countries
(Greece, Iceland and Italy) did not have cable broadband networks, therefore reported no DOCSIS 3.0
coverage.

© 2018 IHS Markit. All rights reserved.                              10                         June 2018
IHS Markit | Broadband Coverage in Europe 2017: Coverage in Switzerland

In 2017, DG Connect requested a fourth combination coverage category to be estimated on a national
level indicating overall coverage by FTTP & DOCSIS 3.0 networks. The two technologies are those
primarily capable of achieving at least 100Mbps download speeds (barring some still limited VDSL2
vectoring capability). In mid-2017, at least one FTTP or DOCSIS 3.0 network passed 57.8% of homes.

Among the countries registering the highest overall FTTP & DOCSIS 3.0 coverage were those with
most widespread DOCSIS 3.0 coverage, such as Malta, the Netherlands and Belgium, all reaching
coverage levels over 90%. On the other hand, countries such as Greece and Italy record the lowest
levels, due to absence of cable networks and preference for VDSL upgrades over FTTP deployments.

© 2018 IHS Markit. All rights reserved.                              11                   June 2018
IHS Markit | Broadband Coverage in Europe 2017: Coverage in Switzerland

2.4 Country comparison of speed categories
In previous iterations of this study, the analysis of download speed categories included mobile as well
as fixed broadband technologies. However, following discussions with DG Connect, it was decided that
this year’s study will focus on download speed availability over fixed networks only. As a result, neither
HSPA nor LTE networks are included in the analysis of achievable speeds. This is because
inconsistencies remain in the reliability of broadband connectivity over mobile networks, despite
improvements in the speed and connection quality associated with LTE services.

By mid-2017, most study countries had near universal availability of fixed broadband services capable
of at least 2 Mbps actual download speeds. In ten countries, at least 2 Mbps actual download speeds
were available to more than 99% of households, whilst in total 22 countries had at 2 Mbps coverage
that exceeded the EU average (96.0%).

Those countries with lower availability of at least 2 Mbps broadband connections tend to have a higher
proportion of DSL or WiMAX networks in the make-up of fixed broadband coverage. Traditionally, DSL
(and WiMAX) networks have been less reliable in sustaining actual speeds at peak times compared to
cable and FTTP networks. As was the case in 2016, Slovakia, Estonia and Poland were the only
countries where less than 90% of homes were passed by networks capable of delivering at least 2
Mbps actual download speeds.

Examining access to fixed broadband services capable of at least 30 Mbps download speeds, Malta,
Switzerland, Belgium, the Netherlands and Iceland all reported that fixed broadband networks capable
of these speeds reached at least 95% of households. Malta was the only country to report complete
coverage of broadband services capable of providing at least 30 Mbps actual download speeds.
Moreover, Switzerland ranked second in terms of availability of broadband services capable of providing
at least 30Mbps actual broadband download speeds, with 98.9% of Swiss households having access
to the high speed broadband services at the end of June 2017.

In total, 21 nations reported coverage above the EU average (79.0%) for homes passed by networks
capable of at least 30 Mbps download speeds. Greece was the only country where less than a half of

© 2018 IHS Markit. All rights reserved.                              12                           June 2018
IHS Markit | Broadband Coverage in Europe 2017: Coverage in Switzerland

households (45.9%) were passed by fixed broadband services capable of at least 30 Mbps download
speeds.

Czech Republic, Italy and Ireland all witnessed double-digit percentage point growth in the availability
of connections supporting at least 30 Mbps actual download speeds in the twelve-month period to the
end of June 2017. The highest growth was registered in Czech Republic, where at least 30 Mbps
coverage expanded by 14.6 percentage points. All three countries recorded large improvements in
VDSL coverage during the period, with information provided by the main VDSL network operators
indicating that most connections over the newly deployed VDSL networks were capable of supporting
actual speeds of at least 30 Mbps.

However, this was not the case for other countries, which have seen large increases in VDSL coverage
in recent years, resulting in high levels of VDSL coverage compared to other NGA technologies. As the
quality of VDSL connection speeds relies on a number of factors, such as distance from the street
cabinet or presence of crosstalk, VDSL networks tend to be affected the most in terms of inconsistencies
in actual speeds achieved at peak times.

Examining countries with the largest gaps between NGA coverage and at least 30 Mbps coverage,
NGA coverage is 13.3 percentage points higher than at least 30Mbps coverage in Poland. Finland and
Austria also recorded a difference in NGA coverage and at least 30 Mbps coverage of more than 8
percentage points.

Looking at access to broadband services capable of providing at least 100 Mbps actual download
speeds, the EU as a whole has achieved the Digital Agenda’s goal of having 50% of households with
access to 100 Mbps broadband services by 2020. That is, by mid-2017, over a half (55.1%) of EU
households were reached by broadband networks capable of providing at least 100 Mbps actual
download speeds. Nevertheless, there are considerable differences among individual countries. By
mid-2017, over 98% of households in Malta, Switzerland and the Netherlands were passed with a fixed
broadband service capable of reaching at least 100 Mbps actual download speeds, compared to only
0.4% of homes in Greece.

© 2018 IHS Markit. All rights reserved.                              13                         June 2018
IHS Markit | Broadband Coverage in Europe 2017: Coverage in Switzerland

In countries such as the UK, Italy, Austria and Ireland, VDSL networks equated to a considerable portion
of the overall NGA coverage. As a result, there was a notable difference between NGA coverage and
the availability of fixed broadband services capable of at least 100 Mbps download speeds. For
example, in mid-2017 the UK had NGA coverage of 93.9%, but services supporting actual download
speeds of at least 100 Mbps reached around a half (50.9%) of UK households.

© 2018 IHS Markit. All rights reserved.                              14                         June 2018
IHS Markit | Broadband Coverage in Europe 2017: Coverage in Switzerland

2.5 NUTS 3 coverage of overall fixed broadband

© 2018 IHS Markit. All rights reserved.                              15   June 2018
IHS Markit | Broadband Coverage in Europe 2017: Coverage in Switzerland

2.6 NUTS 3 coverage of NGA broadband

© 2018 IHS Markit. All rights reserved.                              16   June 2018
IHS Markit | Broadband Coverage in Europe 2017: Coverage in Switzerland

3.0 Switzerland
3.1 National coverage by broadband technology
As in the previous years, research on broadband coverage in Switzerland was included in the BCE
study thanks to additional funding provided by Glasfasernetz Schweiz, a Swiss fibre optic industry
association.

Switzerland continued to be one of the leaders in Europe in relation to broadband coverage. As in
previous years, Switzerland reported above-average coverage levels for all coverage combination
categories. Given the high broadband coverage levels achieved in previous years, it is unsurprising that
there were no substantial changes in broadband coverage levels in the twelve-month period to the end
of June 2017.

By mid-2017, Switzerland recorded universal, or near-universal, coverage for the overall broadband
combination category on a national and rural level (100.0% and 99.8%, respectively), as well as for the
fixed broadband combination category (99.8% and 99.0%, respectively). Similarly, NGA broadband
availability was near-universal (99.0%) at a national level. At a rural level, NGA broadband services
were available to 92.9% of rural households.

Switzerland continued to rank ahead of the EU average in terms of total coverage for each broadband
technology with the exception of WiMAX, which is absent in the Swiss market. Moreover, Switzerland
remained one of four countries with cable coverage above 80% of total households. In previous years,
cable operators, led by UPC (formerly Cablecom), have been investing substantially in cable
deployment, with this activity is set to continue in the next couple of years. 1 Switzerland’s entire cable
infrastructure has been upgraded to DOCSIS 3.0, meaning that cable networks serve as the key NGA
technology in the country.

Examining other NGA technologies, Switzerland was one of three countries to record VDSL coverage
of above 90%. Over the twelve-month period, VDSL coverage increased by 2.0 percentage points and
at the end of June 2017, 90.0% of Swiss households had access to VDSL broadband services.

1   https://www.upc.at/ueber-upc/presse/pressearchiv/upc-startet-millionen-investitionsprogramm-autostrada/

© 2018 IHS Markit. All rights reserved.                                   17                                  June 2018
IHS Markit | Broadband Coverage in Europe 2017: Coverage in Switzerland

Growth in FTTP coverage was slower compared to VDSL, nevertheless, following a 0.9 percentage
point increase, FTTP networks passed 29.5% of homes by mid-2017 and remained above the EU
average (26.8%). These increases can be attributed to the continued large-scale deployment of both
VDSL and FTTP technologies by the incumbent operator Swisscom, launched partly in reaction to the
increasing competition from cable providers. In addition, Swisscom was also one of the first European
network operators to launch commercial deployment of G.fast technology in September 2016, which
will allow the company to offer download speeds to up to 500 Mbps over its copper network.2

With regards to mobile broadband technologies, both HSPA and LTE technologies recorded near
universal coverage levels, reaching 99.8% of Swiss households. Following widespread adoption of LTE,
all three mobile network operators, Swisscom, Salt and Sunrise, have begun offering advanced LTE
plans by mid-2017.

2   https://www.swisscom.ch/en/about/medien/press-releases/2016/10/20161018-MM-Gfast.html

© 2018 IHS Markit. All rights reserved.                              18                      June 2018
IHS Markit | Broadband Coverage in Europe 2017: Coverage in Switzerland

During the twelve-month period to mid-2017, Switzerland remained one of the leaders in Europe in
terms of rural cable coverage. Cable networks passed 78.1% of rural households with all of cable
networks upgraded to DOCSIS 3.0. Looking at other NGA technologies, at the end of June 2017, VDSL
services were available to 60.6% of rural households in Switzerland, a 5.1 percentage point increase
compared to mid-2016. Meanwhile, 7.6% of rural households had access to FTTP broadband.

Examining mobile broadband access in rural areas, Switzerland was above the EU average for HSPA
coverage by mid-2017, reaching 99.3% of rural households. Rural LTE coverage grew by 5.6
percentage points and by the end of June 2017, 99.4% of rural households across Switzerland had
access to LTE services.

© 2018 IHS Markit. All rights reserved.                              19                     June 2018
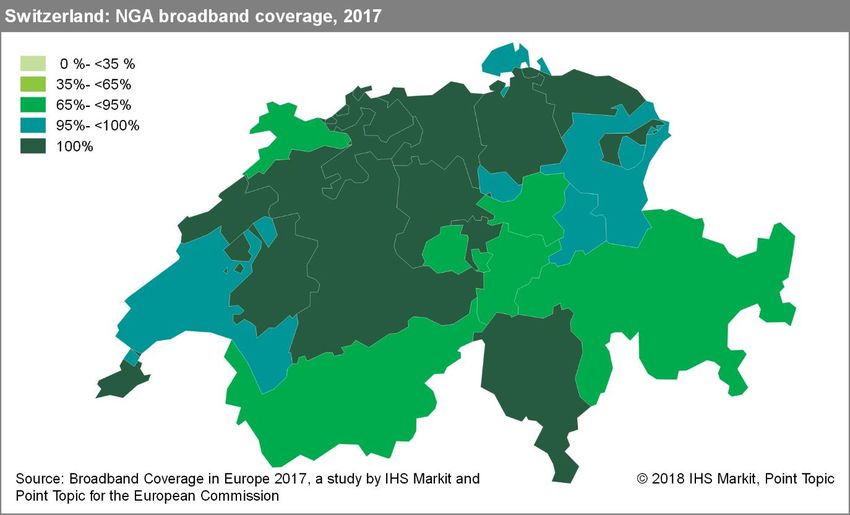
IHS Markit | Broadband Coverage in Europe 2017: Coverage in Switzerland

3.2 Regional coverage by broadband technology
Eighteen out of the 26 Swiss regions reported virtually complete fixed broadband coverage, with fixed
coverage in all of the remaining regions exceeding 96%. Lowest coverage was recorded in the Jura
and Uri regions, reaching 96.1% of households.

Complete NGA coverage was recorded in Geneva and Basel, with over 95% of homes passed by NGA
networks in majority of the remaining regions. In five regions - Valais, Jura, Obwalden, Uri, and
Graubünden – NGA coverage was lower than 95%, yet no region recorded less than 90% coverage.

© 2018 IHS Markit. All rights reserved.                              20                      June 2018
IHS Markit | Broadband Coverage in Europe 2017: Coverage in Switzerland

3.3 Data tables for the Switzerland
 Statistic                                         National
 Population                                             8,233,842
 Persons per household                                         2.3
 Rural proportion                                           12.8%

                             Switzerland 2017       Switzerland 2016       Switzerland 2015   EU28 2017

 Technology                  Total        Rural     Total     Rural        Total    Rural     Total   Rural

 DSL                         99.5%        96.3%     99.5%     97.4%        99.5%    97.4%     94.1%   86.3%

 VDSL                        90.0%        60.6%     88.0%     55.5%        81.5%    39.7%     53.4%   32.5%

 FTTP                        29.5%        7.6%      28.6%     7.3%         27.0%    6.6%      26.8%   11.3%

 WiMAX                       0.0%         0.0%      0.0%      0.0%         0.0%     0.0%      18.0%   18.2%

 Cable                       84.3%        78.1%     84.3%     78.2%        84.1%    78.0%     45.1%   11.4%

 DOCSIS 3.0                  84.3%        78.1%     84.3%     78.2%        84.1%    78.0%     44.7%   10.8%

 HSPA                        99.8%        99.3%     99.5%     98.7%        99.4%    97.6%     97.9%   92.4%

 LTE                         99.8%        99.4%     98.3%     93.8%        92.3%    72.2%     97.9%   89.9%
 LTE average
 operator
                             98.6%        -         95.6%     -            -        -         90.8%   -
 coverage
 (DESI indicator)
 Satellite                   100.0%       100.0%    100.0%    100.0%       100.0%   100.0%    99.4%   99.4%

 Overall
                             100.0%       99.9%     100.0%    99.8%        99.9%    99.6%     99.9%   99.4%
 broadband

 Overall fixed
                             99.8%        98.6%     99.8%     99.0%        99.8%    99.0%     97.4%   92.4%
 broadband

 NGA
                             99.0%        93.2%     99.0%     92.9%        98.9%    92.7%     80.1%   46.9%
 broadband
 Overall DOCSIS
 3.0 & FTTP                  88.2%        -         -         -            -        -         57.8%   -
 coverage

 At least 2 Mbps             99.8%        -         99.8%     -            99.8%    -         96.0%   -

 At least 30
                             98.9%        -         98.9%     -            98.9%    -         79.0%   -
 Mbps

 At least 100
                             98.5%        -         98.5%     -            98.4%    -         55.1%   -
 Mbps

© 2018 IHS Markit. All rights reserved.                               21                              June 2018
IHS Markit | Broadband Coverage in Europe 2017: Coverage in Switzerland Note: The 2017 figures represent state of broadband coverage as of end of June 2017. The 2016 (end of June) and 2015 (end of June) figures are drawn from the previous studies conducted by IHS and VVA. © 2018 IHS Markit. All rights reserved. 22 June 2018
IHS Markit | Broadband Coverage in Europe 2017: Coverage in Switzerland

4.0 Methodology
The methodological approach used in the 2017 edition of the Broadband Coverage in Europe study
mirrors the approach used in the 2013-2016 studies, which was in turn based on a methodology first
implemented by Point Topic in 2012. Applying the same methodological approach allows the research
team to ensure both consistency and year-on-year comparability of the data.

As in previous years of the project, a survey of NRAs and broadband network operators forms the core
of this study. The survey results were validated and cross-checked against additional information
gathered from other sources (including public announcements by telecoms groups) in parallel with the
survey data collection. The additional research also helped to fill in any gaps, which resulted from
incomplete information from NRAs or operators. Lastly, survey data and additional information were
combined and used to calculate national coverage by individual technologies as well as the combination
coverage categories and speed coverage categories for all study countries.

The timeline of the data collection for the 2017 edition of the BCE study follows an amended schedule
first implemented for the 2015 edition of the study. This means that the collected information reflects
the situation at the end of June (i.e. half-year data rather than year-end data points were collected).

The following chapters of this report provide a detailed description of the project’s methodology.

4.1 Survey design and data collection
For the sake of consistency, the research team used similar wording and formatting of the survey
questionnaire as in 2012-2016. Using near-identical question wording enables the research team to
deliver findings which can be compared with research undertaken in previous years.

Where possible, the research team contacted survey participants that were approached for the 2012-
2016 data collection. During the previous data collection the IHS Markit research team updated and
expanded the list to include new contacts in already surveyed companies and organisations as well as
those companies that were not previously approached. The fact that the BCE project is a long-running
project means that most respondents are familiar with the study as well as the survey questionnaire,
making it easier for them to fill in the by-now familiar information.

The survey questionnaire focuses on one central question, which asks about the absolute number of
homes passed by broadband networks, and is applied to the following key metrics of the research:

     •     Technology coverage – for each of the technologies (with the exception of satellite) a question
           was included asking NRAs to supply the number of homes passed by each individual
           technology in the country.

     •     Regional coverage – NRAs and operators were also asked to supply homes-passed information
           for each of the NUTS 3 regions in all study countries for each of the technologies.

     •     Rural coverage – the same questions were asked of respondents for homes passed in rural
           areas of each NUTS 3 region as well as for the total number of rural homes passed country-
           wide.

     •     Speed coverage - the 2013-2016 survey questionnaires were extended to include questions
           asking participants about the numbers of homes passed by networks able to achieve speeds
           of at least 2 Mbps, 30 Mbps and 100 Mbps. This metric and corresponding questions were
           retained in the 2017 study.

In a number of cases, coverage data was delivered on a more detailed geographical level than the
requested NUTS 3 areas. In these cases, the research team aggregated the provided data to match
the NUTS 3 regions.

© 2018 IHS Markit. All rights reserved.                              23                           June 2018
IHS Markit | Broadband Coverage in Europe 2017: Coverage in Switzerland In addition to the coverage questions, the survey questionnaire also provided space for additional comments and explanations of the various technologies and speed specifications in cases in which respondents’ definitions differed from those outlined in the survey (detailed definitions of the individual broadband technologies are included in the Appendices of this report). These comments provided further insight and were reflected in the final analysis of the data. Given the nature of satellite broadband coverage, questions regarding satellite coverage were not included in the survey questionnaire. The satellite coverage across Europe was determined based on conversations with leading satellite providers such as Eutelsat, a KA-SAT broadband provider and other smaller satellite operators. The research team has been from the onset of this project aware of the sensitivity of the requested data provided by operators, as much of the coverage data (especially on such a granular level) could be regarded as commercially sensitive by operators. Therefore, confidentiality of the information gathered from both NRAs as well as individual operators was assured at all stages of the survey data collection and subsequent analysis. In order to protect the confidentiality of the data, study results for individual coverage technologies are published only on a total country level. On the regional NUTS 3 level, reported data is limited to coverage by technology combinations. As these technology combinations include multiple technologies, coverage by individual technologies or companies is concealed within the combined total coverage. All of the collected data was treated as commercially confidential and was used solely for the purposes of this study. 4.2 Defining households and rural areas The central question posed by the survey questionnaire asks about the number of homes passed by individual operator and/or technology networks, depending on the respondent. In order to make determining the numbers of homes passed in each NUTS 3 region easier for respondents, the research team provided guidance by including the total number of households in each area in the survey questionnaire. As it is not possible to obtain annually updated household figures by NUTS3 regions for all of the BCE study countries, the research team calculated the number of households in each NUTS 3 region using NUTS 3 level population data published annually by Eurostat and average household size figures also published by Eurostat annually for each country. This approach allows the research team to maintain a unified methodology across all of the study countries using one data source. One of the key dimensions of the study is centred around gaining information on broadband coverage in rural areas. In order for the rural data collected in the period 2013-2017 to be comparable to the 2012 dataset, the research team uses a methodology first developed by Point Topic in 2012, which defines rural areas using the Corine land cover database, and creates a database of population and land type in every square kilometre across Europe. Households in square kilometres with a population of less than one hundred are classified as rural. This granular approach based on population density identifies the truly rural areas likely to be unserved or underserved by broadband operators. According to an updated estimation of rural population in individual NUTS 3 regions, approximately 14% of households in the study countries were rural in 2017. Combining this information with updated population and household data from Eurostat, the EU statistical office, allowed the research team to create new estimates for the numbers of rural households across each market and NUTS 3 area. 4.3 Additional research conducted in parallel to the survey © 2018 IHS Markit. All rights reserved. 24 June 2018
IHS Markit | Broadband Coverage in Europe 2017: Coverage in Switzerland

In addition to data gathered through the NRAs and ISPs survey, the research team carried out
supplemental research to check the validity of survey data as well as to fill in any missing information/

The additional research was built on the IHS Markit and Point Topic team’s extensive in-house
knowledge of the European broadband sector and was complemented with country and regional-level
data collected from publicly available NRAs and ISPs reports and details on broadband strategies and
development plans of individual companies and governments.

This desk-based research provided basic estimates on country-level coverage for each technology. In
many cases, information on regional deployments of next generation access technologies was also
available, or it was possible to infer such detail from company communications.

The individual elements of the additional research were determined on a country-by-country basis and
included (but were not limited to) desk research of the following publicly available sources:

     •           NRAs market reports
     •           ISPs financial reports and press releases
     •           Industry organisations white papers, special reports and analysis
     •           Industry news

4.4 Validation and integration of data
In this phase of the study, data collected through the survey and via additional research were brought
together to obtain the actual coverage figures for all of the study countries.

The data integration was conducted on a country-by-country basis. Information gathered from additional
research was cross-checked with results of the survey. In cases for which data points were missing, for
example some of the NUTS 3 regions or rural coverage, a modelling methodology was applied to fill in
the gaps. Models used varied on a case-by-case basis, and relied on a range of inputs, which included
national coverage and regional presence data as well as the research team’s knowledge of individual
markets, companies’ deployment strategies and ancillary data, such as population density.

Each country’s data was integrated for each technology individually. This allowed the research team to
first obtain estimates for individual technologies at a NUTS 3 level, which were then used to calculate
estimates for technology combinations – again at a NUTS 3 level. Regional data was finally summed
to obtain national-level coverage information. When integrating data on individual technologies, special
attention was paid to areas for which coverage of the same technology was provided by multiple
operators, in order to rule out possible overlap.

At the end of the data validation and aggregation process, the research team was able to provide
estimates for each of the nine broadband technologies in all NUTS 3 areas both on total and rural level.

4.5 Estimating coverage for different technology combinations
After reaching the broadband coverage figures by individual technologies in each country and NUTS3
regions, the research team calculated estimates for the following three technology combinations, taking
into account the overlaps of different technologies:

     •           Overall broadband coverage (including DSL, VDSL, FTTP, Standard cable modem,
                 DOCSIS 3.0, WiMAX, HSPA and LTE)

     •           Overall fixed broadband coverage (including DSL, VDSL, FTTP, Standard cable modem,
                 DOCSIS 3.0 and WiMAX)

     •           Overall NGA coverage (including VDSL, FTTP and DOCSIS 3.0)

© 2018 IHS Markit. All rights reserved.                              25                          June 2018
IHS Markit | Broadband Coverage in Europe 2017: Coverage in Switzerland
In 2017, DG Connect also requested a fourth combination coverage category to be estimated on a
national level:
• Overall coverage of FTTP and DOCSIS 3.0 technologies
For the sake of consistency, the research applied similar methodology in the 2017 study to the approach
used in the 2012-2016 editions of the study. Unless information provided by NRAs or telecoms groups
suggested otherwise, a standardised default formula was used taking the average of:
1. The minimum possible coverage; equal to the coverage of the most widespread technology or
operator in the area; and
2. The maximum possible coverage; equal to the sum of the coverage of all the technologies or
operators being considered, or to 100%, whichever was the greater.
As in the previous studies, a varied formula was used in cases where some technologies’ coverage
was more complementary than overlapping. In these cases, the minimum coverage was taken as equal
to the sum of the complementary technologies, if this was greater than the most-widely available single
technology.
Additionally, the estimates for combination coverage on a national level were made by summing the
estimates for the NUTS 3 areas rather than applying this formula on a country level. This approach
provides a more accurate data output than simply taking the country-level average.
Once the research team completed the final country level dataset, it was passed on to DG Connect and
to the NRAs of all of the study countries for their feedback and comments before the finalised data was
used as components of the Digital Society & Economy Index (Connectivity Dimension) and published
as part of the individual country assessment reports.
In a number of cases, new and more accurate data was provided to the research team reflecting the
2016 data and thus justifying restatements of the figures published in the Broadband Coverage in
Europe 2016 study.
© 2018 IHS Markit. All rights reserved. 26 June 2018IHS Markit | Broadband Coverage in Europe 2017: Coverage in Switzerland
4.6 Estimating coverage for speed categories
The speed categories were first included as broadband coverage metrics in 2013 in order to provide an
additional analytical layer to evaluate the study countries’ progress towards the Digital Agenda goals
and to estimate the download speeds available to households across the EU Member States. This
additional component of the broadband coverage research was retained in the 2017 edition of the study
with following speed categories included among the metrics:
• Coverage by broadband network/s capable of at least 2 Mbps download speed
• Coverage by broadband network/s capable of at least 30 Mbps download speed
• Coverage by broadband network/s capable of at least 100 Mbps download speed
Including this metric allows for a comparison of the technology coverage, which might be reported as
relatively high, to the actual speeds consumers will be able to receive on the particular networks
available to them.
The following methodological approach was first implemented in 2013 and carried over in the
subsequent iterations of the study. In order to estimate the coverage by the speed categories, the
research team needed to develop a suitable methodology and clear definition to determine coverage
by realistically achievable speeds as required by DG Connect. Thus, the following speed categories
were added among the research metrics and questions regarding these categories were included in the
survey questionnaire:
• Coverage by broadband network/s capable of realistically achieving actual download speeds
of at least 2 Mbps. This category encompassed DSL (including VDSL), FTTP, WiMAX,
standard cable (including DOCSIS 3.0 cable), HSPA and LTE broadband access technologies.
However, as not all DSL connections are capable of download speeds of 2Mbps and higher,
respondents were asked to exclude those connections which did not meet the criteria from
their answers.
• Coverage by broadband network/s capable of realistically achieving actual download speeds
of at least 30 Mbps. This category encompassed VDSL, FTTP, DOCSIS 3.0 cable, and LTE
broadband access technologies. However, as not all connections utilizing these technologies
can achieve 30 Mbps and higher actual download speeds (for example, VDSL connections
with distance from the exchange point higher than 500m see radical decrease in actual
speeds), respondents were asked to exclude those connections which did not meet the criteria
from their answers.
• Coverage by broadband network/s capable of realistically achieving actual download speeds
of at least 100 Mbps. This category encompassed FTTP, DOCSIS 3.0 cable, and LTE
broadband access technologies. In cases where vectoring is applied to VDSL2 technology and
speeds reach 100 Mbps and higher download speeds, VDSL with vectoring was asked to be
included in this category. However, as not all connections utilizing these technologies can
achieve 100 Mbps actual download speeds (for example, in the case of FTTB – fibre-to-the-
building – connections included in the FTTP category in-building wiring can pose significant
constraints on achievable end-user broadband speeds), respondents were asked to exclude
those connections from their answers.
The coverage of these speed categories was then defined as a household having technical access to
one or more networks supporting at least 2, 30, or 100 Mbps download speed connections if the
connection’s broadband speed was capable of achieving a minimum of 2, 30, or 100 Mbps download
speed (respectively) for the majority of the time. ‘Majority of time’ is understood to mean actual download
speeds achieved by a household for at least 75% of the time.
© 2018 IHS Markit. All rights reserved. 27 June 2018IHS Markit | Broadband Coverage in Europe 2017: Coverage in Switzerland As speed information can be generally hard to decode, even for the NRAs and ISPs themselves, the research team, in addition to the collected survey data, also relied on sector knowledge regarding deployments to make informed estimates of achievable speeds to gain complete picture of coverage by the speed categories. Following discussions with DG Connect, a decision has been made to focus the speed categories on speed availability over fixed networks only and neither HSPA nor LTE networks were included in analysis of achievable speeds. While considerable improvements in terms of speed and connection quality attainable over LTE mobile networks have been achieved in the last couple of years, there continue to be inconsistencies in terms of reliability of broadband connectivity over mobile networks. Note that unlike the technology coverage, the speed metric categories have been determined on a country level only, as gathering information on rural and regional NUTS 3 level would not have been feasible within the scope of the study – although we hope that NRAs and ISPs will consider collecting and making such information available at a future point in time. © 2018 IHS Markit. All rights reserved. 28 June 2018
IHS Markit | Broadband Coverage in Europe 2017: Coverage in Switzerland

Contacts
James Joiner
Senior Analyst
IHS Markit
Ropemaker Place
25 Ropemaker Street
EC9Y 2LY London
United Kingdom

+44 (0) 7593183720
james.joiner@ihsmarkit.com

Paul Alexander
Business Development Manager
IHS Markit

+46 70916439
paul.alexander@ihsmarkit.com

© 2018 IHS Markit. All rights reserved.                              29   June 2018
IHS Markit Customer Care:
CustomerCare@ihsmarkit.com
Americas: +1 800 IHS CARE (+1 800 447 2273)
Europe, Middle East, and Africa: +44 (0) 1344 328 300
Asia and the Pacific Rim: +604 291 3600

Disclaimer
The information contained in this report is confidential. Any unauthorized use, disclosure, reproduction, or dissemination, in full or in part, in any media or by any means, without the
prior written permission of IHS Markit Ltd. or any of its affiliates ("IHS Markit") is strictly prohibited. IHS Markit owns all IHS Markit logos and trade names contained in this report that
are subject to license. Opinions, statements, estimates, and projections in this report (including other media) are solely those of the individual author(s) at the time of writing and do
not necessarily reflect the opinions of IHS Markit. Neither IHS Markit nor the author(s) has any obligation to update this report in the event that any content, opinion, statement,
estimate, or projection (collectively, "information") changes or subsequently becomes inaccurate. IHS Markit makes no warranty, expressed or implied, as to the accuracy,
completeness, or timeliness of any information in this report, and shall not in any way be liable to any recipient for any inaccuracies or omissions. Without limiting the foregoing, IHS
Markit shall have no liability whatsoever to any recipient, whether in contract, in tort (including negligence), under warranty, under statute or otherwise, in respect of any loss or
damage suffered by any recipient as a result of or in connection with any information provided, or any course of action determined, by it or any third party, whether or not based on
any information provided. The inclusion of a link to an external website by IHS Markit should not be understood to be an endorsement of that website or the site's owners (or their
products/services). IHS Markit is not responsible for either the content or output of external websites. Copyright © 2018, IHS MarkitTM. All rights reserved and all intellectual property
rights are retained by IHS Markit.
You can also read