Company Overview August 2021 - Investor Relations

Page created by Roland Mann
 
CONTINUE READING
Company Overview August 2021 - Investor Relations
Company Overview
August 2021

© Red Violet, Inc.   All Rights Reserved.
Company Overview August 2021 - Investor Relations
Cautionary Statement

This presentation contains "forward-looking statements," as that term is defined under the Private Securities Litigation Reform Act of 1995 (PSLRA), which statements may
be identified by words such as "expects," "plans," "projects," "will," "may," "anticipate," "believes," "should," "intends," "estimates," and other words of similar meaning.
Such forward-looking statements include non-historical statements about our expectations, beliefs or intentions regarding our business, technologies and products,
financial condition, strategies or prospects. There are a number of important factors that could cause actual results or events to differ materially from those indicated by
such forward-looking statements, including: the risks set forth under the heading “Forward-Looking Statements” and “Risk Factors” in red violet’s Form 10-K for the year
ended December 31, 2021 filed on March 10, 2021, as may be supplemented or amended by red violet’s other SEC filings. We undertake no obligation to publicly update
or revise any forward-looking statement, whether as a result of new information, future events or otherwise, except as required by law.

You are cautioned not to place undue reliance on these forward-looking statements, which are based on red violet’s expectations as of the date of this presentation and
speak only as of the date of this presentation. red violet undertakes no obligation to publicly update or revise any forward-looking statement, whether as a result of new
information, future events or otherwise.

Without limiting the foregoing, the inclusion of the financial projections in this presentation should not be regarded as an indication that the Company considered, or now
considers, them to be a reliable prediction of the future results. The financial projections were not prepared with a view towards public disclosure or with a view to
complying with the published guidelines of the Securities Exchange Commission, the guidelines established by the American Institute of Certified Public Accountants with
respect to prospective financial information, or with U.S. generally accepted accounting principles. Neither the Company’s independent auditors, nor any other independent
accountants, have compiled, examined or performed any procedures with respect to the financial projections, nor have they expressed any opinion or any other form of
assurance on such information or its achievability. Although the financial projections were prepared based on assumptions and estimates that the Company’s management
believes are reasonable, the Company provides no assurance that the assumptions made in preparing the financial projections will prove accurate or that actual results will
be consistent with these financial projections. Projections of this type involve significant risks and uncertainties, should not be read as guarantees of future performance or
results and will not necessarily be accurate indicators of whether or not such results will be achieved.

Management evaluates the financial performance of our business on a variety of key indicators, including non-GAAP metrics of adjusted EBITDA, adjusted EBITDA
margin, adjusted gross profit and adjusted gross margin. Adjusted EBITDA is a financial measure equal to net loss, the most directly comparable financial measure based
on US GAAP, excluding interest income, depreciation and amortization, share-based compensation expense, litigation costs, insurance proceeds in relation to settled
litigation, transition service income, write-off of long-lived assets and others. We define adjusted EBITDA margin as adjusted EBITDA as a percentage of revenue. We
define adjusted gross profit as revenue less cost of revenue (exclusive of depreciation and amortization), and adjusted gross margin as adjusted gross profit as a
percentage of revenue.

2                                                              © Red Violet, Inc.     All Rights Reserved.
Company Overview August 2021 - Investor Relations
red violet at a Glance

                                                                                                   Most Advanced Identity Intelligence Platform
                                                                                                   Cloud-native platform delivering greater intelligence and unparalleled
                                                                                                   insight for decision-making capabilities

           March 26, 2018                              $39M                                        Scalable and Efficient
                    Initial Listing                 TTM   Revenue(1)                               Quick and cost-effective deployment that is scalable to virtually unlimited
                                                                                                   capacity and performance

                                                                                                   Large and Growing Market
                                                                                                   Numerous expansion and increased penetration opportunities

                                                                                                   Designed with Security in Mind
          NASDAQ: RDVT                                    75%                                      Built in a secure payment card industry (PCI) compliant environment
                   Ticker Symbol                  Adj. Gross Margin(1)

                                                                                                   Proven Management Team
                                                                                                   Highly experienced management team with track record of scaling businesses

                                                                                                                                   Our Brands

                      6,000+                              81%
                      Customers                  Contractual Revenue(1)
                                                                                            Leading analytics and information solutions         Instant knowledge to help Real
                                                                                             provider delivering actionable intelligence          Estate professionals better
                                                                                                  to the risk management industry                understand and address risk

    (1)   For the quarter ended June 30, 2021.

3                                                                      © Red Violet, Inc.   All Rights Reserved.
Company Overview August 2021 - Investor Relations
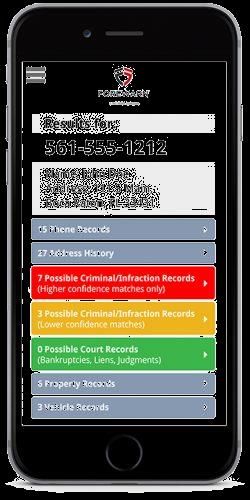
Seasoned Management Team With Deep Data and Analytics Industry Experience

      Name and Title                                        Biography                                        Prior Experience

                            ▪ Over 20 years of experience in the data and analytics industry
             Derek Dubner
                 CEO        ▪ Built leading information management companies which sold for an
                              aggregate value of approximately $1 billion

             James Reilly
               President    ▪ Over 20 years of executive experience in data markets

           Dan MacLachlan   ▪ Over 15 years of experience as the CFO of data-driven technology
                CFO           companies

               Jeff Dell    ▪ Over 20 years of experience in Information Security as an executive in
                 CIO          data-driven technology companies

            Angus Macnab    ▪ Over 15 years of experience in data science, engineering, and scientific
                CTO           computing

                            ▪ Over 20 years of experience in the digital identity and mobility space,
            Jim Greenwell
             GM, Identity     working as an executive and adviser to leading identity management and
                              information solutions providers

4                                                         © Red Violet, Inc.          All Rights Reserved.
Company Overview August 2021 - Investor Relations
Challenges That Businesses Are Facing Today

Organizations are challenged by the structure, volume and disparity of data. Our platform and applications transform the way customers interact with
  information, presenting connections and relevance of information otherwise unattainable, which drives actionable insights and better outcomes.

         Managing                             Identity                                 Legislative                           Consumer
           Risk                              Verification                              Compliance                            Modeling

      red violet’s advanced             In a world of omnichannel                     red violet simplifies              Understanding the consumer
     analytics and enterprise            engagement, verifying a                    compliance with turn-key            is more important than ever in
    solutions drive successful          consumer’s identity is a top                   solutions that drive             a digital economy. red violet’s
      business decisions in                challenge. red violet                     actionable insights and               consumer identity graph
       real-time, providing                  provides identity                     better outcomes, allowing              provides connections and
    organizations the ability to         intelligence that meets a                 businesses to comply with               relevant characteristics,
    make informed decisions             business’s specific identity                government and industry              allowing businesses to build
        and mitigate risk.                 needs and workflow.                            regulations.                       strong relationships.

5                                                      © Red Violet, Inc.   All Rights Reserved.
Company Overview August 2021 - Investor Relations
Our Intelligent Platform – CORE
                                                         TM

                  Disparate Data                                                                                   Identity Intelligence
                                                                                                              Financial:
      With massive data assets consisting of                                                                  ▪ Identity Verification / Fraud Prevention
      public record, proprietary and publicly-                                                                ▪ Collections Activity
         available data, our differentiated                                                                   ▪ AML, KYC, BSA Efforts
       information and innovative platform                                                                    ▪ Due Diligence
         and solutions deliver intelligence
           relating to all things identity.                                                                   Real Estate:
                                                                                                              ▪ Consumer Data Appends
                                                                                                              ▪ Consumer Modeling / Segmentation
                                                                                                              ▪ Identity Verification / Risk Assessment
                                 Data
                                                                 ▪   Scalable / performant cloud-native
                                Sources                                                                       Collections:
                                                                     infrastructure that is fully automated   ▪ Collections Activity / Right-party contact
                                                                                                              ▪ Compliance
                                                                 ▪   Proprietary, scalable, distributed       ▪ Employment Verification/Bank Account Locate
     Financial                     Employment
                                                                     memory, data processing platform         Retail:
                     Location                                                                                 ▪ Identity Verification / Fraud Prevention
                                                                 ▪   Distributed supervised and               ▪ Collection Activity
                                                Phone                unsupervised machine learning            ▪ Frictionless Commerce

                                                                                                              Investigative:
    Demographic
                                    Property                     ▪   Low latency / high throughput search     ▪ Investigative Support
                                                                     and information retrieval solutions      ▪ Subject / Asset Locate
                                                                                                              ▪ Identity Verification / Fraud Prevention
                                                                     using Boolean and inverted indices       ▪ Compliance
                   Relationships                Social

                                                                 ▪   Scalable to virtually unlimited          Background Screening:
                                                                     capacity and performance                 ▪ Identity Verification / Fraud Prevention
                                                                                                              ▪ Criminal Record Research

6                                                             © Red Violet, Inc.     All Rights Reserved.
Company Overview August 2021 - Investor Relations
red violet Plays in a Large and Fast-Growing TAM

                                                                                                                                             $10B
                                             # of Businesses(1)                                                         red violet’s Bottom-Up TAM(4)

                                                                                                                                                                                    $83B
                                                                                                                                                                          Global Big Data & Analytics
                                                                                                                                                                          Software Revenue(3)

                                                   90,000                                                                   (  35% Avg.
                                                                                                                              Penetration    ) ($180k
                                                                                                                                               Avg. ACV   )   $5.7B       (15.4% CAGR)

                                                                                                                                                                                    $30B
                                                                                                                                                                          Global Analytics and
                                                  100,000                                                                   (  36% Avg.
                                                                                                                              Penetration    ) ( $75k
                                                                                                                                               Avg. ACV   )   $2.7B       Business Intelligence
                                                                                                                                                                          Software Revenue(2)

                                                                                                                                                                                    $10B
                                                  120,000                                                                   (  37% Avg.
                                                                                                                              Penetration    ) ( $26k
                                                                                                                                               Avg. ACV   )   $1.1B       Bottom-Up
                                                                                                                                                                          TAM Analysis(4)

                                                 282,000                                                                    (  50% Avg.
                                                                                                                              Penetration    ) ( $5k
                                                                                                                                               Avg. ACV   )   $0.7B

(1)   Represents serviceable market for verticals in which the company currently operates.
(2)   Gartner Forecast Analysis: Analytics and Business Intelligence Software, Worldwide, September 2020. Represents 2021 figure.
(3)   IDC Worldwide Big Data and Analytics Software Forecast, 2021 – 2025, July 2021. Represents 2021 figure. CAGR represents 2020 – 2025.
(4)   Management’s Estimates Based on Public Sources and Industry Knowledge.

7                                                                                                                   © Red Violet, Inc.             All Rights Reserved.
Company Overview August 2021 - Investor Relations
Our Business Model Provides a Compelling Investment Opportunity

                                                   Next-Generation Technology Platform
                                         ✓         Proprietary data and industry agnostic platform drives cost efficient solutions across industries

                                                                              Differentiated Owned Data Asset
                                                                   ✓          Massive proprietary datasets of alternative and internally generated data unified by proprietary algorithms and analytic processes

                                                                                       Subscription-Based
                                                                            ✓          81% of revenue attributable to customer contracts, generally annual contracts or longer, with auto renewal (1)

                                                                                            Fixed-Cost Model
                                                                              ✓             We acquire data using flat-rate, unlimited use long-term contracts, so as revenue scales, our cost of revenue does not

                                                                                       Large and Growing Market
                                                                            ✓          $10B+ serviceable market today with $80B+ in total addressable market (2)

                                                                              Strong Operating Leverage
                                                                   ✓          $3.7M increase in adjusted gross profit provided $2.2M improvement in adjusted EBITDA over Q2’20, ~60% contribution (1)

                                                   Experienced Management Team
                                         ✓         Team previously built current industry competitors which were acquired for an aggregate value of approximately $1B

    (1)   For the quarter ended June 30, 2021.
    (2)   IDC Worldwide Big Data and Analytics Software Forecast, 2021 – 2025, July 2021.
8                                                                                                         © Red Violet, Inc.        All Rights Reserved.
Company Overview August 2021 - Investor Relations
Our Brands

                                                                                                  The Value of Instant Due
                                                                                                 Diligence with FOREWARN:

           IDI’s full investigative and risk       Manually verified place of                  Using only the incoming phone number,
          management tool and your go-           employment and bank account                   FOREWARN can positively identify over 80%
       to identity verification, location, and    locates. Verified, actionable                of prospective buyers
      skip trace solution. Full views of, and           and guaranteed.
          connections between, people,                                                         Identify if your prospect has a criminal history
      businesses, assets and more. Better
            information at a better price.                                                     Verify current property and vehicle ownership

                                                                                               Verify financial risks (bankruptcies / liens)
         Batch and API Solutions                  Custom Data Analytics
            Fast, accurate, and cost-               IDI’s next-generation data                 Verify additional phone numbers and full
            effective. Customers can              fusion platform and analytical               address history
          leverage IDI data in a single,            applications enable greater
         automated solution for identity            insight into your own data,
                                                                                               Agents can properly and safely plan for
             intelligence and more.                    while simultaneously
                                                                                               showings with a higher level of confidence
                                                  leveraging IDI’s massive data
                                                             repository.

9                                                            © Red Violet, Inc.    All Rights Reserved.
Company Overview August 2021 - Investor Relations
Growth Drivers

                               RAPIDLY GROWING AMOUNTS OF DISPARATE DATA
        MACRO TAILWINDS

                               WORLDWIDE DIGITAL TRANSFORMATION

                               INCREASING
                               RATES OF FRAUD                                                                                                           Expansion
                                                                                                                                               ▪   Expanding product suite will allow
                                                                                                                                                   for entrance into new verticals and
                                                                                                                                                   geographic markets
                                                                                                             Custom Solutions
                                                                                                                                               ▪   Introduction of additional sales
                                                                                                         ▪   Solve complex problems for            channels will reach nontraditional
                                                                                                             enterprise customers                  customers
                                                                                                         ▪   Tailor solutions to meet unique
                                                                      Penetration                            needs of each customer

                                                             ▪   Expanded spend from customer
                                    Adoption                     base through cross-sell and upsell
                          ▪   Proven, scalable sales model

                                                                                  GROWTH INITIATIVES

10                                                                    © Red Violet, Inc.              All Rights Reserved.
Case Studies

     1                                                                        Identity Verification

                            Global Leader in Identity Verification Solutions for Real-time Risk Decisioning
                                             The ability to prove digital identity is needed to create trust in a digital world

           Customer needed a data solution that would provide broad US consumer coverage and meaningful insights to help reduce friction , improve conversion and combat
             fraud. We won their business because of the comprehensive consumer coverage of our data assets, accuracy, speed, pricing and scalability of our transaction
                                     processing. A customer since early 2020, we continue to partner on solutions that will expand the relationship.

     2                                                                 Commercial Entity Resolution

                                           Leading Provider of Commercial Real Estate Intelligence
                      Commercial real estate is swimming in unstructured data that has become overwhelming and difficult to unify

               In 2018, customer needed better underlying identity data to fuel critical aspects of their commercial real estate due diligen ce platform. Challenged with
            understanding exact consumer identities associated with ownership entities gleaned from property -centric information, The customer found our deep, unified
          data assets, coupled with advanced data delivery and querying capabilities, to be unmatched. Following a brief testing perio d, a wholesale switch occurred from
                             their previous provider for their applicable information needs and recently renewed for an additional, multi -year agreement.

11                                                          © Red Violet, Inc.       All Rights Reserved.
Case Studies (Cont’d)

     3                                                                       Background Screening

                                                          Leading Global Data & Analytics Company
                                         Timely and accurate information is critical to keep workplaces and businesses safe
          Customer needed a high-volume performant information solution to validate identity and fully profile applicant location historie s in support of background verifications
           and investigations. We won this business from competitive solutions because our cloud -native platform provided higher quality information through a more scalable
           and performant API at a better price. A customer since early 2017, we have established a great partnership that has seen thei r business with us grow exponentially
                                                                         since the early days of the relationship.

     4                                                             Consumer Profiling & Segmentation

                                                                      Leading PropTech Company
                                           The need for true predictive insights in real estate markets has never been greater
            As one of the most trusted providers of comprehensive real estate data nationwide, the customer set out to develop powerful t ools that allow their customers (real
            estate investors, agents, and brokers) to make informed decisions and stay ahead of the game. They needed to partner with an information solutions provider that
            would augment their comprehensive property coverage by resolving such information back to consumers, creating tools for their customers that provide predictive
          insights through propensity modeling. By leveraging our consumer identity graph through our flexible API, we were able to win their business by providing significantly
           better consumer information at scale in terms of both coverage and accuracy. A customer since late 2018, their volume with us has grown significantly as they have
                                                            integrated and incorporated additional solutions into their platform.

12                                                          © Red Violet, Inc.         All Rights Reserved.
Differentiation – red violet’s Intelligent Platform

                                                                                         Advanced, fully-automated identity
                                                                     1   Technology      intelligence platform designed to be used at
                                                                                         scale with the help of machine learning

                                                                                         CORE conducts analysis of billions of data
                                                                     2   Data
                                                                                         points to identify complex interrelationships

                                                                                         Automated monitoring, flexible APIs and
                                                                     3   Scalability &
                                                                                         industry-leading batch processing allows for
                                                                         Availability
                                                                                         virtually unlimited capacity and performance

                                                                                         Operates in secure cloud environments in
                                                                                         data centers across the U.S., reinforced by
                                                                     4   Security
                                                                                         thorough behavior analysis and automated
                                                                                         production systems

13                                         © Red Violet, Inc.   All Rights Reserved.
Differentiation – Technology                                                                                                                            1

             Harnessing the power of CORE, we have created the most advanced and performant identity intelligence platform.

           Next-Generation Platform                                                              Data Analytics and Engineering

       Proprietary, scalable, distributed memory, data                                                 Data unification/entity resolution at scale
       processing platform

       Superior to “map reduce” frameworks in
       performance and functionality                                                                   Graph analysis of complex
                                                                                                       interrelationships among billions of entities

       Built upon table operator abstractions using a
       functional programming approach

                                                                                                        Low latency/high throughput search and
                                                                                                        information retrieval solutions using Boolean
                                                                                                        and inverted indices
       Relational and graph database functionality

       Scalable/performant cloud-based infrastructure
                                                                                                        Distributed supervised and unsupervised
       that is fully automated
                                                                                                        machine learning

14                                                       © Red Violet, Inc.   All Rights Reserved.
Differentiation – Massive Unified Data Asset                                                                                                                                                2

                           Disparate Data Sources                                                            CORE Platform                                Actionable Intelligence

                                                             Automotive
                          Email &         Death
                            IP

              Mobile
                                                                              Social
                                                                                               Financial

                                                  Bankruptcies, Liens,
                             Employment
                                                    & Judgments

        Military

                                                                                                     Behavioral
                          Criminal        Property                           Predictive

      Relationships                                                                                                                                           Actionable
                                                            Location
                                                                                                                                                              Intelligence
                                                                                          Demographic
                                                                          Public
                   Meta          Foreclosures                             Record

                                                           Phone

                                                                                            Proprietary entity resolution technology that links   Actionable, real-time information, delivering
Includes proprietary, public record, publicly-available, and self-reported data             these data sources to identify people, businesses,        greater intelligence and unparalleled
                                                                                                assets, events and their interrelationships               insights for decision-making

15                                                                          © Red Violet, Inc.      All Rights Reserved.
Differentiation – Scalability and Availability                                                                                                                  3

                         We uncover the relevance of disparate data points utilizing our analytical capabilities to provide real-
                                time and insightful views of people, businesses, assets and their interrelationships.

                                                                                                                   Handling burst rates
       Flexible APIs built to                         Online access                                                 of over 40 million
          handle simple                            through an intuitive                                             detailed searches
      requests and complex                          interface designed                                                   per day
            integrations                           to provide fast and
                                                      effective results

                                  Multiple
                                  Access                 Best-in-class Batch                                        Scalability
                                Methods and              Processing platform                                           and
       Automated                   Tools                     for ingestion,
                                                                                                                    Availability
                                                           processing, and
 Monitoring solutions
                                                         delivery of large data
  to track changes in
                                                                   files
 consumer, business,
 and asset data points                                                                          Monitoring daily                              Scalable to
                                      Designed for                                             changes on over                            virtually unlimited
                                       accelerated                                                100 million                                 capacity and
                                     development of                                            consumers in 30                                performance
                                    Custom Solutions                                               minutes of
                                   based on any access                                          processing time
                                         method

16                                                             © Red Violet, Inc.   All Rights Reserved.
Differentiation – Security                                                                                                4

                  Built in a secure payment card industry (PCI) compliant cloud environment, we operate in data centers
                        across the U.S. using an intelligent framework and leveraging a microservices architecture.

                 Leading-Edge Security Features                                                     Secure Environment

                                       1     Processing of over 100 GB of log data daily

                                             Automated internal and customer activity
                                       2
                                             behavior analysis

     1   2   3    4
                                             Heavily fortified, fully auditable, secure
                                       3
                                             environment

                                             Automation of production systems to
                                       4
                                             enforce layered security

17                                               © Red Violet, Inc.       All Rights Reserved.
Why We Win

                                                                               Cloud-native technology platform providing the most
                Scalable and      Intelligent                                  advanced and performant identity intelligence
                Customizable       Interface
                 Solutions          Design

                                                                               Massively scalable and customizable platform meeting
                                                Dynamic &                      the high-volume needs of customers
       Customer-
                                                Seamless
     Centric Support
                                                 Scaling

                                                                               Significantly better data fusion at scale for improved
          Customer-                     Cloud-Native
           Tailored                      Proprietary                           coverage and accuracy
           Pricing                        Platform

                         Better Data
                           Fusion                                              Robust operating leverage and efficiency leading to
                                                                               customer-centric, value pricing

18                                                 © Red Violet, Inc.   All Rights Reserved.
Scalable Go-To-Market Strategy

                                  ▪   New opportunities are sourced from each of the 3 primary channels below
     New Customer Acquisition     ▪   Once the opportunity is qualified and credentialed for proper use case, they generally begin with a free trial
                                  ▪   The free trial is followed by an initial purchase on a transactional basis or minimum-committed monthly spend

                                                                                                                                            % of FY2020A Revenue
1

                 Inside Sales                           Cultivates relationships through inbound/outbound calling, and ultimately                  47%
                                                        closes business with their end-user markets

2
                                                        With leading industry knowledge, provides a more personal, face-to-face
                Strategic Sales                         approach for top-tier accounts within certain industries                                   19%

3                                                       We power organizations with a significant foothold in industries that we
           Distributors, Resellers &                    have not historically served, as well as to further penetrate those industries             34%
              Strategic Partners                        that we do serve

     Existing Customers
                                                        As organizations derive benefits from our solutions, we are able to expand within organizations as
               Land and Expand                          additional use cases are presented across departments, divisions and geographic locations and
                                                        customers become increasingly reliant on our solutions in their daily workflow

    19                                              © Red Violet, Inc.     All Rights Reserved.
Financial Highlights

          $34.6M                             59%                                   75%
                                        FY2017 - FY2020
         FY2020 Revenue                                                     Q2’21 Adj. Gross Margin
                                         Revenue CAGR

             29%                             81%                                    6%
                                       Q2’21 Contractual                        Q2’21 Revenue
     Q2’21 Adj. EBITDA Margin
                                           Revenue                                 Attrition

20                              © Red Violet, Inc.   All Rights Reserved.
Robust Top-Line Momentum & Building Substantial Operating Leverage

                                              Revenue and Adj. Gross Margin                                                                                                                                  Adj. EBITDA
      ($ in millions)                                                                                                                                               ($ in millions)
                 Adj. Gross    Margin(1)                                                                     ’17 – ’20                                                        Adj. EBITDA Margin(1)
                 Revenue                                                                                    CAGR: 59%                                                         Adj. EBITDA(1)

                                                                                                                                                                                                                                  17.1%
                                                                                                                                                                                                                           6.3%

                                                                                                                                      67.4%                                                           (26.6%)
                                                                                                                                                                                                                                  $5.9
                                                                                                59.5%

                                                                                                                                      $34.6
                                                                                                                                                                              (96.8%)
                                                          47.0%
                                                                                                $30.3                                                                                                                      $1.9

                     17.6%
                                                           $16.3

                                                                                                                                                                                                      ($4.3)
                      $8.6

                                                                                                                                                                               ($8.3)

                     2017                                  2018                                  2019                                 2020                                      2017                  2018                 2019   2020

     (1)   Adjusted gross margin, adjusted EBITDA and adjusted EBITDA margin are non-GAAP financial measures. For a reconciliation of these non-GAAP financial measures, please see slide 25.

21                                                                                                                 © Red Violet, Inc.                         All Rights Reserved.
Strong Unit Economics Underpin Financial Model Leverage

                                              Revenue and Adj. Gross Margin                                                                                                                                     Adj. EBITDA
      ($ in millions)                                                                                                                                               ($ in millions)
                 Adj. Gross    Margin(1)                                                                                                                                      Adj. EBITDA Margin(1)
                 Revenue                                                                                                                                                      Adj. EBITDA(1)

                                                                                                                                                                                                                                                         28.8%
                                                                                                                                                                                                                                                 28.1%

                                                                                                                                             75.0%
                                                                                                                               73.0%                                                                                             22.5%
                                                                                                  70.8%         69.9%

                                                       62.3%         64.6%          63.3%                                                                                                                        18.6%
                                        62.2%
                          57.9%
            53.5%                                                                                                                                                                               13.8%                    12.9%           13.4%
                                                                                             COVID-related
                                                                                          slowdown & recovery
                                                                                                                                             $10.9                                                                                                       $3.1
                                                                                                                               $10.2                                                                    8.9%
                                                                                                                                                                                                                                                 $2.9
                                                        $9.1          $9.3                         $9.3                                                                                4.9%
                                                                                                                  $9.0
                                         $8.3                                                                                                                                                                                    $2.1
                           $7.2                                                      $7.1                                                                                                                        $1.7
                                                                                                                                                                       (7.0%)
            $5.7                                                                                                                                                                                $1.1                                     $1.2
                                                                                                                                                                                                        $0.8             $0.9

                                                                                                                                                                                        $0.4

                                                                                                                                                                        ($0.4)

                                                                                                                                                                        Q1'19         Q2'19     Q3'19   Q4'19    Q1'20   Q2'20   Q3'20   Q4'20   Q1'21   Q2'21
           Q1'19          Q2'19         Q3'19          Q4'19         Q1'20         Q2'20          Q3'20         Q4'20          Q1'21         Q2'21

     (1)   Adjusted gross margin, adjusted EBITDA and adjusted EBITDA margin are non-GAAP financial measures. For a reconciliation of these non-GAAP financial measures, please see slide 25.

22                                                                                                                 © Red Violet, Inc.                         All Rights Reserved.
Appendix

© Red Violet, Inc.   All Rights Reserved.
Use and Reconciliation of Non-GAAP Financial Measures
Management evaluates the financial performance of our business on a variety of key indicators, including non-GAAP metrics of adjusted EBITDA, adjusted EBITDA margin, adjusted gross profit and adjusted gross margin. Adjusted EBITDA is a financial
measure equal to net loss, the most directly comparable financial measure based on US GAAP, excluding interest income, net, depreciation and amortization, share-based compensation expense, litigation costs, net, sales and use tax expense,
insurance proceeds in relation to settled litigation, transition service income, and write-off of long-lived assets and others. We define adjusted EBITDA margin as adjusted EBITDA as a percentage revenue. We define adjusted gross profit as revenue less
cost of revenue (exclusive of depreciation and amortization) and adjusted gross margin as adjusted gross profit as a percentage of revenue.
                                                                                                                                                                            (Unaudited)
                       (In thousands)                                                     2017             2018             Q1'19          Q2'19          Q3'19          Q4'19          Q1'20          Q2'20          Q3'20          Q4'20          Q1'21          Q2'21
                       Net income (loss)                                              $   (21,500) $        (6,868)     $     (1,378) $      (3,850) $        (992) $      (4,856) $      (1,481) $      (2,532) $        (925) $      (1,875) $       (578) $       1,761
                       Interest income, net                                                     -              (84)              (40)           (37)           (46)           (13)           (31)             -              7              6             5              4
                       Depreciation and amortization                                        1,138            1,996               618            681            750            840            910            992          1,118          1,196         1,258          1,330
                       Share-based compensation expense                                     2,871              709               274          3,609          1,407          4,623          2,221          2,342          1,853          1,648         2,048          2,165
                       Gain on extinguishment of debt                                           -                -                 -              -              -              -              -              -              -              -             -         (2,175)
                       Litigation costs, net                                                9,191              382                94            (47)             7              -              -              -              -              -           120              6
                       Sales and use tax expense                                                -                -                 -              -              -            205              -              -              -              -             -              -
                       Insurance proceeds in relation to settled litigation                     -             (350)                -              -              -              -              -              -              -              -             -              -
                       Transition service income                                                -             (218)                -              -              -              -              -              -              -              -             -              -
                       Write-off of long-lived assets and others                                -               92                30              -             11              3            111            106             35            222            19             41
                       Adjusted EBITDA                                                $    (8,300) $        (4,341)     $       (402) $         356 $        1,137 $          802 $        1,730 $          908 $        2,088 $        1,197 $       2,872 $        3,132
                       Revenue                                                        $     8,578 $         16,302      $      5,734 $        7,245 $        8,257 $        9,050 $        9,300 $        7,056 $        9,267 $        8,963 $      10,217 $       10,879

                       Net income (loss) margin                                           (250.6%)          (42.1%)          (24.0%)        (53.1%)        (12.0%)        (53.7%)        (15.9%)        (35.9%)        (10.0%)        (20.9%)         (5.7%)          16.2%
                       Adjusted EBITDA margin                                              (96.8%)          (26.6%)           (7.0%)           4.9%          13.8%           8.9%          18.6%          12.9%          22.5%          13.4%         28.1%           28.8%
                                                                                                                                                                            (Unaudited)
                       (In thousands)                                                     2017             2018             Q1'19          Q2'19          Q3'19          Q4'19          Q1'20          Q2'20          Q3'20          Q4'20          Q1'21          Q2'21
                       Revenue                                                        $     8,578      $    16,302      $      5,734   $      7,245   $      8,257   $      9,050   $      9,300   $      7,056   $      9,267   $      8,963   $    10,217    $    10,879
                       Cost of revenue (exclusive of depreciation and amortization)         7,066            8,638             2,669          3,052          3,122          3,414          3,292          2,587          2,703          2,694         2,761          2,720
                       Depreciation and amortization of intangible assets                     866            1,730               554            617            689            777            850            934          1,063          1,143         1,258          1,330
                       Gross profit                                                           646            5,934             2,511          3,576          4,446          4,859          5,158          3,535          5,501          5,126         6,198          6,829
                       Depreciation and amortization of intangible assets                     866            1,730               554            617            689            777            850            934          1,063          1,143         1,258          1,330
                       Adjusted gross profit                                          $     1,512      $     7,664      $      3,065   $      4,193   $      5,135   $      5,636   $      6,008   $      4,469   $      6,564   $      6,269   $     7,456    $     8,159

                       Gross margin                                                               8%              36%           44%           49.4%          53.8%          53.7%          55.5%          50.1%          59.4%          57.2%          60.7%          62.8%
                       Adjusted gross margin                                                     18%              47%           53%           57.9%          62.2%          62.3%          64.6%          63.3%          70.8%          69.9%          73.0%          75.0%

In order to assist readers of our consolidated financial statements in understanding the operating results that management uses to evaluate the business and for financial planning purposes, we present non-GAAP measures of adjusted EBITDA, adjusted
EBITDA margin, adjusted gross profit and adjusted gross margin as supplemental measures of our operating performance. We believe they provide useful information to our investors as they eliminate the impact of certain items that we do not consider
indicative of our cash operations and ongoing operating performance. In addition, we use them as an integral part of our internal reporting to measure the performance and operating strength of our business.
We believe adjusted EBITDA, adjusted EBITDA margin, adjusted gross profit and adjusted gross margin are relevant and provide useful information frequently used by securities analysts, investors and other interested parties in their evaluation of the
operating performance of companies similar to ours and are indicators of the operational strength of our business. We believe adjusted EBITDA eliminates the uneven effect of considerable amounts of non-cash depreciation and amortization, share-
based compensation expense and the impact of other non-recurring items, providing useful comparisons versus prior periods or forecasts. Adjusted EBITDA margin is calculated as adjusted EBITDA as a percentage of revenue. Our adjusted gross profit
is a measure used by management in evaluating the business’s current operating performance by excluding the impact of prior historical costs of assets that are expensed systematically and allocated over the estimated useful lives of the assets, which
may not be indicative of the current operating activity. Our adjusted gross profit is calculated by using revenue, less cost of revenue (exclusive of depreciation and amortization). We believe adjusted gross profit provides useful information to our investors
by eliminating the impact of non-cash depreciation and amortization, and specifically the amortization of software developed for internal use, providing a baseline of our core operating results that allow for analyzing trends in our underlying business
consistently over multiple periods. Adjusted gross margin is calculated as adjusted gross profit as a percentage of revenue.
Adjusted EBITDA, adjusted EBITDA margin, adjusted gross profit and adjusted gross margin are not intended to be performance measures that should be regarded as an alternative to, or more meaningful than, financial measures presented in
accordance with GAAP. The way we measure adjusted EBITDA, adjusted gross profit and adjusted gross margin may not be comparable to similarly titled measures presented by other companies, and may not be identical to corresponding measures
used in our various agreements.
      24                                                                                               © Red Violet, Inc.                    All Rights Reserved.
Supplemental Metrics and Definitions
The following metrics are intended as a supplement to the financial information found in this presentation and other information furnished or filed with the SEC. These supplemental metrics are not necessarily derived from any underlying financial statement amounts. We believe
these supplemental metrics help investors understand trends within our business and evaluate the performance of such trends quickly and effectively. In the event of discrepancies between amounts in these tables and the Company's historical disclosures or financial statements,
readers should rely on the Company's filings with the SEC and financial statements in the Company's most recent earnings release.
We intend to periodically review and refine the definition, methodology and appropriateness of each of these supplemental metrics. As a result, metrics are subject to removal and/or changes, and such changes could be material.
                                                                                                                                                                                  (Unaudited)
                                 (Dollars in thousands)                                                 Q1'19               Q2'19             Q3'19             Q4'19               Q1'20                Q2'20             Q3'20             Q4'20             Q1'21             Q2'21
                                 Customer metrics
                                     idiCORE - billable customers (1)                                       4,020               4,370             4,781             5,064                5,326               5,375             5,758             5,726             5,902             6,141
                                    FOREWARN - users(2)                                                    15,444              19,721            23,853            30,577               36,506              40,857            44,927            48,377            58,831            67,578
                                 Revenue metrics
                                     Contractual revenue % (3)                                                  67%                 62%               66%               66%                69%                   79%               68%               77%               80%               81%
                                     Revenue attrition % (4)                                                    5%                  5%                6%                6%                  8%                   11%               10%               11%               7%                6%
                                     Revenue from new customers (5)                                 $       1,285       $       1,596     $       1,406     $       1,018     $          1,417       $           916   $           726   $           877   $           967   $           929
                                     Base revenue from existing customers (6)                       $       3,593       $       4,480     $       5,578     $       6,690     $          6,629       $       5,047     $       5,797     $       6,678     $       7,351     $       8,354
                                     Growth revenue from existing customers (7)                     $           856     $       1,169     $       1,273     $       1,342     $          1,254       $       1,093     $       2,744     $       1,408     $       1,899     $       1,596
                                 Platform financial metrics
                                     Platform revenue (8)                                           $       4,894       $       6,152     $       7,086     $       7,651     $          8,109       $       6,856     $       8,968     $       8,603     $       9,813     $      10,588
                                     Cost of revenue (exclusive of depreciation and amortization)   $       2,069       $       2,287     $       2,286     $       2,431     $          2,498       $       2,428     $       2,489     $       2,448     $       2,488     $       2,529
                                    Adjusted gross margin                                                       58%                 63%               68%               68%                69%                   65%               72%               72%               75%               76%
                                 Services financial metrics
                                     Services revenue (9)                                           $           840     $       1,093     $       1,171     $       1,399     $          1,191       $           200   $           299   $           360   $           404   $           291
                                     Cost of revenue (exclusive of depreciation and amortization)   $           600     $           765   $           836   $           983   $            794       $           159   $           214   $           246   $           273   $           191
                                    Adjusted gross margin                                                       29%                 30%               29%               30%                33%                   21%               28%               32%               32%               34%
                                 Other metrics
                                    Employees - sales and marketing                                              47                  48                48                51                     51                53                52                53                56                57
                                    Employees - support                                                           6                   7                 8                 7                      8                 8                 9                 9                 9                 9
                                    Employees - infrastructure                                                   12                  12                13                11                     13                12                12                14                15                16
                                    Employees - engineering                                                      20                  20                25                23                     26                27                27                32                31                33
                                    Employees - administration                                                   14                  14                13                16                     15                14                15                18                16                19
(1)   We define a billable customer of idiCORE as a single entity that generated revenue in the last three months of the period. Billable customers are typically corporate organizations. In most cases, corporate organizations will have multiple users and/or departments purchasing
      our solutions, however, we count the entire organization as a discrete customer.
(2)   We define a user of FOREWARN as a unique person that has a subscription to use the FOREWARN service as of the last day of the period. A unique person can only have one user account.
(3)   Contractual revenue % represents revenue generated from customers pursuant to pricing contracts containing a monthly fee and any additional overage divided by total revenue. Pricing contracts are generally annual contracts or longer, with auto renewal.
(4)   Revenue attrition is defined as the revenue lost as a result of customer attrition, net of reinstated customer revenue. It excludes expansion revenue and revenue from FOREWARN. Revenue is measured once a customer has generated revenue for six consecutive months.
      Revenue is considered lost when all revenue from a customer ceases for three consecutive months; revenue generated by a customer after the three-month loss period is defined as reinstated revenue. Revenue attrition percentage is calculated on a trailing twelve-month
      basis, the numerator of which is the revenue lost during the period due to attrition, net of reinstated revenue, and the denominator of which is total revenue based on an average of total revenue at the beginning of each month during the period.
(5)   Revenue from new customers represents the total monthly revenue generated from new customers in a given period. A customer is defined as a new customer during the first six months of revenue generation.
(6)   Base revenue from existing customers represents the total monthly revenue generated from existing customers in a given period that does not exceed the customers' trailing six-month average revenue. A customer is defined as an existing customer six months after their
      initial month of revenue.
(7)   Growth revenue from existing customers represents the total monthly revenue generated from existing customers in a given period in excess of the customers' trailing six-month average revenue.
(8)   Platform revenue consists of both contractual and transactional revenue generated from our data fusion technology platform, CORE. It includes all revenue generated through our idiCORE and FOREWARN solutions. The cost of revenue, which consists primarily of data
      acquisition costs, remains relatively fixed irrespective of revenue generation.
(9)   Services revenue consists of transactional revenue generated from our idiVERIFIED service. The cost of revenue, which consists primarily of third-party servicer costs, is variable.
       25                                                                                                             © Red Violet, Inc.                    All Rights Reserved.
You can also read